2011/10

ドル円1時間足。下落なら77.50-60円付近からは値段が走るのか?/Dollar/Yen Hourly. If the market price may go down, 77.50-60yen around may work as pivot point.

2011/10/31

ドル円の1時間足についてです。

オセアニア時間帯の価格を抜いて書いています。

1枠0.1円、3枠転換の終値ポイントアンドフィギュアです。

今朝、介入がありました。

今のところ、前回高値80円を上回ることができず、下落しています。

前回の介入では半値押し付近(78.40-30円)から値段が一方向に走り全値押ししています。

今回も77.50-60円付近から値段が走りやすいかもしれません。

This is Dollar/Yen hourly rate.

The Oceania time zone market price is pulled out.

This is 0.1 price change and 3 box reversal close price’s Point and Figure chart.

The intervention was occurred in this morning.

Now, the market price can not go over the last high price 80yen and goes down side.

In the last intervention, the market price goes one way from 78.40-30yen around.

If it applies in this case, the market price may go one way from 77.50-60 around.

PF


相場分析のリクエストがありましたら“Contact Us”からお知らせください。ご要望にお応えできるように努力いたします。

このブログはあくまでも個人的な見解であり、投資判断は各自でお願い致します。当ブログは一切の投資損益に対する責任を負いません。

ホームページに来て下さってありがとうございます。明日もよろしくお願いいたします。

If you have some request to analyze, please write to “Contact Us”.

We do best effort for your request.

These are only personal opinions on this blog, and you need the investment judgment in each one. This blog doesn’t assume the responsibility to all the investment profit and loss.

Thank for watching our contents. My best regards next day.


ドル円中長期シナリオ/Dollar/Yen Mid to long term tactics

2011/10/30

ドル円の週足を使って、中長期のドル円をシナリオ考えたいと思います。

We analyze Dollar/Yen Mid to long term tactics by weekly chart.


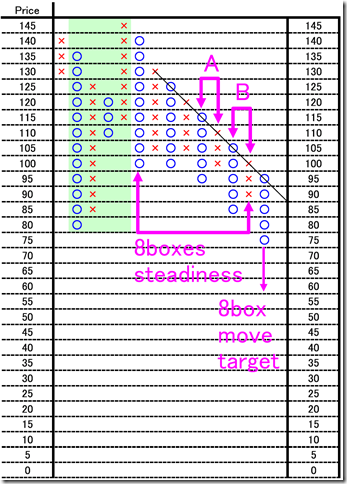
1991年からの1枠5円3枠反転のポイントアンドフィギュアです。

私たちは2つのシナリオを想定しました。


  • シナリオ1:このままか70円台前半で反転する。

5枠下落後、3枠上昇パターン(A,B)を直近は繰り返していることを考慮すると、このままか70円台前半の短い滞空時間で反転するパターン。


  • シナリオ2:60円台前半を目指す。

8枠持ち合いからの8枠ムーブで底をつける。その場合50円台も一瞬はあってもおかしくないと考えられます。


This is 5 yen price change and 3 box reversal close price’s Point and Figure chart from 1991.

We consider two kinds of tactics.


  • Tactics 1: Immediately or 70yen high may become reversal point.

The market price move as after 5 boxes down side move, 3 boxes recover (A and B); immediately or 70yen high may become reversal point.


  •  Tactics 2: The market price may reach 60yen low.

After 8 boxes steadiness, the market price may move 8 boxes.

In this case, the market price may reach the level of 50 yen in short term.

5


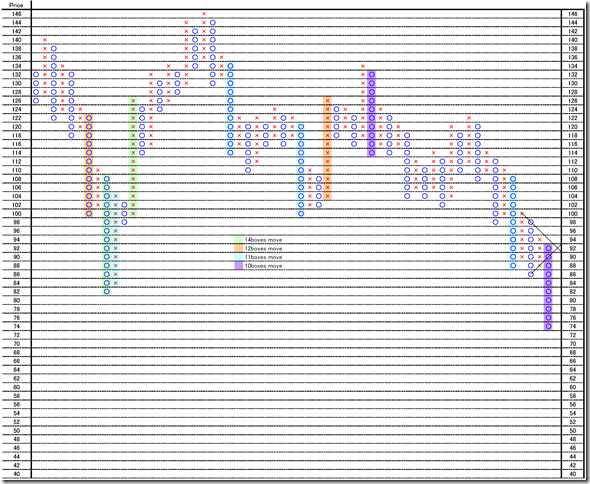
1991年からの1枠2円3枠反転のポイントアンドフィギュアです。

59列ありますがそのうち一方向に10枠以上動いたのは10列、最大は14枠のムーブです。

最大の14枠ムーブであるなら66円-68円。

相場なのでなんとも言えませんが、反転はいつ起きてもおかしくないと考えられます。

This is 2 yen price change and 3 box reversal close price’s Point and Figure chart from 1991.

In this chart, there are 59 rows and ten and more over boxes moved to one direction was 10 cases. And maximum move was 14 boxes.

If the market price may move 14boxes, the target price may become 66-68yen.

We can not predict the market, but we think reversal may occur sooner.

2


相場分析のリクエストがありましたら“Contact Us”からお知らせください。ご要望にお応えできるように努力いたします。

このブログはあくまでも個人的な見解であり、投資判断は各自でお願い致します。当ブログは一切の投資損益に対する責任を負いません。

ホームページに来て下さってありがとうございます。明日もよろしくお願いいたします。

If you have some request to analyze, please write to “Contact Us”.

We do best effort for your request.

These are only personal opinions on this blog, and you need the investment judgment in each one. This blog doesn’t assume the responsibility to all the investment profit and loss.

Thank for watching our contents. My best regards next day.

© 2024 Retar