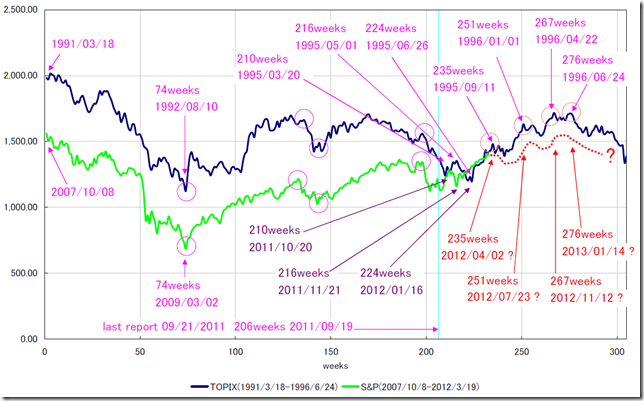
本日はS&P500とTOPIXの週足終値を比較しました。
前回のレポート(2011/09/21)は、水色の線の位置です。
S&P500は2007年最高値を基点にし、TOPIXは1991年の最高値を基点にグラフを作成しています。(左端)
S&P500もTOPIXも、○で示した同じような部分でピークを打っていることがわかります。
216週にあたる2011/11/21のボトム位置が少しずれてきているようです。
TOPIXに沿ってS&P500の相場が進んでいくと主なピークポイントは2012/04/02、2012/07/23、2012/11/12、2013/01/14などがあります。
Today, we compare S&P 500 and TOPIX weekly close price data.
Last report (09/21/2011) wrote point is water blue line.
TOPIX is creating the graph on the basis of the highest price in 1991 and S&P500 is creating the graph on the basis of the highest price in 2007. (Left side)
We can see some similar peak point S&P500 and TOPIX. (Magenta circle)
But in 11/21/2011 (This is 216weeks) the market peak does not fits the past TOPIX market.
If the S&P 500 market price may follow the past TOPIX price, the major peaks may become 04/02/2012, 07/23/2012, 11/12/2012 and 01/14/2013.
相場分析のリクエストがありましたら“Contact Us”からお知らせください。ご要望にお応えできるように努力いたします。
このブログはあくまでも個人的な見解であり、投資判断は各自でお願い致します。当ブログは一切の投資損益に対する責任を負いません。
ホームページに来て下さってありがとうございます。明日もよろしくお願いいたします。
If you have some request to analyze, please write to “Contact Us”.
We do best effort for your request.
These are only personal opinions on this blog, and you need the investment judgment in each one. This blog doesn’t assume the responsibility to all the investment profit and loss.
Thank for watching our contents. My best regards next day.

