2016/12

ドル円1時間足・ワイルドな相場?・117円までの戻りも114円台前半への下落もありか/USDJPY hourly; Volatility will be higher? The price will reach 117yen around and 114yen low. /美元/日元。波动率会更高吗?价格将达到117日元左右,还是114日元低。

2016/12/29

ドル円1時間足・ワイルドな相場?・117円までの戻りも114円台前半への下落もありか

USDJPY hourly; Volatility will be higher? The price will reach 117yen around and 114yen low.

美元/日元。波动率会更高吗?价格将达到117日元左右,还是114日元低。


結論は天井感いっぱい、ボラティリティ上がりそう!

新高値は週足のトレンドラインブレークとなるため、強気の加速しそうなポイントです。(2016/12/17レポート参照

Our conclusion is this market seems to be peaked out and volatility will be higher.

A new high will mean trend line breaking in weekly chart and trend will be accelerate. (See 12/17/2016 report)


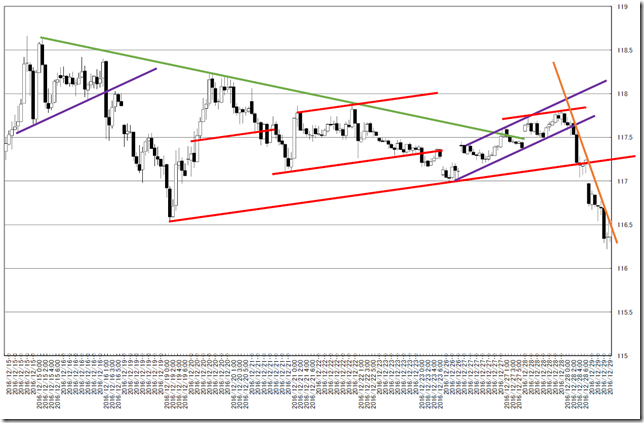
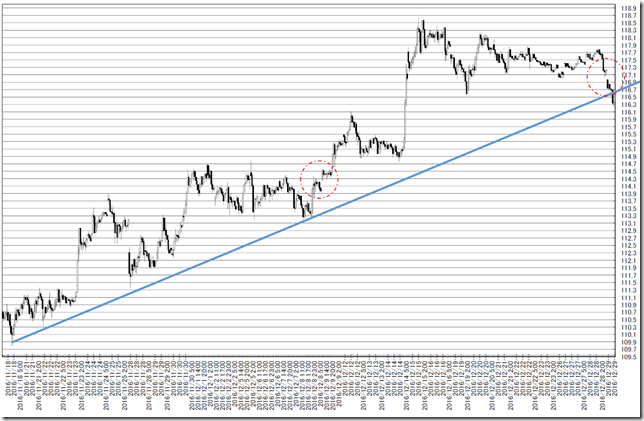
トレンドラインです。

1時間足を使用しオセアニア時間帯を省いています。

600手のサポートを切ってきています。

弱気および持ち合いを示唆しており、天井感満点です。

しかし、117円台と114円台に窓を残しています。

このチャートの特徴は窓を埋めにかかる点です。

どちらに振れるにもそれなりの値幅が出そうな雰囲気です。

This is trend line chart.

We used hourly data and the Oceania time zone market price is pulled out.

The market price cut the major support in 600 candle stick chart.

This is bear signal and often becomes peaked out.

But the price remained gaps at 117yen around and 114yen around.

This market unique point is “Gap will bury”.

In any way, this market will be volatile.

chart1


オレンジを超えてからが戻しの開始です。

窓付近と赤のレジスタンスが同位置にあるため、117円台への戻しを想定したいと思います。

Cutting orange line will be a start of recovery.

The red line is close to the price gap and recovery will be 117yen around.

chart2


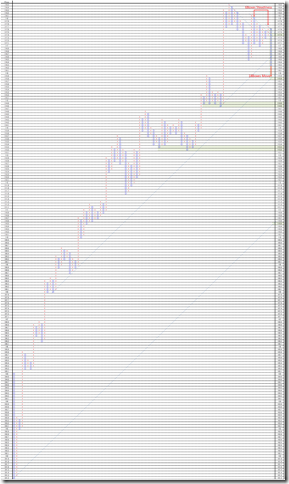
1枠0.1円、3枠転換の終値ポイントアンドフィギュアです。

1時間足を使用しオセアニア時間帯を省いています。

6枠持ち合いからの下方ブレークです。

ターゲットは115.90円。

メジャーレジスタンスは117.40円、メジャーサポートは110.50円。

上げ止まったようにみえても、大局的には再上昇の可能性を秘めているとみています。

This is 0.1 price change and 3 box reversal close price’s Point and Figure chart.

We used hourly data and the Oceania time zone market price is pulled out.

Now is breaking from 6 boxes steadiness.

The target price is 115.90yen.

The major resistance is 117.40yen and the major support is 110.50yen.

Rally may seem to stop but in big-picture, now seems to be only dip.

PF


相場分析のリクエストがありましたら“Contact Us”からお知らせください。ご要望にお応えできるように努力いたします。

このブログはあくまでも個人的な見解であり、投資判断は各自でお願い致します。当ブログは一切の投資損益に対する責任を負いません。

ホームページに来て下さってありがとうございます。明日もよろしくお願いいたします。

If you have some request to analyze, please write to “Contact Us”.

We do best effort for your request.

These are only personal opinions on this blog, and you need the investment judgment in each one. This blog doesn’t assume the responsibility to all the investment profit and loss.

Thank for watching our contents. My best regards next day.

如果您需要行情分析,请点击“Contact Us”联系我们。我们将尽力满足您的要求。

本博客仅为个人意见,请各自做出投资判断。本博客概不对任何投资盈亏负责。

感谢您访问本博客。欢迎再次使用。


日経平均日足短期・2002年のダブルボトム後226手の日柄に倣うなら離れは2017/1/20か2017/1/21/NIKKEI 225 daily short term view; if this market will follow 2002’s “HIGARA”, launching will be 1/20/2017 or 1/21/2017. /日经225。如果这个市场会类似2002年的“日柄”, 就发射将是2017年1月20号还是2017年1月21号。

2016/12/28

日経平均日足短期・2002年のダブルボトム後226手の日柄に倣うなら離れは2017/1/20か2017/1/21

NIKKEI 225 daily short term view; if this market will follow 2002’s “HIGARA”, launching will be 1/20/2017 or 1/21/2017.

日经225。如果这个市场会类似2002年的“日柄”, 就发射将是2017年1月20号还是2017年1月21号。


本日は日経225超短期日足についてです。

ダブルボトム後、226手の高値圏(安値圏)というのは見かけたことがある相場です。

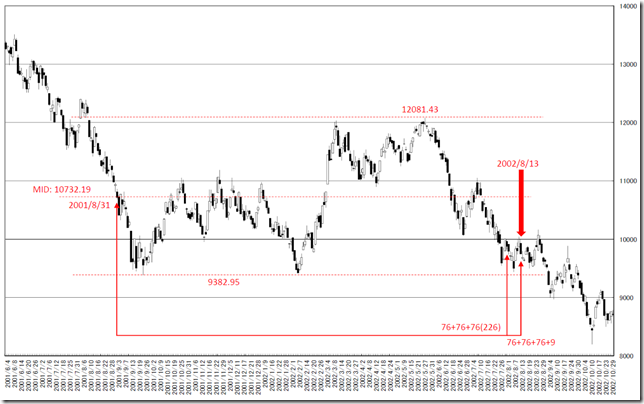
2001年から2002年にかけての相場は安値への離れとなった局面でした。

結論は、同じ日柄に従うなら2017/1/20か2017/1/21は離れとなる変化日となります。

Today is about N225 daily.

We can know the price reach the higher or lower price range after taking double dip and 226 business day.

From 2001 to 2002 market, the market price launched down side.

Applying to this “HIGARA” to the latest market, 1/20/2017 or 1/21/2017 will be launching point.


2001年から2002年にかけてのマーケットです。

ダブルボトム後、226手にかけての値動きです。

現在との違いは新高値にむけた動きなのか、新安値にむけた動きなのかの違いです。

This is from 2001 to 2002 market.

This occasion is after taking double dip and 226 business days around.

The difference between this occasion and the latest market is taking new high or new low.

chart1


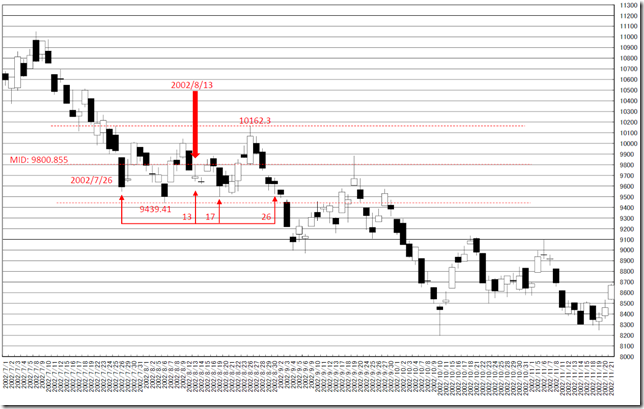
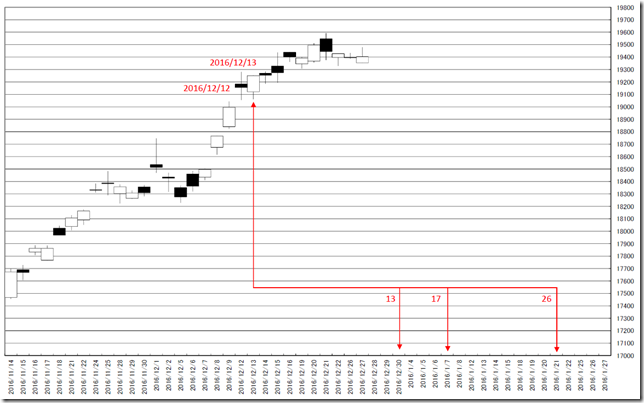
226+9手の意味をみていくと、持ち合い半値試しとなっていました。

持ち合い起点は13手前。

8手で下げ止まり、17手で押し、26手から離れとなっていました。

The meaning of 226+9 business days was this day touch the half price of the steadiness.

The start of the steadiness was 13 business days before.

The price stopped falling in 8 business days and 17 business days was dip and 26 business days was launching point.

chart2


現在の相場に当てはめると、持ち合い起点は2016/12/12又は2016/12/13が持ち合い起点。

2016/12/30に半値試し、半値は大よそ19150円。

8手で高値試しとなっているため、17手となる2017/1/7に高値試しか。

26手となる2017/1/21からの離れとなる可能性を秘めます。

いずれにせよ、こうした日柄は注意を要するとみています。

Applying to the latest market, the start of the steadiness is 12/12/2016 or 12/13/2016.

The half price challenging point will be 12/30/2016 and the half price will be 19150yen around.

The market price challenged high price in 8 business days and 17 business days may be the challenging point of the higher price.

26 business day (1/17/2017) may be launching point.

In anyway, these points will be notable “HENKABI” points.

chart3


相場分析のリクエストがありましたら“Contact Us”からお知らせください。ご要望にお応えできるように努力いたします。

このブログはあくまでも個人的な見解であり、投資判断は各自でお願い致します。当ブログは一切の投資損益に対する責任を負いません。

ホームページに来て下さってありがとうございます。明日もよろしくお願いいたします。

If you have some request to analyze, please write to “Contact Us”.

We do best effort for your request.

These are only personal opinions on this blog, and you need the investment judgment in each one. This blog doesn’t assume the responsibility to all the investment profit and loss.

Thank for watching our contents. My best regards next day.

如果您需要行情分析,请点击“Contact Us”联系我们。我们将尽力满足您的要求。

本博客仅为个人意见,请各自做出投资判断。本博客概不对任何投资盈亏负责。

感谢您访问本博客。欢迎再次使用。

© 2024 Retar