日経平均週足・羽黒2号線・やっぱり2008年のチャートと瓜二つ
NIKKEI 225 weekly is “HAGURO” No.2 formation; now is perfectly similar to 2008 chart.
日经225。羽黑2号线。现在和2008年图表完全相似。
テクニカル分析は過去をなぞるから、成立します。
だだし、時々、相場が尻尾をつかまれると“変体”します。
分からなくなったら再び証拠集めです。
The reason why technical analysis work is market follow the past price movement.
But sometimes, the price movement change itself.
When we cannot follow the market, we only gather evidences.
本日は日経225についてです。
結論は、2008年チックなので、引き続き警戒を解かず。
Today is about N225.
Our conclusion is now is still similar to 2008 circumstances and we need to watch.
「日経平均週足・羽黒4号線・2008/5/26の週との不気味な共通点」(2017/2/10レポート)と報告しています。
2017/3/31に「日経平均週足・羽黒14(15)号線・普通なら底堅い、しかし2008/6/16の週とも似ている」と報告しています。
「日経平均週足・羽黒16(10)号線・2008/6/23の週に似る・過去に倣うならレジスタンスは18664.63円」(2017/4/7)と報告しています
「日経平均週足・羽黒16(10)号線・やっぱり2008/6/30の週にそっくり」(2017/4/16)と報告しています。
「日経平均週足・羽黒8号線・しばらくは底堅そうだが・・・」(2017/4/23)と報告しています。
We reported “NIKKEI 225 weekly is “HAGURO” No.4 formation; Now seem to be Déjà vu of 5/26/2008 week” in 2/10/2017.
We reported “NIKKEI 225 weekly is “HAGURO” No.16(10) formation; Now is similar to the week of 6/23/2008; following the past price movement, 18664.63yen will work as resistance” in 4/7/2017
We reported “NIKKEI 225 weekly is “HAGURO” No.16(10) formation; Now is perfect similar to the week of 6/30/2008” in 4/16/2017.
日経225週足線は羽黒2号線となりました。
日経225週足線では200週で羽黒2号線は34回出現しています。
羽黒2号線の単体では判定不能です。
想定通り底堅さを発揮しました。(2017/4/23参照)
引き続き、2008年のマーケットと似ている不気味さを忘れたくはありません。
In this week, N225 formed “HAGURO” No. 2 formation.
In past 200 weeks, N225 price formed “HAGURO” No. 2 formation was 34 times.
We cannot judge the meaning of single “HAGURO” No. 2 formation.
This was stable market. (See 4/23/2017)
We never forget the similarity of 2008 market.
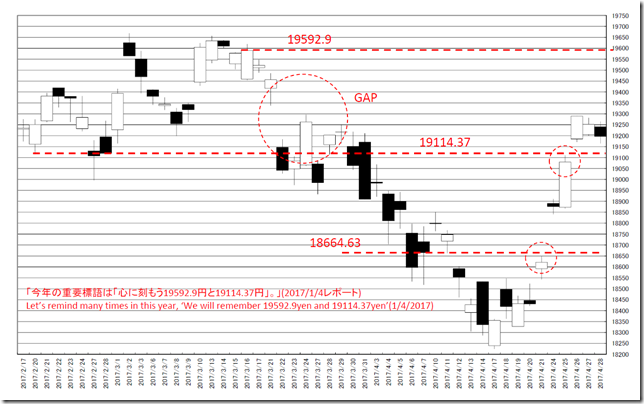
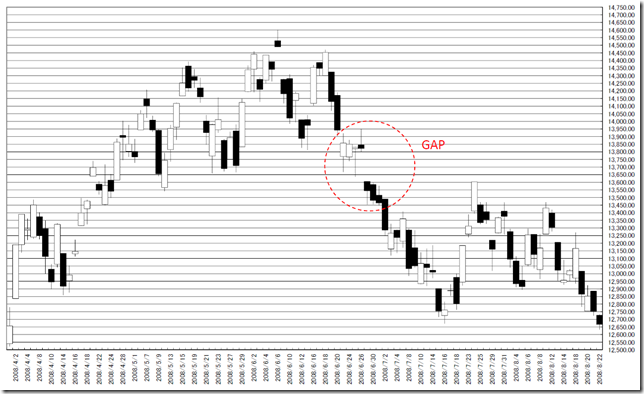
日足です。
むしろ興味深いのは、上の大窓です。
2008年相場でも鉄板窓が示現しました。
「なんか似てるなぁ~~~」と感じますが、いかがでしょうか?
This is daily chart.
Rather than, most notable point is upper side gap.
In 2008 market, “Iron plated gap” was revealed.
We think this is similar and how do you feel?
相場分析のリクエストがありましたら“Contact Us”からお知らせください。ご要望にお応えできるように努力いたします。
このブログはあくまでも個人的な見解であり、投資判断は各自でお願い致します。当ブログは一切の投資損益に対する責任を負いません。
ホームページに来て下さってありがとうございます。明日もよろしくお願いいたします。
If you have some request to analyze, please write to “Contact Us”.
We do best effort for your request.
These are only personal opinions on this blog, and you need the investment judgment in each one. This blog doesn’t assume the responsibility to all the investment profit and loss.
Thank for watching our contents. My best regards next day.
如果您需要行情分析,请点击“Contact Us”联系我们。我们将尽力满足您的要求。
本博客仅为个人意见,请各自做出投资判断。本博客概不对任何投资盈亏负责。
感谢您访问本博客。欢迎再次使用。


