日経平均波動計算・上げるなら21300円、下げるなら9000円程度がターゲット
NIKKEI 225 wave calculation; if rally will continue, target is 21300yen around and falling target is 9000yen around.
日经225。波形计算。上边的目标价为21300日元。下边的目标价为9000日元。
本日は日経225についてです。
Today is about N225.
「日経平均・過去をなぞるなら20000円超の値もちはどんなに長くても今年10月末まで?・20200円を超えたらとりあえずLong」(2017/6/8)
現在の相場は「やる気のないラリー中」だと言うのがメインシナリオです。
Our main view is now is weak rally.
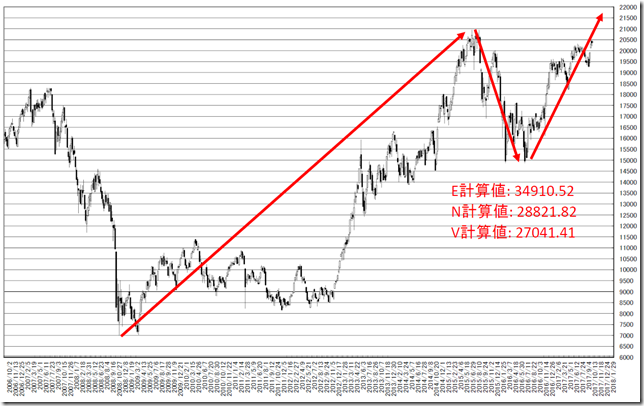
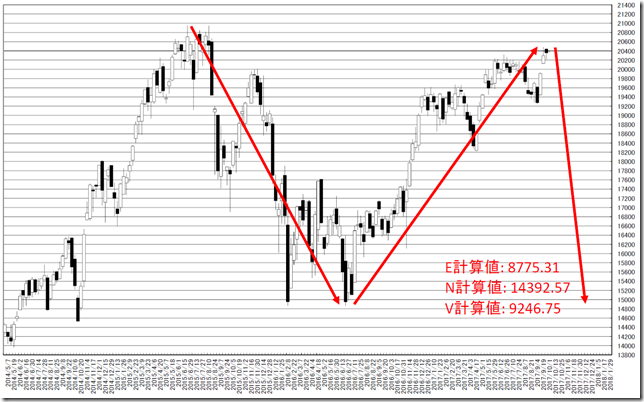
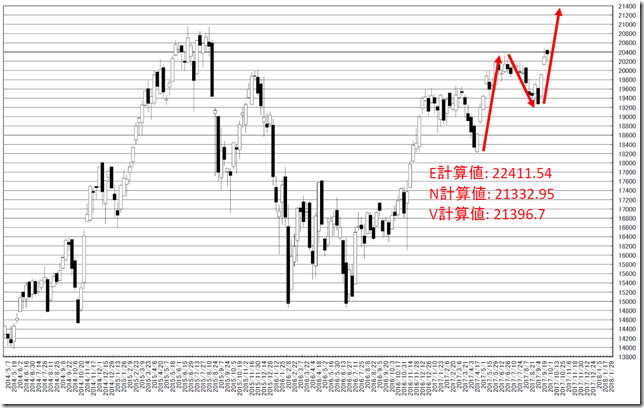
本日は波動計算をしました。
上方向は21300円がみえています。
一方、新高値をとれないでいるため、このまま下落に転ずると9000円程度を目指すとみています。
Today, we calculate wave.
The target is 21300yen around.
And if major peak has already taken, 9000yen around will be falling target.
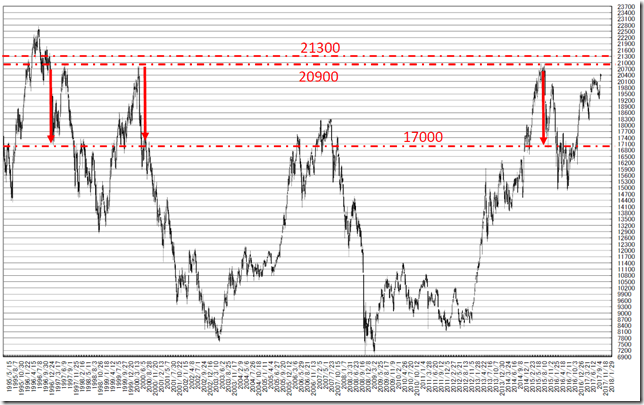
21300円というのは、1996年高値を超えられない値です。
20900円にもバリアがあり、超えていくのか興味が持てるところです。
一方、17000円程度にもサポートがあるとみています。
落ちるときはストンと行った点を覚えておきたいと思います。
21300yen cannot cut the highest in 1996.
20900yen also worked as resistance and this is notable matter.
On the other hand, 17000yen around worked as support.
We need to remind “Falling was very sharp”!
相場分析のリクエストがありましたら“Contact Us”からお知らせください。ご要望にお応えできるように努力いたします。
このブログはあくまでも個人的な見解であり、投資判断は各自でお願い致します。当ブログは一切の投資損益に対する責任を負いません。
ホームページに来て下さってありがとうございます。明日もよろしくお願いいたします。
If you have some request to analyze, please write to “Contact Us”.
We do best effort for your request.
These are only personal opinions on this blog, and you need the investment judgment in each one. This blog doesn’t assume the responsibility to all the investment profit and loss.
Thank for watching our contents. My best regards next day.
如果您需要行情分析,请点击“Contact Us”联系我们。我们将尽力满足您的要求。
本博客仅为个人意见,请各自做出投资判断。本博客概不对任何投资盈亏负责。
感谢您访问本博客。欢迎再次使用。


