2018/01

ドル円1時間足・再び109.40円、108.60円がレジスタンスとなるなら、更に下値を狙えそう

2018/01/29

ドル円1時間足・再び109.40円、108.60円がレジスタンスとなるなら、更に下値を狙えそう

USDJPY hourly; if 109.40yen and 108.60yen will work as resistance again, the price will get lower.

美元/日元。如果109.40日元和108.60日元会再次阻力工作,就价格会得到更低。


人は人。目移りせずに相場をおいかける。

We only pursuit our market.


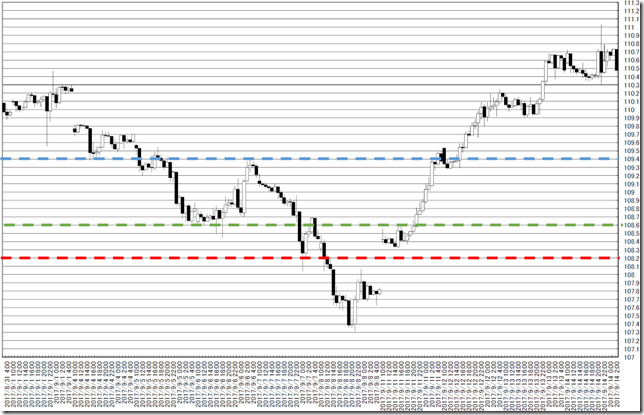
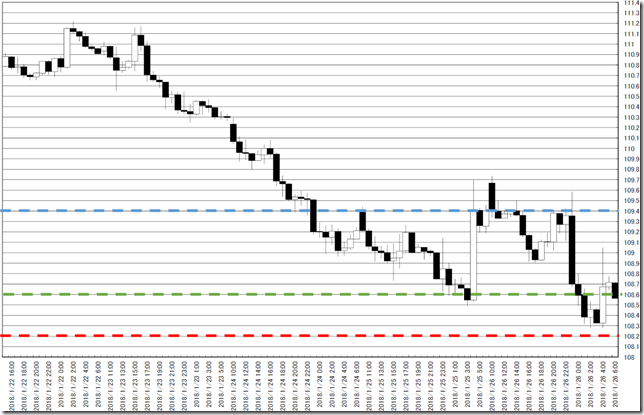
今週の方針は、売り先行だが一旦の戻しがあってもいいところ、109.40円、108.60円がレジスタンスになるところからの売り。

The principal in this week is the price may recover and we need to confirm 108.60yen or 109.40yen will work as resistance and selling will be best deal.


「ドル円1時間足・110円を割り込むとBig Dealかも」(2018/1/22)

Big Dealでした。

We reported “USDJPY hourly; If the price will cut 110yen even, this occasion may be a big deal?” in 1/22/2018.

It was great big deal!


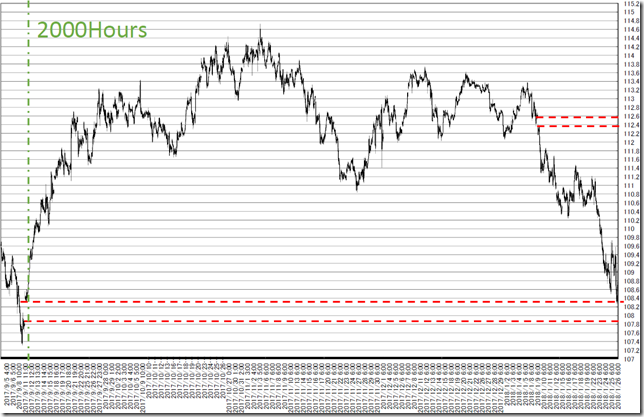
1時間足を使用しオセアニア時間帯を省いています。

「2000時間ルール」から「3000時間ルール」に変更したくなっています。(2018/1/2参照)

窓が大きな意味を持っています。

最終的に窓が埋まるにせよ、窓がレジスタンスとして機能したため、一旦の下げ止まりの可能性もあります。

また、上の窓もあることも忘れたくありません。

We used hourly data and the Oceania time zone market price is pulled out.

We want to change our rule from “2000hours” to “3000hours”. (See 1/2/2018 report)

The gap is meaningful.

This gap will bury and the gap worked as support; the price may stop falling.

And we need to remind there remained the upper side gap.

chart1_conv


1時間足を使用しオセアニア時間帯を省いています。

値段の節となりそうな、108.20円、108.60円、109.40円に線を引いています。

昨年9月も今回も同じようなところに位置していることがわかります。

もう一段下げるなら、こうした地点がしっかりとレジスタンスとして機能する点を確認する必要があります。

This is 0.1 price change and 3 box reversal close price’s Point and Figure chart.

Notable resistance and support points will be 108.20yen, 108.60yen and 109.40yen.

We can know 09/2017 case and the latest case are similar.

If the price will fall more, we need to confirm these points will work as resistance.

chart2_convchart3_conv


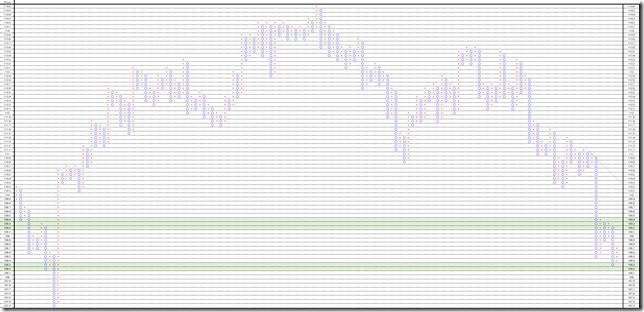
1時間足を使用しオセアニア時間帯を省いています。

一旦止まった地点からなので、戻りがあってもおかしくありません。

下げるところの大きいのだけを狙うなら、窓が埋まってから考えるのが一番かもしれません。

This is 0.1 price change and 3 box reversal close price’s Point and Figure chart.

The price stopped falling once this zone and may recover.

If we only aim the big falling opportunity, we will only wait for buried up the gap after.

pf_conv


相場分析のリクエストがありましたら“Contact Us”からお知らせください。ご要望にお応えできるように努力いたします。

このブログはあくまでも個人的な見解であり、投資判断は各自でお願い致します。当ブログは一切の投資損益に対する責任を負いません。

ホームページに来て下さってありがとうございます。明日もよろしくお願いいたします。

If you have some request to analyze, please write to “Contact Us”.

We do best effort for your request.

These are only personal opinions on this blog, and you need the investment judgment in each one. This blog doesn’t assume the responsibility to all the investment profit and loss.

Thank for watching our contents. My best regards next day.

如果您需要行情分析,请点击“Contact Us”联系我们。我们将尽力满足您的要求。

本博客仅为个人意见,请各自做出投资判断。本博客概不对任何投资盈亏负责。

感谢您访问本博客。欢迎再次使用。


日経平均週足・連続羽黒15(11)号線・「陰の陰包み」・上げ止まりや天底付近を示唆・相場心理の変化か?

2018/01/28

日経平均週足・連続羽黒15(11)号線・「陰の陰包み」・上げ止まりや天底付近を示唆・相場心理の変化か?

NIKKEI 225 weekly is lining “HAGURO” No. 15(11) formation; All black and two bars engulfing; rally may stop or peaked out or bottom out.

日经225。羽黑15(11)号线连续。反弹可能停止或见顶或见底。


本日は日経225についてです。

結論は、大きな値動きは近い。

チャートがトレンド転換や想定外のことがありそうと囁いているみたいです。

Today is about N225 Weekly.

Our conclusion is a big price movement will come sooner.

Chart says a trend change or a big surprise will come sooner.


「今後の標語は「心に刻もう22976.17円」。相場見通しは22976.17円をスッパリ抜けるのかどうかの1点にかかっているとも言えます。」(2017/1/4)

We reported “We will need to remind 22976.17yen in future! Our view will be based on the price will cut 22976.17yen or not” in 1/4/2017.


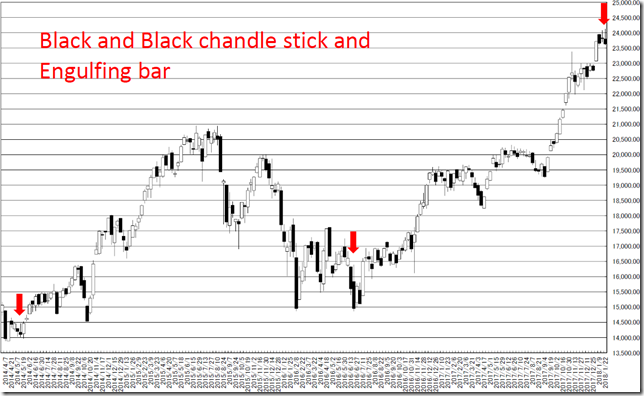
日経225週足線は羽黒15(11)号線となりました。

日経225週足線では400週で羽黒15(11)号線は16回出現しています。

再び羽黒足の肝です。

方向はともかく、大きな値動きに備える必要があるとみています。

In this week, N225 formed “HAGURO” No. 15(11) formation.

In past 400 weeks, N225 price formed “HAGURO” No. 15(11) formation was 16 time.

This week is also the most important signal of “HAGURO” method.

This often became the signal of big price movement.


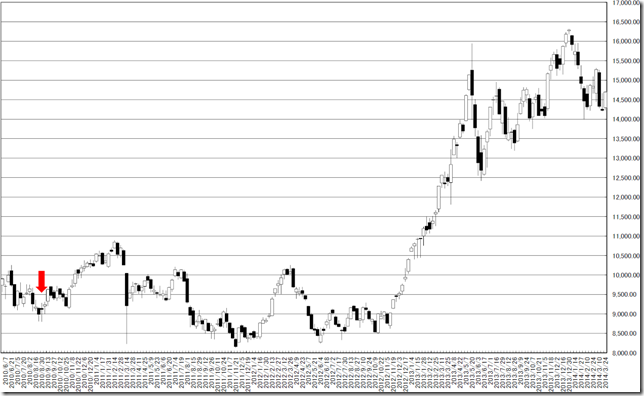
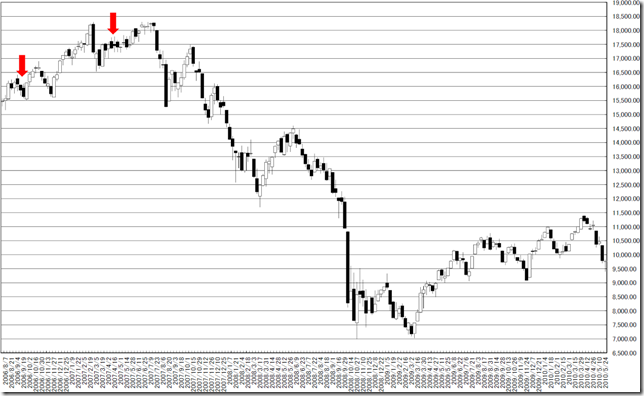
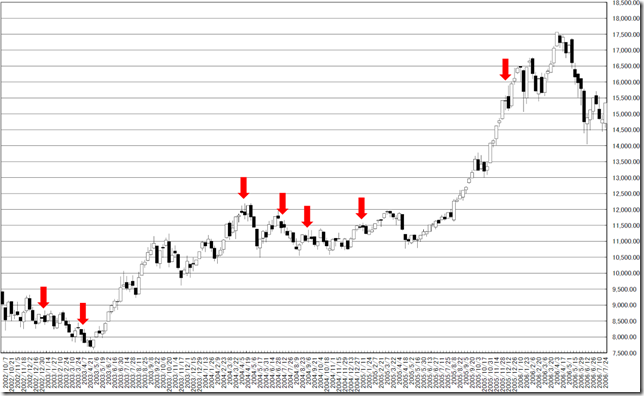
もっと興味深いのは「陰の陰包み」です。

しかも、2手包みは大変に珍しい線です。

上げてきた相場では、しばらくの間の上げ止まりを示唆していました。

しかし、下げ止まりであった点も見逃せません。

2007年の相場では、天井付近で示現点も思い出されます。

また、2004-2005年の相場では、しばらく上値が重くなりました。

決め打ちせず柔軟にいきたいと思います。

The most notable point is All black and two bars engulfing.

This is rare occasion.

In rally market, this formation implies the end of jumping.

In 2007 market, this formation appeared at peak around.

And in 2004-2005 case, this formation implied steadiness.

But we can know this formation was also falling stop signal.

We should not determine the trend direction and only follow!

chart1_convchart2_convchart3_convchart4_conv


相場分析のリクエストがありましたら“Contact Us”からお知らせください。ご要望にお応えできるように努力いたします。

このブログはあくまでも個人的な見解であり、投資判断は各自でお願い致します。当ブログは一切の投資損益に対する責任を負いません。

ホームページに来て下さってありがとうございます。明日もよろしくお願いいたします。

If you have some request to analyze, please write to “Contact Us”.

We do best effort for your request.

These are only personal opinions on this blog, and you need the investment judgment in each one. This blog doesn’t assume the responsibility to all the investment profit and loss.

Thank for watching our contents. My best regards next day.

如果您需要行情分析,请点击“Contact Us”联系我们。我们将尽力满足您的要求。

本博客仅为个人意见,请各自做出投资判断。本博客概不对任何投资盈亏负责。

感谢您访问本博客。欢迎再次使用。

© 2024 Retar