日経平均週足・ろうそく足考察・2008年の相場と比較すると先週の窓は嫌な窓です/ NIKKEI 225 week; Analyzing of the candle stick; Comparing to the 2008’s market, last week gap is bad feeling. /日经225。蜡烛图验证。相比2008年的市场,上周缺口不好的感觉。
日経平均週足・ろうそく足考察・2008年の相場と比較すると先週の窓は嫌な窓です
NIKKEI 225 week; Analyzing of the candle stick; Comparing to the 2008’s market, last week gap is bad feeling.
日经225。蜡烛图验证。相比2008年的市场,上周缺口不好的感觉。
本日は日経225週足についてです。
本日はトレンドラインと窓の考察をおこないました。
結論は、なお下値不安が広がっています。
Today is about N225 weekly.
Today, we analyze trend line and candle stick gaps.
Our conclusion is still bearish.
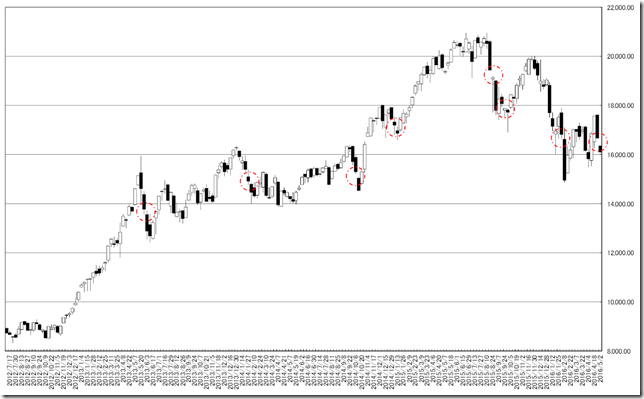
先週は大きな窓をあけて下落しています。
過去の下げてきた部分のヒゲの重なりと窓の部分に赤丸をいれてみると、実体抜きを伴った上げがなければ、上値を追う相場となっていないことがわかります。
つまり、16652.74円から16357.1円の間、ろうそく足の実体を伴った上昇にならなければ反転の確認とならないとみています。
Last week, the market price took a big gap and fall.
Marking at gaps and “Only shadow parts”, a recovery with candle stick body often became the signal of the trend reversal.
In this case, from 16652.74yen to 16357.1yen is the resistance point and need to bury.
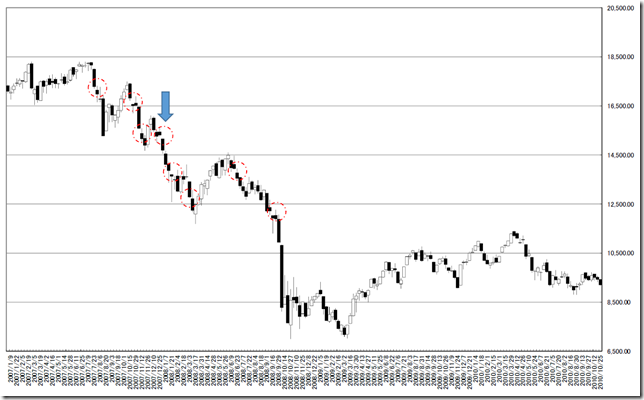
比較のために2008年の相場です。
大きな下落相場でも、比較的早い段階の埋めが入っていますが、矢印の地点のようなことがあました。
2番底からつけた窓であり、今回と性質はよく似ています。
この窓はアベノミクスまで埋めることのなかった窓でした。
This is 2008’s chart for comparing.
After a big fall, the price was buried sooner but the arrow point was unique point.
This occasion occurred after the secondary bottom and this character is similar to now.
And the gap buried after Abenomics started.
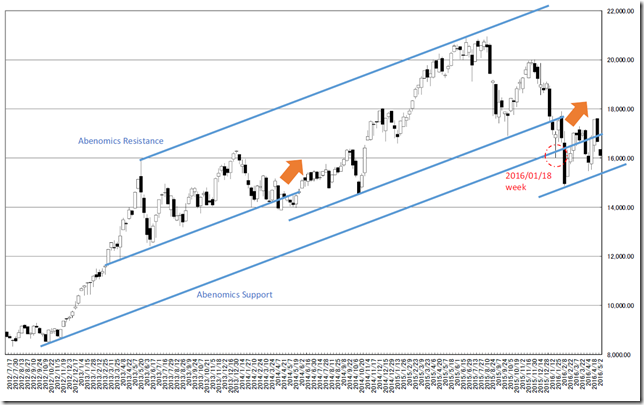
サポート側のトレンドラインです。
2012年末からの上げ相場は、結局チャネリング相場でした。
名付けて「アベノミクス上限」と「アベノミクス下限」というのがあり、下限を割り込んだため、アゲアゲムードはオワリました。
切れるのは良いのですが、オレンジのあたりからの戻りがなかったため、弱気の印になります。
トレンドライン割れが、最初に確認が取れたのは2016/01/18の週。
ここからは売りを考える基点となっており弱気となります。
現在のトレンドラインは15000円ミドルに位置するため、まずはここまでの下落を想定したいと思います。
This is support lines chart.
After all, this market was channeling after 2012.
We can know “Abenomics resistance” and “Abenomics support” and the price cut the support and the trend was ended.
Cutting was occurred in the past case such as orange arrow but the price was not recovered and this is the signal of bearish.
The first time of the cutting point was 01/18/2016 week.
After that we need to become bearish.
The latest most outer support exists at 15000yen middle and we can know the price will reach it.
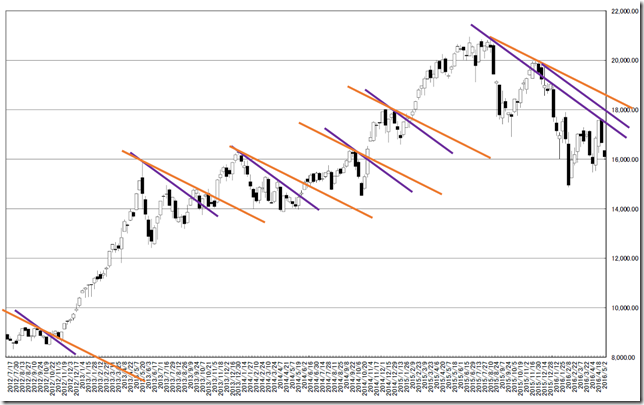
レジスタンス側のトレンドラインです。
上昇に転じるなら、オレンジや紫を超えてから考えます。
一番下でも、トレンドラインの位置するのは17000円ミドルぐらいでしょう。
遠いため下値が軽いと見るのがファーストシナリオとなります。
This is resistance lines chart.
If the market will be bullish, the market price will cut orange or purple lines.
The closest one is 17000yen middle around.
This is far and bearish is our main scenario.
相場分析のリクエストがありましたら“Contact Us”からお知らせください。ご要望にお応えできるように努力いたします。
このブログはあくまでも個人的な見解であり、投資判断は各自でお願い致します。当ブログは一切の投資損益に対する責任を負いません。
ホームページに来て下さってありがとうございます。明日もよろしくお願いいたします。
If you have some request to analyze, please write to “Contact Us”.
We do best effort for your request.
These are only personal opinions on this blog, and you need the investment judgment in each one. This blog doesn’t assume the responsibility to all the investment profit and loss.
Thank for watching our contents. My best regards next day.
如果您需要行情分析,请点击“Contact Us”联系我们。我们将尽力满足您的要求。
本博客仅为个人意见,请各自做出投资判断。本博客概不对任何投资盈亏负责。
感谢您访问本博客。欢迎再次使用。


