TOPIXのオープニングギャップとボラタリティの関係/TOPIX Opening Gap and Volatility
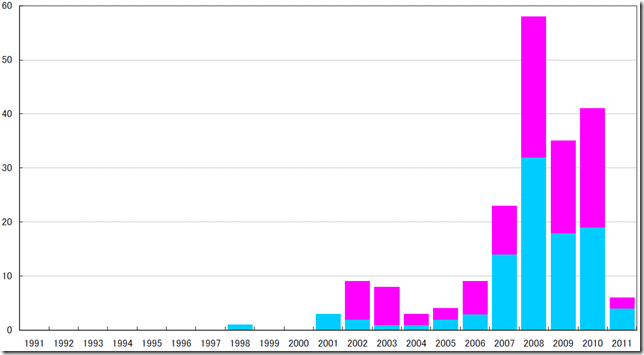
本日は1991/01/04から2011/03/15までのTOPIXのオープニングギャップを計算しました。
上昇率上位100位と下降率100位を作成しています。
オープニングギャップとは、前日のクローズと当日のオープンの値段の変化です。
オープニングギャップが大きいということは、クローズ中にマーケット状況の変化が大きいとも言えます。近年のマーケットボラタリティの高さがわかります。
Today, we calculate TOPIX opening gap from 01/04/1991 to 03/15/2011.
We calculate ascending top 100 percentages and descending top 100 percentages.
Opening gap is the difference last day close price and today’s open price.
It is said that the big opening gap often occur is the market volatility big.
We can see recent big market volatility.
表は縦軸を発生回数、横軸を年としています。
ピンクは上昇。水色は下降です
The spindle axis is generation frequency.
The horizontal axis is year.
Pink is upside frequency.
Blue is downside frequency.
相場分析のリクエストがありましたら“Contact Us”からお知らせください。ご要望にお応えできるように努力いたします。
このブログはあくまでも個人的な見解であり、投資判断は各自でお願い致します。当ブログは一切の投資損益に対する責任を負いません。
ホームページに来て下さってありがとうございます。明日もよろしくお願いいたします。
If you have some request to analyze, please write to “Contact Us”.
We do best effort for your request.
These are only personal opinions on this blog, and you need the investment judgment in each one. This blog doesn’t assume the responsibility to all the investment profit and loss.
Thank for watching our contents. My best regards next day.


