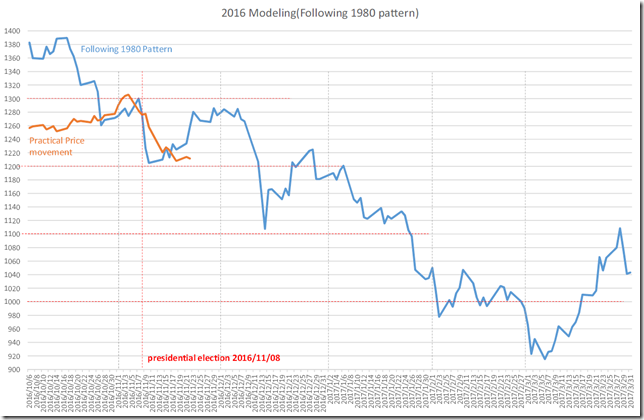
NY金日足・1980年代に倣うと、毎月100ポイントずつ下げるイメージ?/NY GOLD Daily; following 1980’s movement, the range will go lower 100 point in every month? /纽约黄金。因为类似1980年代的,就每月将100点下落。
NY金日足・1980年代に倣うと、毎月100ポイントずつ下げるイメージ?
NY GOLD Daily; following 1980’s movement, the range will go lower 100 point in every month?
纽约黄金。因为类似1980年代的,就每月将100点下落。
結論は1200ポイントを保つことができなければ、長期見通しの大幅変更発生。
翌月もズリズリ落ちていくようであれば、来月には見通し変更が発生します。
Our conclusion is if NY gold price cannot keep 1200 point over, we need to rebuild our long term view.
If the price will fall more and more, we need to change our view in next month.
2016/11/18のレポートでは「示唆に富む1980年の大統領選・値動きを比較」について報告しています。
現在の相場は1980年の相場と似ていると、たくさんの報告があるので、比較しました。
この中で金は最も弱気なアセットであることがわかりました。
しかしながらRetar.jpの長期的な金の見通しは強気です。
チャート分析で大切なことは、「なにがどうなったら、どうする」を決めておくことです。変化すれば、考え方をゼロベースで組み立てる必要がある段階に至ります。
We reported “Presidential Election in 1980 implies many things; Comparing” in 11/18/2016.
The latest market is similar to 1980’s market and we compared.
And we can know NY Gold was the most bearish market.
But our long term view is bullish.
Analyzing technical chart, we need to define “What will it occur and what will do”.
Changing this condition, we need to rebuild our view with zero-base thinking.
見通しの変更が必要なのは、以下です。
「NY金月足P&F・既に上放れしているなら、ターゲットは2650-2700ポイント」(2016/03/31)
「NY Gold超長期・「右手にマツタケ、左手に延べ棒」・秋は金買い場か?」(2016/5/19)
We need to change under these.
“NY Gold Long term; autumn will be a good opportunity to buy” (See 05/19/2016)
本日は、大統領選(2016/11/08)を基点として1980年値動きを追随したチャートを書いてみました。
大よそのイメージとしては、毎月100ポイントずつ下げていくイメージです。
● 2016/11は1300ポイントから1200ポイントのレンジ。
● 2016/12は1200ポイントから1100ポイントのレンジ。
● 2017/01は1100ポイントから1000ポイントのレンジ。
● 2017/02は1050ポイントから950ポイントのレンジ。
● 2017/03は1000ポイントから900ポイントのレンジ。
注目の地点に差し掛かっています。
The price may follow 1980’s price movement.
So, we treat the price in 11/08/2016 as 100% and draw chart.
Most rough image is the range will go lower 100 point in every month.
- From 1300 point to 1200 point in 11/2016
- From 1200 point to 1100 point in 12/2016
- From 1100 point to 1000 point in 1/2017
- From 1050 point to 950 point in 2/2017
- From 1000 point to 900 point in 3/2017
Now is notable support point.
相場分析のリクエストがありましたら“Contact Us”からお知らせください。ご要望にお応えできるように努力いたします。
このブログはあくまでも個人的な見解であり、投資判断は各自でお願い致します。当ブログは一切の投資損益に対する責任を負いません。
ホームページに来て下さってありがとうございます。明日もよろしくお願いいたします。
If you have some request to analyze, please write to “Contact Us”.
We do best effort for your request.
These are only personal opinions on this blog, and you need the investment judgment in each one. This blog doesn’t assume the responsibility to all the investment profit and loss.
Thank for watching our contents. My best regards next day.
如果您需要行情分析,请点击“Contact Us”联系我们。我们将尽力满足您的要求。
本博客仅为个人意见,请各自做出投资判断。本博客概不对任何投资盈亏负责。
感谢您访问本博客。欢迎再次使用。

