日経平均年足の分析(5)・重要標語は「改めて心に刻もう19592.9円と19114.37円」・弱気になるなぁ/NIKKEI 225 annual No.5; Let’s remind many times in this year, “We will remember 19592.9yen and 19114.37yen over again”; we cannot easily become bullish. /日经225。年K的分析(5)。19592.9日元和19114.37日元将抵抗和支持。熊市。
日経平均年足の分析(5)・重要標語は「改めて心に刻もう19592.9円と19114.37円」・弱気になるなぁ
NIKKEI 225 annual No.5; Let’s remind many times in this year, “We will remember 19592.9yen and 19114.37yen over again”; we cannot easily become bullish.
日经225。年K的分析(5)。19592.9日元和19114.37日元将抵抗和支持。熊市。
本日は日経平均年足についてです。
結論は「強気になれないかも、下値不安の方が大きい」。
Today is about N225 yearly.
Our conclusion is “we cannot be bullish and the possibly of taking new low will be higher”.
言いっぱなしというのは、よくありません。
分析の反省会です。
「日経平均年足の分析(1)・5年連続陽線は1982年以来・違いは新高値をとらなかったこと」(2017/1/1)
「日経平均年足の分析(2)・2017年末引け値20000円超っていうのは、かなりハードルが高い」(2017/1/2)
「日経平均年足の分析(3)・日経新聞2016年、2017年元日「株価・経営者が占う」からモデリングすると彼らは既に高値警戒感」(2017/1/3)
「日経平均年足の分析(4)・今年の重要標語は「心に刻もう19592.9円と19114.37円」・年前半は堅調かも」(2017/1/4)
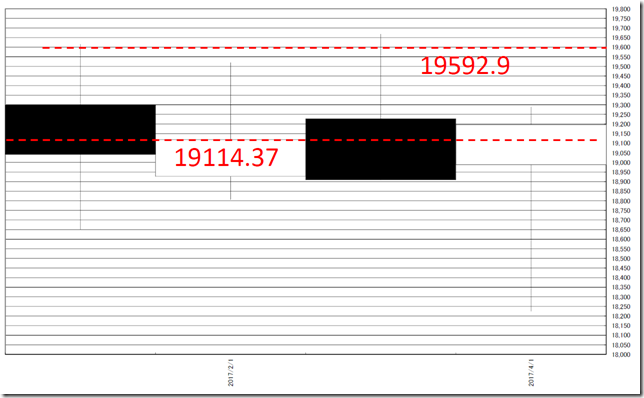
胆は19592.9円と19114.37円でした。
今後とも心に刻みたいと思います。
Analysis needs reviewing and we need!
Reviewing our report.
We reported “NIKKEI 225 annual No.2; 20000yen over in 2017 close price will be difficult” in 1/2/2017.
The notable point was 19592.9yen and 19114.37yen.
We will never mind!
さて、4月までの月足が決まりましたが、特徴がある足をつけました。
特徴となるのは、1.鯨幕、2.3月4月で包んだという点です。
Now, the candle stick formation was determined from January to April and this year’s formation was very unique.
The notable points are two; one is Black and White combination and the other is Engulfing bar (March and April).
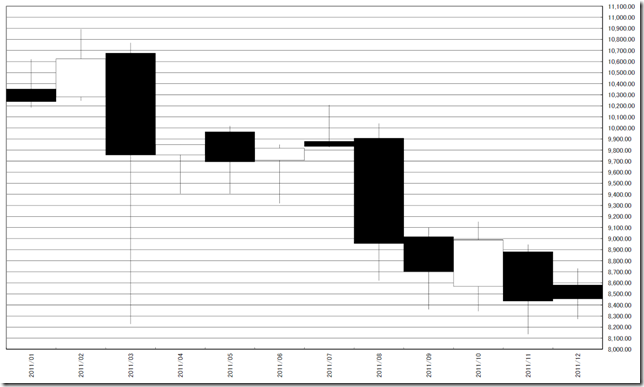
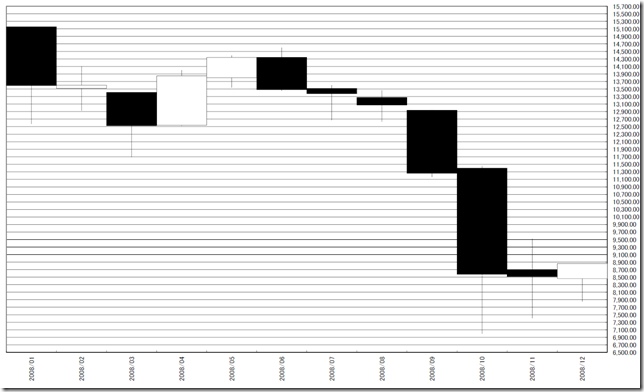
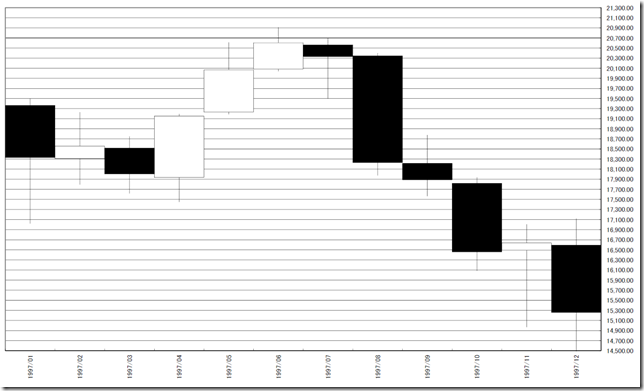
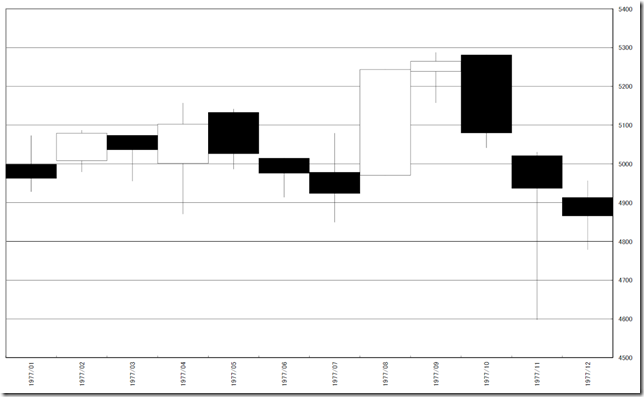
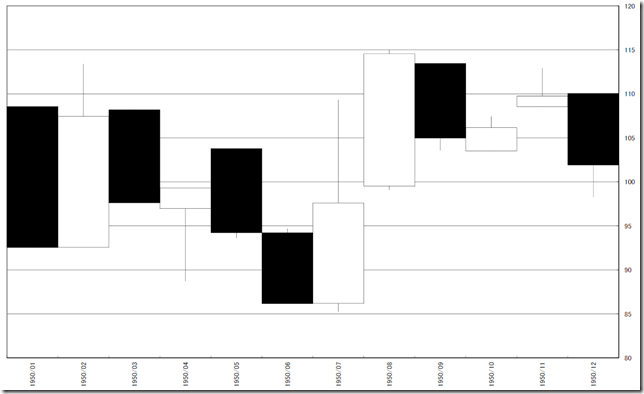
1950年以降、1-4月の鯨幕相場のパターン(黒白黒白)は、2011年、2008年、1997年、1977年、1950年のパターンがありました。
共通した特徴は、新安値が発生している点です。
After 1950, “Black and White lining from January to April” (Black-White-Black-White) are 2011, 2008, 1997, 1977 and 1950.
Common point is market took new low.
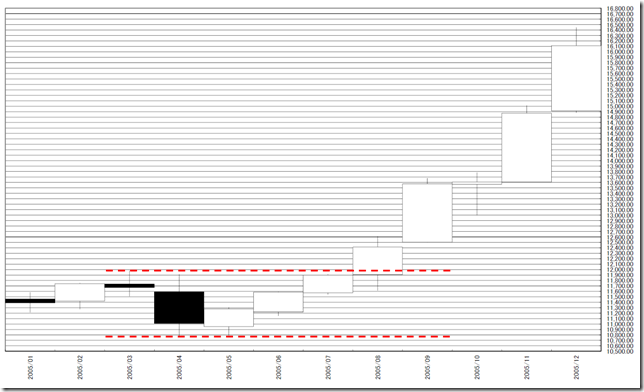
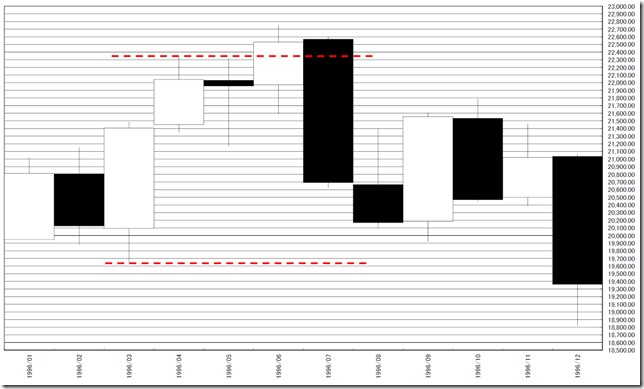
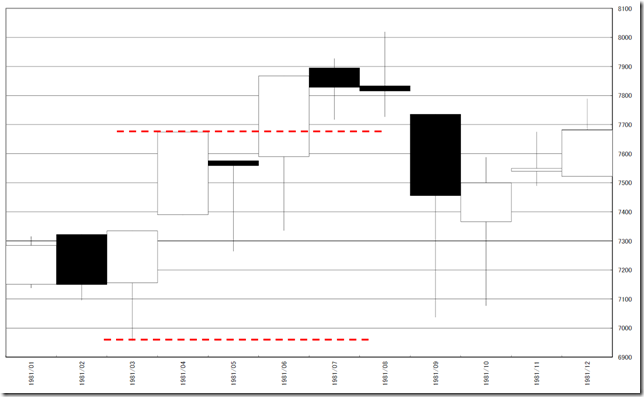
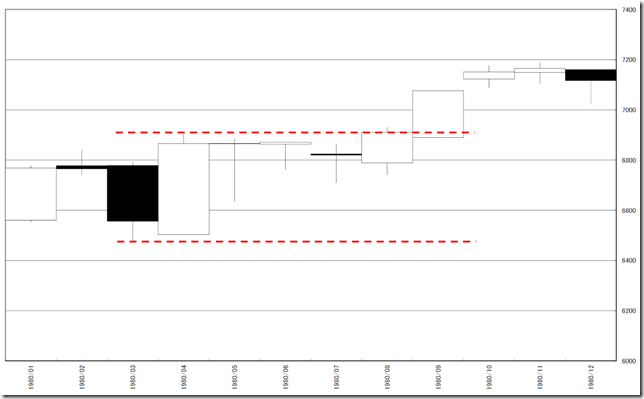
もう一点の特徴の3、4月の包み線のパターンは2005年、1996年、1981年、1980年です。
包みなので、実体抜けには期待が持てますが、6月から抜ける1996年、1981年パターンと8月から抜ける2005年、1980年パターンがあります。
8月から抜けると堅調、6月から抜けると拡大波動チックな動きです。
しかし、新高値は心に刻んだまさに、あの値段(19592.9円)です。
強気になかなかなれません。
The other character is Engulfing bar (March and April) and they are 2005, 1996, 1981 and 1980.
Cutting with candle stick body often becomes trend.
And in past cases, there were two types; cutting in June (1996 and 1981) and cutting in August (2005 and 1980).
Cutting in August became bullish trend and cutting in June became “Y” wave.
But we need to remind new high means cutting that remarkable price! (19592.9yen)
We cannot easily become bullish!
相場分析のリクエストがありましたら“Contact Us”からお知らせください。ご要望にお応えできるように努力いたします。
このブログはあくまでも個人的な見解であり、投資判断は各自でお願い致します。当ブログは一切の投資損益に対する責任を負いません。
ホームページに来て下さってありがとうございます。明日もよろしくお願いいたします。
If you have some request to analyze, please write to “Contact Us”.
We do best effort for your request.
These are only personal opinions on this blog, and you need the investment judgment in each one. This blog doesn’t assume the responsibility to all the investment profit and loss.
Thank for watching our contents. My best regards next day.
如果您需要行情分析,请点击“Contact Us”联系我们。我们将尽力满足您的要求。
本博客仅为个人意见,请各自做出投资判断。本博客概不对任何投资盈亏负责。
感谢您访问本博客。欢迎再次使用。

