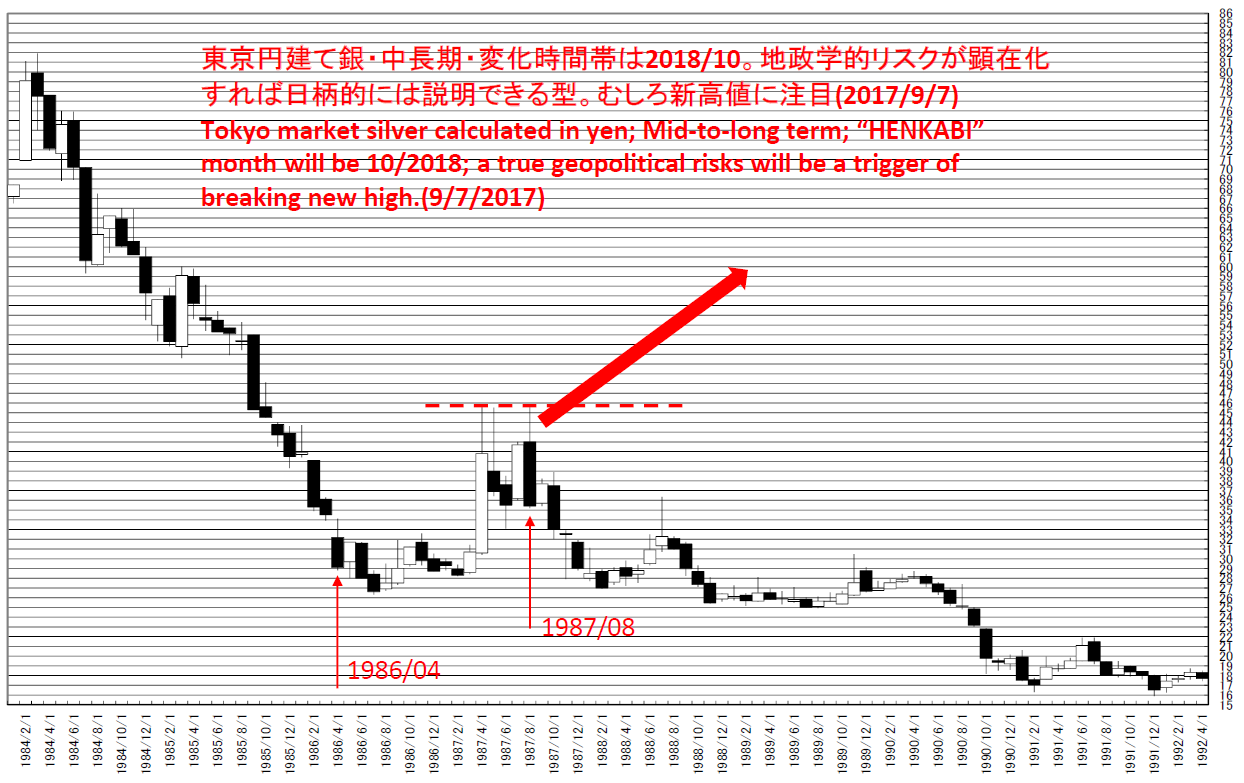
東京円建て銀・中長期・1980年代の日柄と最近の日柄は似ている・2018/10は分水嶺/Tokyo market silver calculated in yen; Mid-to-long term; there are some similarity between latest “HIGARA” and 1980’s; 10/2018 will be watershed. /东京市场的白銀。中期和长期的分析。现在的“日柄”是类似于1980年的“日柄”。2018年10月是趋势的分水岭。
東京円建て銀・中長期・1980年代の日柄と最近の日柄は似ている・2018/10は分水嶺
Tokyo market silver calculated in yen; Mid-to-long term; there are some similarity between latest “HIGARA” and 1980’s; 10/2018 will be watershed.
东京市场的白銀。中期和长期的分析。现在的“日柄”是类似于1980年的“日柄”。2018年10月是趋势的分水岭。
本日は東京マーケット円建て銀についてです。
結論は1980年代の日柄と最近の日柄は似ている。2018/10は分水嶺となりそう。
しかし、今回の場合は分水嶺から上げそうでは??とみています。
Today’s analyze is about Tokyo market silver calculated in yen.
Our conclusion is there are some similarity between latest “HIGARA” and 1980’s; 10/2018 will be watershed.
But in the latest occasion, this market will start rally from the watershed around.
東京マーケット円建て銀は基本的にボトムアウトしているとみています。(2016/07/19レポート参照)
また、「東京円建て銀月足・日柄的には2016年10月に注目」(2016/9/16レポート参照)のとおり、安値をとったため、上方向への変化の可能性を秘めています。
Our basically view is this market have already taken the major bottom. (See 07/19/2016 report)
And we reported “Tokyo market silver calculated in yen; 10/2016 will be notable from “HIGARA” view” in 9/16/2016 and the price took the lowest and may have already launched.
2017/9/7に「「東京円建て銀・中長期・2017/6上旬の変化時間帯に注目」(2017/4/26)。翌月反転していますが、これは最高値からの76手。」と報告しています。
最高値からの76手での参考になるのは、1980年代の値動きです。
In 9/7/2017, we reported “Tokyo market silver calculated in yen; Mid-to-long term; “HENKABI” zone will be early June in 4/26/2017. The price reversed in next month and this is 76 months form the highest”.
We can refer 1980’s price movement.
東京先物市場の値段がないため、NY先物の値をもとに勘定すると、最高値は1980/01につけています。
1980/01からの76ヶ月は1986/04。
しかし、1986/04は大底ではなく、76ヶ月を過ぎて、安値をとりにきています。
We have no data about TOKYO future market and we use NY future market data.
The price took the highest in 01/1980 and 76 months from it is 04/1986.
But 04/1986 was not major peak and the lowest was after that.
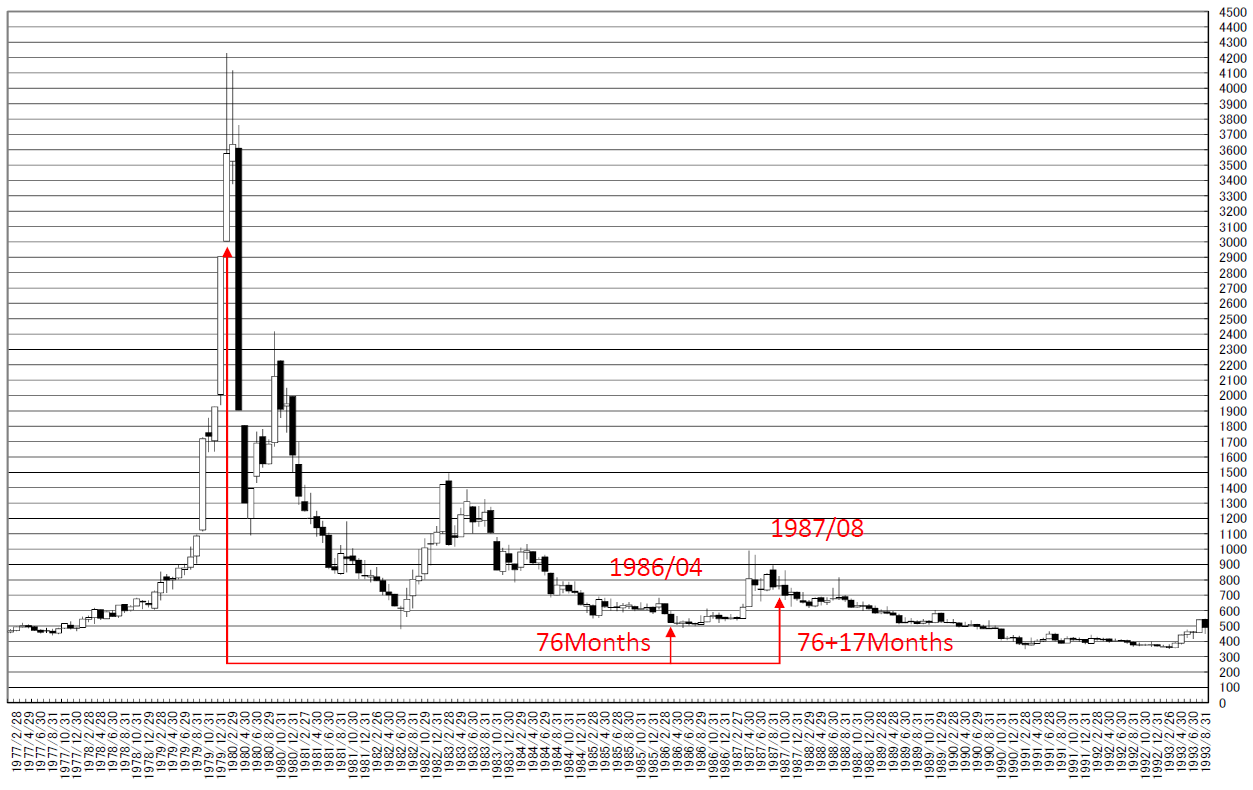
76手を過ぎて安値をつけるか、76手で安値をつけるかは意味が異なります。
東京市場の値をみても、1986/04の後に安値をつけています。
これがその後の再下落を暗示していました。
現在マーケットの初動は、1980年代とは違うとみえます。
また、76+17ヶ月にあたる1987/08はピークアウトした地点となりました。
Taking the lowest “After 76 business months” and “At proper 76 business months” are different meaning.
In Tokyo market, the lowest was “After 76 business months”.
This price movement implied “Re-falling”.
The first price movement of this market is different from 1980’s.
And 76+17 business months was peaked out point.
相場分析のリクエストがありましたら“Contact Us”からお知らせください。ご要望にお応えできるように努力いたします。
このブログはあくまでも個人的な見解であり、投資判断は各自でお願い致します。当ブログは一切の投資損益に対する責任を負いません。
ホームページに来て下さってありがとうございます。明日もよろしくお願いいたします。
If you have some request to analyze, please write to “Contact Us”.
We do best effort for your request.
These are only personal opinions on this blog, and you need the investment judgment in each one. This blog doesn’t assume the responsibility to all the investment profit and loss.
Thank for watching our contents. My best regards next day.
如果您需要行情分析,请点击“Contact Us”联系我们。我们将尽力满足您的要求。
本博客仅为个人意见,请各自做出投资判断。本博客概不对任何投资盈亏负责。
感谢您访问本博客。欢迎再次使用。