TOPIX日足P&F・天井となっても納得・新高値をとり2006年に倣うなら2080ポイントターゲット
TOPIX日足P&F・天井となっても納得・新高値をとり2006年に倣うなら2080ポイントターゲット
TOPIX (Tokyo stock Price Index) Daily P&F; this market may be peaked out; taking new high, the target is 2080point.
东证综合指数。P&F分析。这个市场可能会达到顶峰。如果现在的价和2006年的价格一样的话, 就目标是2080点。
本日はTOPIX日足を分析します。
様々な手法を駆使して重層的に値動きを追い詰めていくのがテクニカル分析の醍醐味です。
重層的な値動きの追究の後に見えるのは、相場の尻尾。
Today we analyze TOPIX daily.
We use many kind of method to grasp the price of the future price.
After that, we can conclude the confidence.
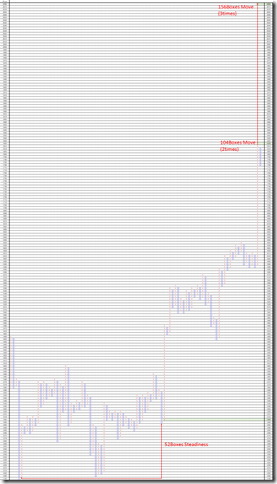
25 point、3枠転換の終値ポイントアンドフィギュアです。
2007年高値とダブルトップとなりました。
5point 枠でも、ダブルトップとなるためレジスタンス臭い地点です。
新高値をとらなければ、オワッタ相場です。
This is 25 point change and 3 box reversal close price’s Point and Figure chart.
The price took double top at 2007 high.
Using 5 point change, the conclusion is same and this point seems to be real resistance.
If the price will not take new high, this market will be peaked out.
5 point、3枠転換の終値ポイントアンドフィギュアです。
はじめに注目していただきたいのは、2011/2/20の分析「TOPIX日足・2003-2006年と水平分析比較」です。
TOPIXには、底値の持ち合いからの3倍返しで大天井を打った歴史があります。
最近の昇竜拳チャートも何となく雰囲気が似ており、3倍返しならば、ターゲット2080ポイントになります。
日経平均に引き直すと2017/11/8のNT倍率は12.6倍(22,913.82/1,817.6)として、2080*12.6=26208円となります。
「日経平均波動計算・1989年バブルをなぞるなら、大天井は27000円以下??」(2017/11/11)の分析とも符合します。
日柄としても、2626営業日(226*11 + 150)となっており、1手少ないところから下げてきたので反転は反転なのでしょう。
This is 5 point change and 3 box reversal close price’s Point and Figure chart.
Please see our report “TOPIX (Tokyo stock Price Index) Daily. Comparing from 2003 to 2006 year and recent by horizontal method” in 2/20/2011.
We can see this market was perfectly peaked out in 3 times move.
The latest market is similar to it and if it will come true, the target will be 2080 point.
When it will come true, N225 will be 2080*12.6=26208yen around because NT magnification in 11/8/2017 was 12.6 times (22,913.82/1,817.6).
This conclusion fit our report, “NIKKEI 225 wave calculation; following the price movement in 1989, major peak will be lower than 27000yen” (See 11/11/2017).
It took 2626business days (226*11 + 150) from peak to peak and this may be collection or reversal signs.
相場分析のリクエストがありましたら“Contact Us”からお知らせください。ご要望にお応えできるように努力いたします。
このブログはあくまでも個人的な見解であり、投資判断は各自でお願い致します。当ブログは一切の投資損益に対する責任を負いません。
ホームページに来て下さってありがとうございます。明日もよろしくお願いいたします。
If you have some request to analyze, please write to “Contact Us”.
We do best effort for your request.
These are only personal opinions on this blog, and you need the investment judgment in each one. This blog doesn’t assume the responsibility to all the investment profit and loss.
Thank for watching our contents. My best regards next day.
如果您需要行情分析,请点击“Contact Us”联系我们。我们将尽力满足您的要求。
本博客仅为个人意见,请各自做出投资判断。本博客概不对任何投资盈亏负责。
感谢您访问本博客。欢迎再次使用。


