日経平均週足・変化週は2017/11/27の週・強気維持だが、まさかなら魔坂?
日経平均週足・変化週は2017/11/27の週・強気維持だが、まさかなら魔坂?
NIKKEI 225 weekly; “HENKABI” week will be 11/27/2017 week; we are still bullish but we do not know.
日经225。变化日是2017年11月27号的周。我们看到仍然看涨,但我们不知道。
本日は日経225週足についてです。
結論は「変化週は2017/11/27の週」。
メインシナリオは押しの後、新高値が出るとみています。
Today is about N225 weekly.
Our conclusion is “HENKABI” week will be 11/27/2017 week.
Our main scenario is bullish; the price need collection and will take new high after that.
日柄のレポートは復習つきで解説していきます。
2017/7/11のレポートでは反転地点を捕らえていました。
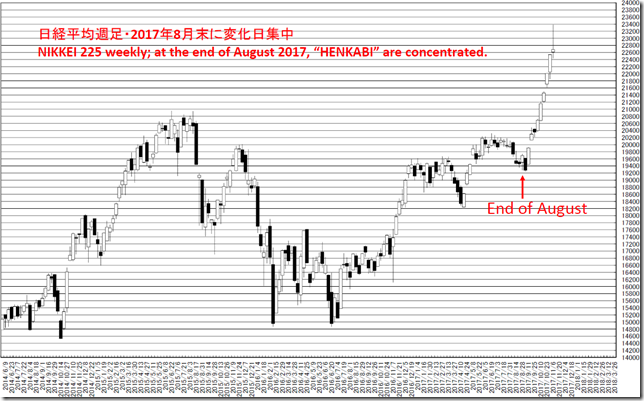
「メインシナリオは、7月末に離れがなければ退屈な相場が続き、8月末のフィーバーになる可能性あり。」とも書いており、本当のフィーバーになりました。
We review our past “HIGARA” report in any time.
We captured the reversal point in our 7/11/2017 report.
We also reported “Our main scenario is if the price will not launch at the end of July, boring market will continue and Fever will come at the end of August” in 7/11/2017” and this market became so.
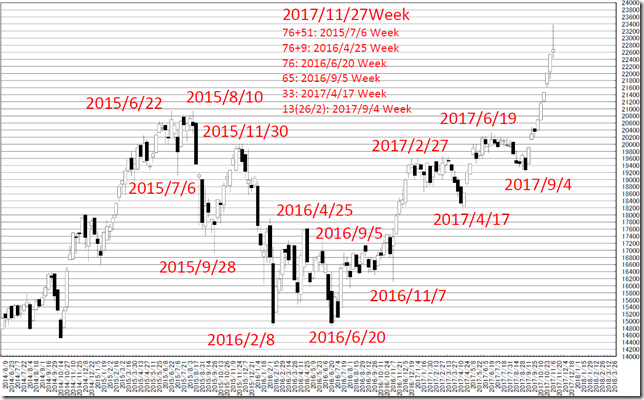
メジャーな頂点からの変化日の位置です。
2017/11/27の週に集中がみられます。
「日経平均週足・1989年バブルの日柄をなぞるなら2017年12月上旬~中旬、2018年4月上旬は要注意の変化時間帯」(2017/11/10)とも報告しており、別の分析とも符合します。
This is the “HENKABI” from the major peaks.
“HENKABI” is concentrated in 11/27/2017 week.
And we also reported “NIKKEI 225 weekly; following 1989 bubble “HIGARA”, from beginning to middle of 12/2017 and beginning of 4/2018 will be “HENKABI”” in 11/10/2017 and this analysis fits this view..
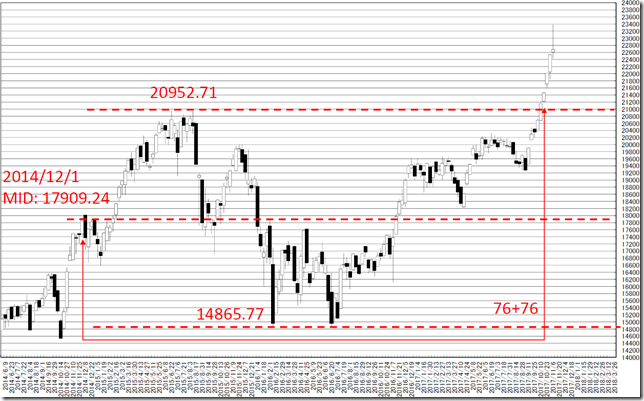
2014/12/1の週の基点の持ち合いです。
76+76手を前に新高値をとっているため強気示唆です。
普通にみてもダブルトップとダブルボトムをつけて鉄板天井、鉄板底をかためたあと、上抜けたので問答無用の強気入りです。
This is steadiness from 12/1/2014 week.
The price broke the range before 76+76 weeks and this is bull signal.
In generally, the price took double top and double bottom and took higher; this is proper bull market.
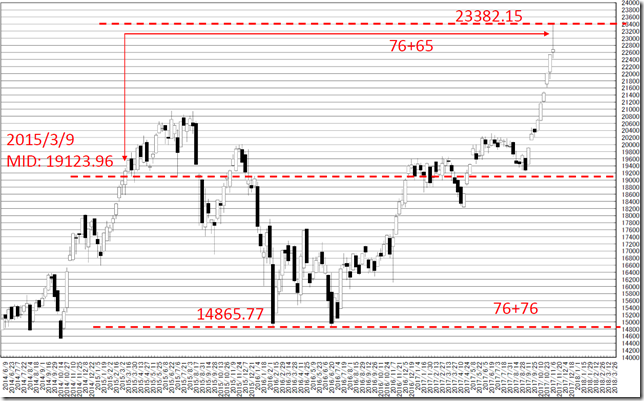
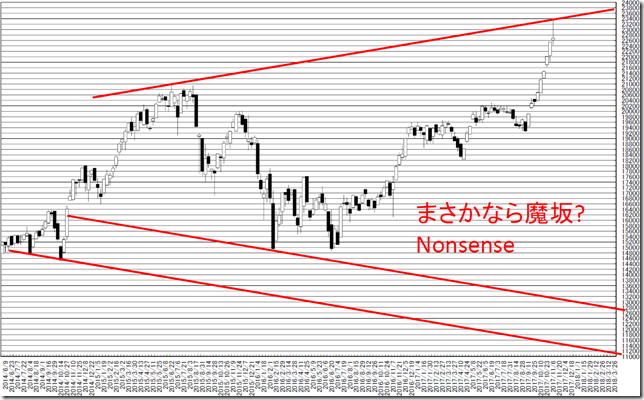
2015/3/9の週の基点の持ち合いです。
76+65手で頂点でした。
ここ以外は日柄が不自然なため、半値は別の場所にあるとみています。
ということは、考えられるシナリオは2つ。
1. 上方向にレンジ上限の親分がいる。
2. 拡大波動となり強烈なレンジの下限がある
普通の相場なら1ですが・・・
一応、戯言チャートも載せておきます。
This is steadiness from 3/9/2015 week.
The price took the highest in 76+65 weeks.
But there are no other point fitting proper “HIGARA”.
And proper “Half price” exists at other point.
So we can imagine two scenario.
1. The proper half price exists higher.
2. The proper half price exists lower; “Y” wave but this will be nonsense.
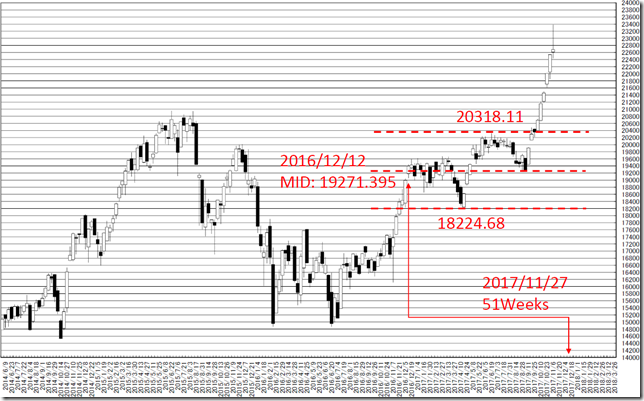
2016/12/12の週の基点の持ち合いです。
離れて51手は、2017/11/27の週です。
This is steadiness from 12/12/2016 week.
The price took high in 51 weeks.
相場分析のリクエストがありましたら“Contact Us”からお知らせください。ご要望にお応えできるように努力いたします。
このブログはあくまでも個人的な見解であり、投資判断は各自でお願い致します。当ブログは一切の投資損益に対する責任を負いません。
ホームページに来て下さってありがとうございます。明日もよろしくお願いいたします。
If you have some request to analyze, please write to “Contact Us”.
We do best effort for your request.
These are only personal opinions on this blog, and you need the investment judgment in each one. This blog doesn’t assume the responsibility to all the investment profit and loss.
Thank for watching our contents. My best regards next day.
如果您需要行情分析,请点击“Contact Us”联系我们。我们将尽力满足您的要求。
本博客仅为个人意见,请各自做出投资判断。本博客概不对任何投资盈亏负责。
感谢您访问本博客。欢迎再次使用。

