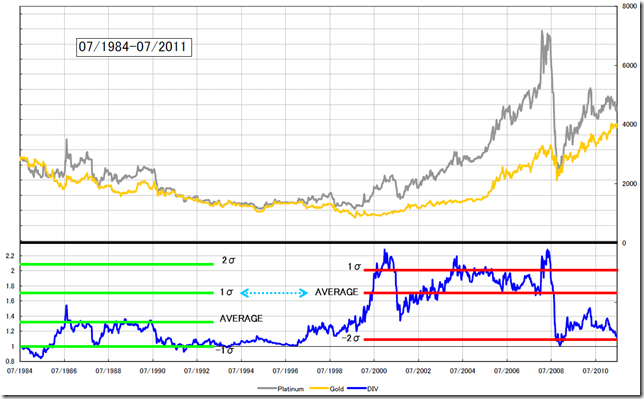
白金・金の円ベースの歴史的スプレッド/We compare the spread of Platinum and Gold (Yen based).
本日は週足線を使って東京白金と東京金の値動きを1984年からプロットしてみました。
グラフは灰色が白金の価格、黄色が金の価格、青は白金/金の価格になります。
Today, we plot Tokyo Platinum and Tokyo Gold from 1984 using weekly data.
The gray is platinum price and yellow is gold price and blue is the ratio (platinum price divided by gold price).
次にデータの平均と標準偏差をとってみます。
注目するべき点は、SPAN Aの1σの値とSPAN BのAVERAGEの値が一致していることだと考えられます。今後も白金の値段が金の値段の1.7倍を超える付近では、強く意識されると思います。
Next, we take the average and the standard deviation of data.
We need to notice “SPAN A” 1 sigma data and “SPAN B” AVERAGE data is very close.
In future, the platinum price exceeds 1.7 times the gold price; this point may work as resistance.
現在の相場はSPAN Bの下限までスプレッドは下落しており、白金が上昇するか、金が下落する局面であろうと考えられます。
In recent market, the spread is close to “SPAN B” limit; it is possible whether platinum price rises or gold price falls.
|
1984/7/23 – 2011/7/11 SPAN A |
2000/1/4 – 2011/7/11 SPAN B |
|
|
2σ |
2.09 |
2.32 |
|
1σ |
1.73 |
2.01 |
|
AVARAGE |
1.37 |
1.70 |
|
-1σ |
1.01 |
1.39 |
|
-2σ |
0.65 |
1.08 |
相場分析のリクエストがありましたら“Contact Us”からお知らせください。ご要望にお応えできるように努力いたします。
このブログはあくまでも個人的な見解であり、投資判断は各自でお願い致します。当ブログは一切の投資損益に対する責任を負いません。
ホームページに来て下さってありがとうございます。明日もよろしくお願いいたします。
If you have some request to analyze, please write to “Contact Us”.
We do best effort for your request.
These are only personal opinions on this blog, and you need the investment judgment in each one. This blog doesn’t assume the responsibility to all the investment profit and loss.
Thank for watching our contents. My best regards next day.

