ドル円中長期・トレンドライン・「110-109円台からの売り」を狙っていましたが、もうないかも? 離れは6月中旬??
ドル円中長期・トレンドライン・「110-109円台からの売り」を狙っていましたが、もうないかも? 離れは6月中旬??
USDJPY mid-to-long term; we expected ” selling from 110yen around to 109 yen around” but it may not come true; down side breaking may start in mid-June?
美元/日元。趋势线分析。我们预计“卖从110日元左右到109日元左右”,但它可能不会实现。 可能会在6月中旬开始下跌。
「ドル円中長期・狙うは110-109円台からの売り・111円台に乗せたら見通し変更」(2018/3/2)
バリバリの円高派ですが、戻り天井がイメージできないでいます。
戻り高値が完了してしまった可能性を疑い始めています。
それでも相場は、109-110円程度までの戻りがあっても、納得の位置です。
中長期の視点からみれば、毎週報告している112円台の窓(2018/4/1)までの戻りはまずないというより、今年中に実現するなら「新機軸の相場」です。
イメージするなら、このまま102円程度への下げ6割、109-110円程度までの戻し4割、テールリスクとして112円までの戻しといった感覚です。
We are Yen longer but we cannot predict proper recovery high.
Now may have already taken major high.
If the price will recover 109-110yen around this occasion will be reasonable.
But recovering 112yen around seems to be difficult and is it will come true, we need to rebuild our mind.
We can provide 3 types of scenario; main is directly fall at 102yen around (60%) and secondary is recovering 109-110yen around and fall (40%) and third is recovery to 112yen. (Tail Risk)
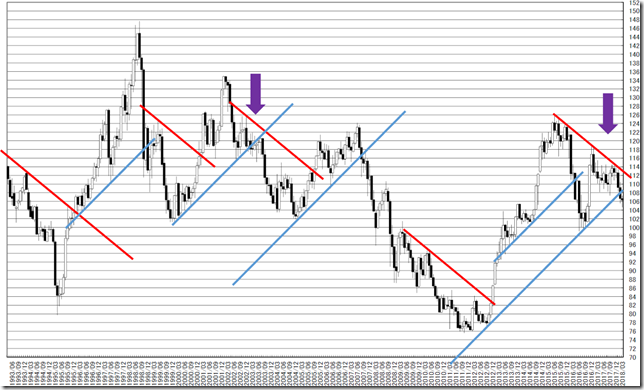
300手の月足線です。
赤と青に挟まれています。
実は珍しい現象であり、2003年にもありました。
トレンドラインが似ているとよく似た相場になりやすい。
This is 300 months chart.
The price is running between red and blue lines.
Similar case occurred in 2003.
When trend line style is similar, price movement often becomes similar.
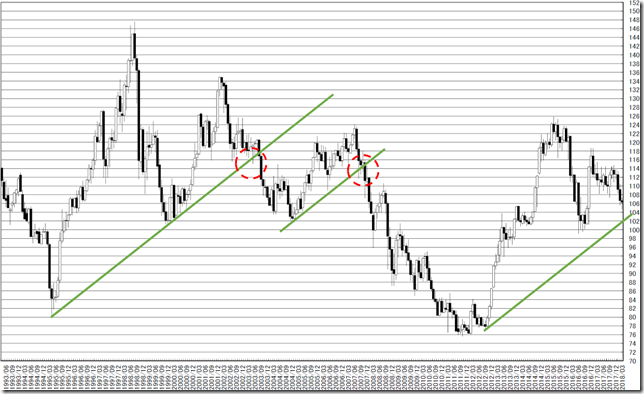
もう一つは緑です。
下方向にズビョビョビョビョと下っていく時のシグナルです。
一旦、割れた後に戻しています。
現在の相場に当てはめると100円ぐらいにタッチしてから戻すようなイメージです。
年前半に100円が底と言うのが一番しっくりくるイメージです。
The other point of view is green line.
After cutting it and the price recovered.
Applying to the latest market, the price seems to reach 100yen and recover.
The price will reach the latter half of the year and this will be reasonable.
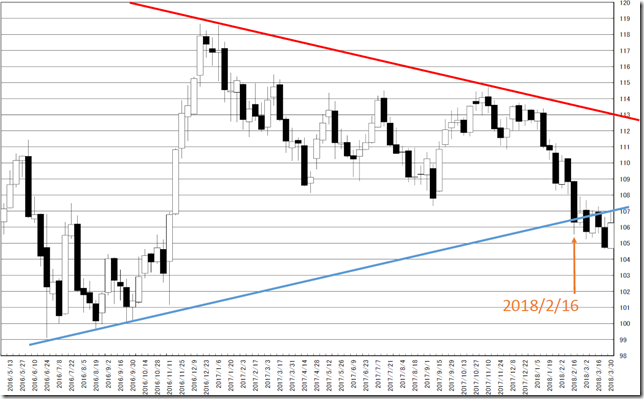
週足の状況です。
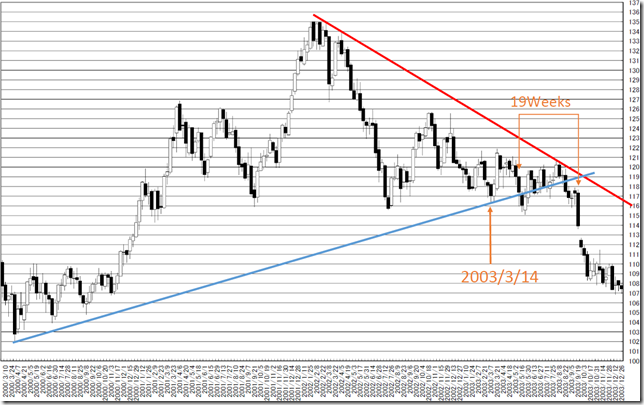
2003年の時は赤い線を割れてから、19週でズドンときています。
それまでは上値が重い状況が続いていました。
現在に当てはめると、6月中旬になります。
This is weekly chart.
In 2003 case, cutting red line and steadiness continued for some time and big fell occurred in 19 weeks.
Applying this occasion to the latest market, this will be mid-June.
相場分析のリクエストがありましたら“Contact Us”からお知らせください。ご要望にお応えできるように努力いたします。
このブログはあくまでも個人的な見解であり、投資判断は各自でお願い致します。当ブログは一切の投資損益に対する責任を負いません。
ホームページに来て下さってありがとうございます。明日もよろしくお願いいたします。
If you have some request to analyze, please write to “Contact Us”.
We do best effort for your request.
These are only personal opinions on this blog, and you need the investment judgment in each one. This blog doesn’t assume the responsibility to all the investment profit and loss.
Thank for watching our contents. My best regards next day.
如果您需要行情分析,请点击“Contact Us”联系我们。我们将尽力满足您的要求。
本博客仅为个人意见,请各自做出投资判断。本博客概不对任何投资盈亏负责。
感谢您访问本博客。欢迎再次使用。


