東京円建て金日足・瀬戸際に到達。ダブルトップ後の持ち合いの可能性あり/Tokyo market gold calculated in yen daily; the market price reached the upside limit; the market price may form double top and may be steadiness. /东京市场的黄金。市场价格达到了上攻限制。又市场价格可能会形成双顶,又可能是稳定。
東京円建て金日足・瀬戸際に到達。ダブルトップ後の持ち合いの可能性あり
Tokyo market gold calculated in yen daily; the market price reached the upside limit; the market price may form double top and may be steadiness.
东京市场的黄金。市场价格达到了上攻限制。又市场价格可能会形成双顶,又可能是稳定。
本日は東京円建て金日足についてです。
結論は、本日は包み線となり、明日の値動きが注目です。
下げてくるようであれば、高値持ち合いをファーストシナリオとしたいと思います。
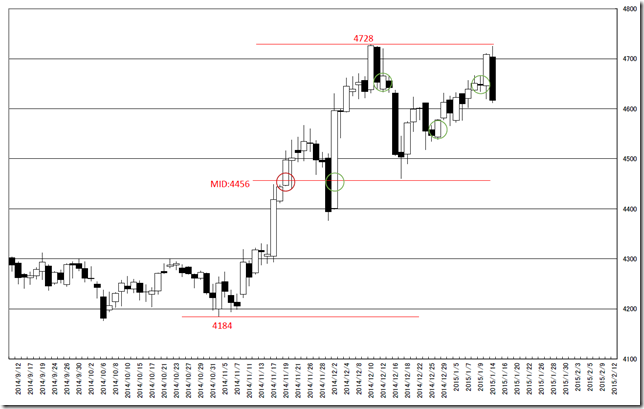
想定レンジは4728ポイントから4456ポイント。
新高値を取るようであれば5000ポイント台を目指した動きになりそうです。
Today we analyze Tokyo market gold calculated in yen daily.
The market price forms “Inside day” and next day price move will imply the condition changing.
Falling, this will be high price zone steadiness and this will be the first scenario.
The range will be from 4728 point to 4456 point.
Going higher, this will be the start of reaching 5000 point around.
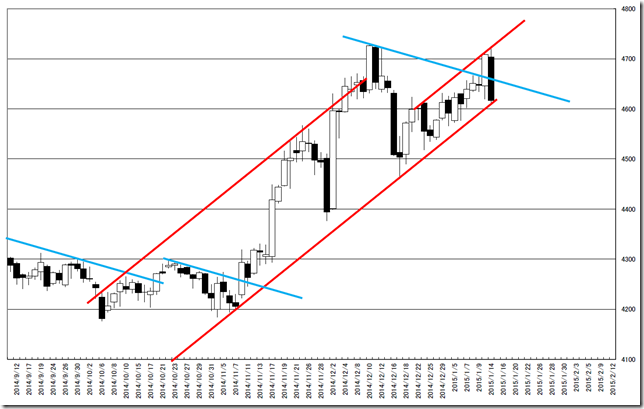
トレンドライン分析では赤色でチャネリング中のようです。
本日の安値を割り込んでくるようだと、サポートと割れです。
下限チャネルを割り込むため、上げ基調終了となりそうな気配です。
また、本日(2015/01/14)の高値は4725円、2014/12/10の高値は4728円。
ダブルトップにも警戒する必要があります。
The market price runs the channel (Red) from trend line analysis.
Cutting today’s low means the cannel cutting and will stop bullish.
And today’s high was 4725 point and 12/10/2014 high was 4728 point and this may become double top.
2014/11/19起点から半値関係です。
15営業日を頂点に反転し、20営業日で半値を試しています。
33営業日を超えて上伸しているため、伸びには期待できる型ですが、本日は値段を戻したためダブルトップ臭さも漂います。
This is the relation of the half price starting 11/19/2014.
The market price took peak in 15 business days and challenge the half price in 20 business days.
And the market price went upper 33 business days over; this often means rally but today became sharp recovery; the market price may form double top.
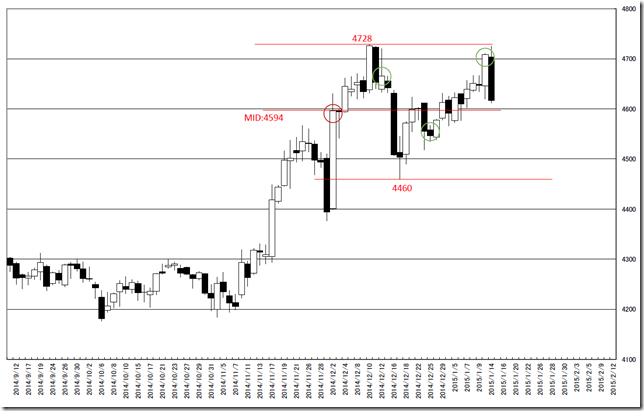
2014/12/02起点の半値関係です。
7営業日を頂点に反転し、17営業日に高値をつけ反転しています。
高値を取ったのちの反転であるため、トレンド転換の可能性があります。
This is the relation of the half price starting 12/02/2014.
The market price took high in 7 business days and took the highest in 17 business days.
And this was taking high and recover; this may imply the trend reversal.
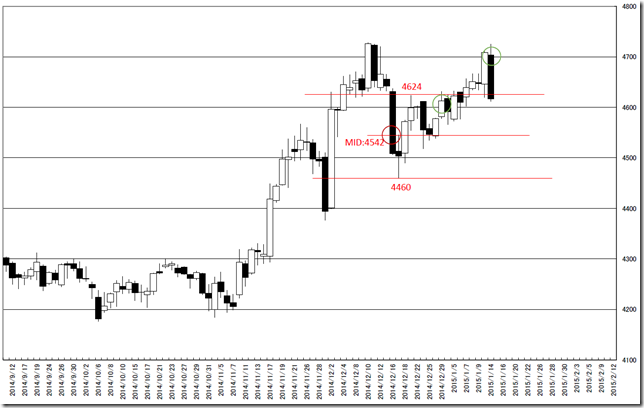
2014/12/16起点の半値関係です。
9営業日から伸びが確認でき、本日は17営業日に高値をとっています。
方向転換の可能性があります。
This is the relation of the half price starting 12/16/2014.
We can confirm rally from 9 business days and the market price took the highest in 17 business days.
This may become trend reversal.
相場分析のリクエストがありましたら“Contact Us”からお知らせください。ご要望にお応えできるように努力いたします。
このブログはあくまでも個人的な見解であり、投資判断は各自でお願い致します。当ブログは一切の投資損益に対する責任を負いません。
ホームページに来て下さってありがとうございます。明日もよろしくお願いいたします。
If you have some request to analyze, please write to “Contact Us”.
We do best effort for your request.
These are only personal opinions on this blog, and you need the investment judgment in each one. This blog doesn’t assume the responsibility to all the investment profit and loss.
Thank for watching our contents. My best regards next day.
如果您需要行情分析,请点击“Contact Us”联系我们。我们将尽力满足您的要求。
本博客仅为个人意见,请各自做出投资判断。本博客概不对任何投资盈亏负责。
感谢您访问本博客。欢迎再次使用。


