東京円建て金1980年代の相場との比較・現在の相場は下げるべき時間帯で下がられなかった/Tokyo market gold calculated in yen; Comparing to 1980’s market; the latest market did not cut the breaking point in falling “HIGARA” zone. /东京市场的黄金。比较现在的市场和1980年的市场。
東京円建て金1980年代の相場との比較・現在の相場は下げるべき時間帯で下がられなかった
Tokyo market gold calculated in yen; Comparing to 1980’s market; the latest market did not cut the breaking point in falling “HIGARA” zone.
东京市场的黄金。比较现在的市场和1980年的市场。
本日は東京円建て金です。
私たちは以下のレポートを書きましたが、1980年代の戻り高値の日柄とたいへんよく似ていたので紹介します。
Today we analyze Tokyo market gold calculated in yen.
We reported under these report and now is very similar to 1980’s “HIGARA”.
「東京円建て金週足・年末は要注意」(2013/10/17レポート)
「東京マーケット円建て金日足・年末のエネルギーは大きい」(2013/12/19レポート)
「東京マーケット円建て金月足・来月は強烈な変化時間帯」(2014/01/09レポート)
本日はザラバデータで検証します。
東京円建て金の最高値は、1980/01/21の6495円、最低値は1999/09/16の962円。
20年超の下げを経験した相場ですが、ただ一方向きに下げたと言うわけではなく、当然戻り高値がありました。
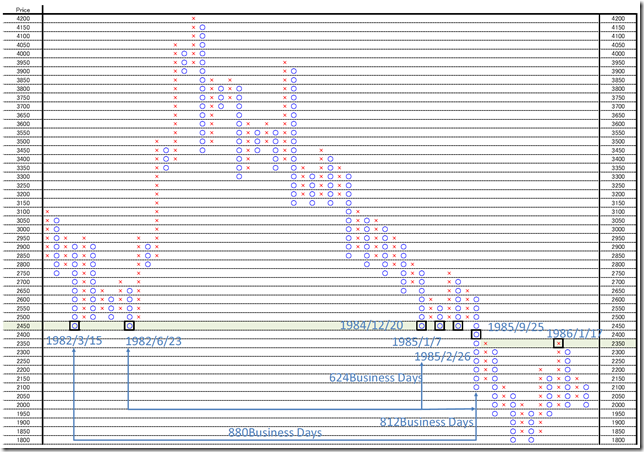
一番の戻りは1980年代初頭の上げです。
1982/3/15の2475円から1982/9/9の4220円へと上げています。
そこを頂点に下落し続け1999/09/16の962円まで下げています。
注目はこのブレークポイントです。
Today, we use continuous session data.
The highest price in Tokyo was 6495 yen (01/21/1980) and the lowest was 962 yen (09/16/1999).
This market became bearish 20 years over but it sometimes became bear market rally.
The biggest rally was early in 1980’s.
The market price run from 2475 yen (3/151982) to 4220 yen (9/9/1982).
After that the market price became bearish and fall to 962 yen (9/16/1999).
The most notable point is the breaking point.
1982/06/23の2度目の安値から、1985/9/25のブレークポイントまでの日柄は812営業日です。
1985/9/25こそが、1999/09/16へ向けた重要なブレークとなった日であり、下げはじめの起点となるべき日柄でした。
安値からの日柄だと見るならば1982/03/15から1985/9/25までの880営業日が、最長となり、そこから離れたとも考えられます。
From the secondary bottom in 06/23/1982 to the breaking point in 9/25/1985 is 812 business days.
And 9/25/1985 is the most important breaking point until the market price took the lowest in 09/16/1999.
The longest business days is 880 business days (from 3/15/1982 to 9/25/1985) and the market launching “HIGARA” may be so.
では、現在の相場です。
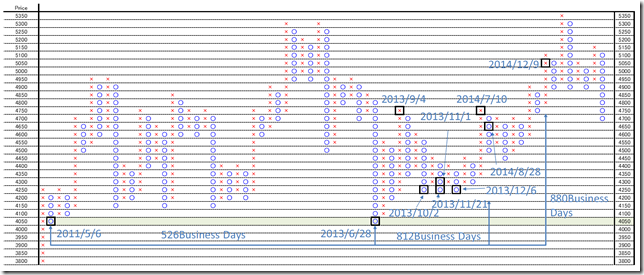
現在の相場は、2011/5/6の4089円と2013/06/28の4065円のダブルボトムからの上げとなりました。
そして、812営業日から付近では、底値を試していますが、トリプルボトムで失敗しており、880営業日では既に上に離れています。
Applying to the latest market, the market price took double dip in 5/6/2011(4089yen) and 6/28/2013(4065yen).
And the price challenged 812 business days around but failed and the price has already launched in 880 business days around.
相場と言うのは、下げられる時間に下げられなかったのであれば、上げるだけです。
しかも、長期チャートの肝となる日柄において、反転したことは注目に値します。
This chart seems to fail taking new low and reversed.
And we need to notice the market price reversed in notable “HIGARA” point and this will mean very important.
相場分析のリクエストがありましたら“Contact Us”からお知らせください。ご要望にお応えできるように努力いたします。
このブログはあくまでも個人的な見解であり、投資判断は各自でお願い致します。当ブログは一切の投資損益に対する責任を負いません。
ホームページに来て下さってありがとうございます。明日もよろしくお願いいたします。
If you have some request to analyze, please write to “Contact Us”.
We do best effort for your request.
These are only personal opinions on this blog, and you need the investment judgment in each one. This blog doesn’t assume the responsibility to all the investment profit and loss.
Thank for watching our contents. My best regards next day.
如果您需要行情分析,请点击“Contact Us”联系我们。我们将尽力满足您的要求。
本博客仅为个人意见,请各自做出投资判断。本博客概不对任何投资盈亏负责。
感谢您访问本博客。欢迎再次使用。


