2011/04

円ベースダウ・日本人の目からは、意外と上昇していません/Yen based DJI. DJI do not rise unexpectedly for Japanese point of view.

2011/04/28

本日はダウを分析しました。

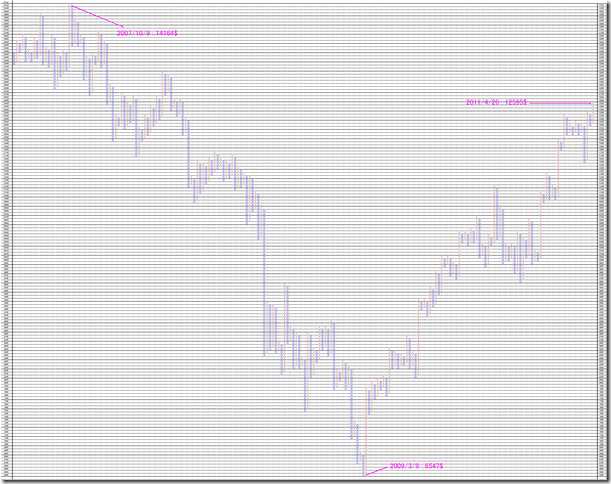
2007年からの1枠50ポイント、3枠転換の終値ポイントアンドフィギュアです。

ダウは2007年高値、2009年安値に対し、現在は79%の戻しです。

Today, we analyze NY DOW.

This is 50 price change and 3 box reversal close price’s Point and Figure chart.

Dow-Jones is a return of 79% now against 2007 high price and 2009 low price.

DOW


次にダウの価格を円ベースに変換してみます。

東京クローズのドル円とダウを掛け合わせて作った価格を作成しました。

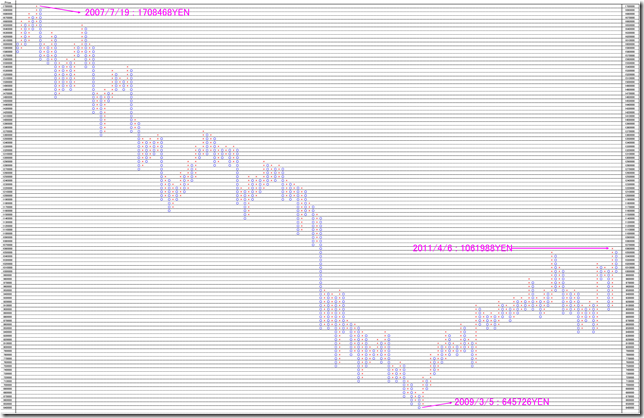
2007年からの1枠10000ポイント、3枠転換の終値ポイントアンドフィギュアです。

ダウは2007年高値、2009年安値に対し、現在は39%の戻しです。

日本人の視点からみると、ダウはさほど上昇してはいないことがわかります。

Next, we convert DJI price to Japanese Yen base.

The price is a value in which Dow-Jones is crossed to dollar yen.

This is 10000 price change and 3 box reversal close price’s Point and Figure chart.

Dow-Jones is a return of 39% now against 2007 high price and 2009 low price.

DJI do not rise unexpectedly for Japanese point of view.

YEN_BASED_DOW


相場分析のリクエストがありましたら“Contact Us”からお知らせください。ご要望にお応えできるように努力いたします。

このブログはあくまでも個人的な見解であり、投資判断は各自でお願い致します。当ブログは一切の投資損益に対する責任を負いません。

ホームページに来て下さってありがとうございます。明日もよろしくお願いいたします。

If you have some request to analyze, please write to “Contact Us”.

We do best effort for your request.

These are only personal opinions on this blog, and you need the investment judgment in each one. This blog doesn’t assume the responsibility to all the investment profit and loss.

Thank for watching our contents. My best regards next day.


NY金月足。1968年1月から2011月3月までのNY金の月足を分析しました/ NY GOLD monthly. We analyze NY GOLD monthly data from Jan. 1968 to Mar. 2011.

2011/04/27

本日はNY金を分析します。

1968年1月から2011月3月までのNY金の月足を分析しました。

Today we analyze NY gold monthly.

We analyze NY GOLD monthly data from Jan. 1968 to Mar. 2011.


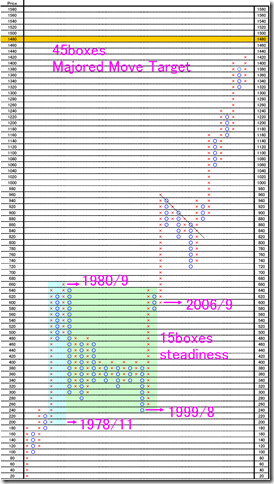
NY金月足の1枠20pt、3枠転換の終値ポイントアンドフィギュアです。

1980-2006年のマーケットでは15枠のハラミ持ち合いを形成しました。

水平分析のターゲットは、1500ポイント前後になります。

1500ポイントは重要な節目に到達していると考えられます。

2011/2/20に記述したTOPIX相場は今回のNY金相場とよく似ています。

TOPIXでは天井となりましたが、NY金はどうなるか注目です。

This is NY Gold 20pt change and 3 box reversal close price’s Point and Figure chart.

In year 1980-2006 market, the price formed 15 boxes inside day.

The price target is 1500point around calculated by horizontal method.

I think the price reached the notable price.

We can see the similar pattern of the price movement in our report “TOPIX (Tokyo stock Price Index) Daily comparing from 2003 to 2006 year and recent by horizontal method.

At that time, TOPIX market reached the top; we need to notice the GOLD market.

pf


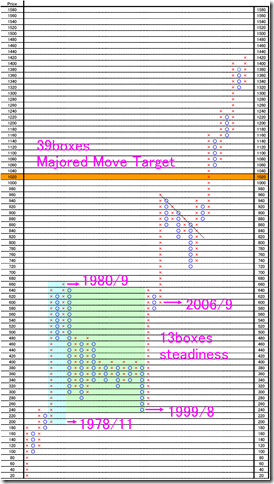
メジャーブレーク位置を240ポイントからの上昇だと考えることもできます。この場合、13枠持ち合いからのブレークとなるため、垂直分析ターゲットは1020ポイントになります。

既に目標は達成済みであり、新しい次元の相場に突入しているとも考えられます。

Other point of view, the breaking point was 240point.

In this case, we need to consider 13boxes steadiness; the target price is 1020point.

The price was already reached the target price, and now the market goes into the new stage.

pf2


相場分析のリクエストがありましたら“Contact Us”からお知らせください。ご要望にお応えできるように努力いたします。

このブログはあくまでも個人的な見解であり、投資判断は各自でお願い致します。当ブログは一切の投資損益に対する責任を負いません。

ホームページに来て下さってありがとうございます。明日もよろしくお願いいたします。

If you have some request to analyze, please write to “Contact Us”.

We do best effort for your request.

These are only personal opinions on this blog, and you need the investment judgment in each one. This blog doesn’t assume the responsibility to all the investment profit and loss.

Thank for watching our contents. My best regards next day.

© 2024 Retar