2018/07

NY金月足・今月で下げ止まるか、下げ続けるのか注目の局面・1200ドルを維持したまま反転すると強気

2018/07/31

NY金月足・今月で下げ止まるか、下げ続けるのか注目の局面・1200ドルを維持したまま反転すると強気

NY GOLD Monthly; we need to watch this market will fall more or not in this month; if the price will keep 1200 dollar over, we become bullish.

纽约黄金。我们需要注意这个市场将在本月下跌或下跌。如果价格保持在1200美元以上,我们就会看涨。


結論は今月下げ止まるか、1200ドルを維持できるかに注目。

Our conclusion is we need to watch this market will fall more or not in this month and the price will keep 1200 dollar over or not.


「NY金週足トレンドライン・想定していたバーゲン・1200ポイントミドル割れは買い場では」(2018/6/23)

「NY Gold超長期・「3月に安値をつけ、4、5月に高値圏、夏に押し、年末はラリー」は2000年代の値動きパターン・頭の片隅には1200ポイント前半までの下落も想定も必要」(2018/3/18)

基本的には「夏に底、冬に向け上昇」のパターンだとみています。

We reported “NY GOLD Weekly Trend Line; Now is expected bargain sale; cutting 1200 point middle around will be buying phase” in 6/23/2018.

We reported “NY Gold Long term; Now is similar price movement in 2000s; but we need to remind this market may be a big collection” in 3/18/2018.

Our main view is “Bottom will be taken in summer and reverse”.


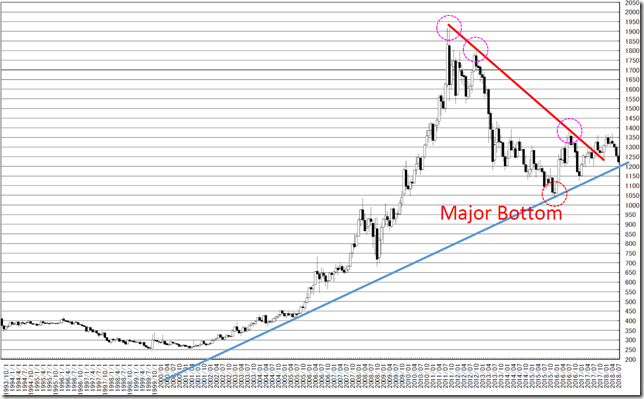
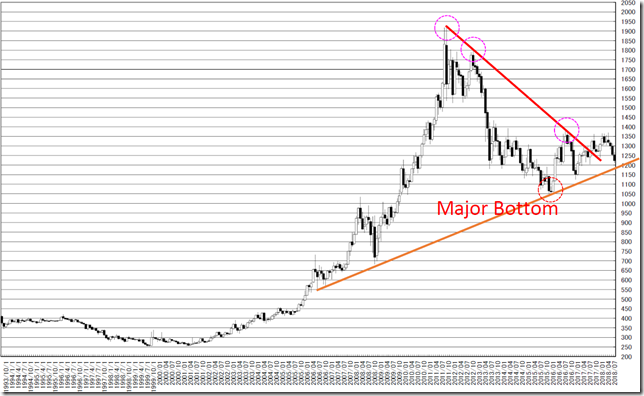
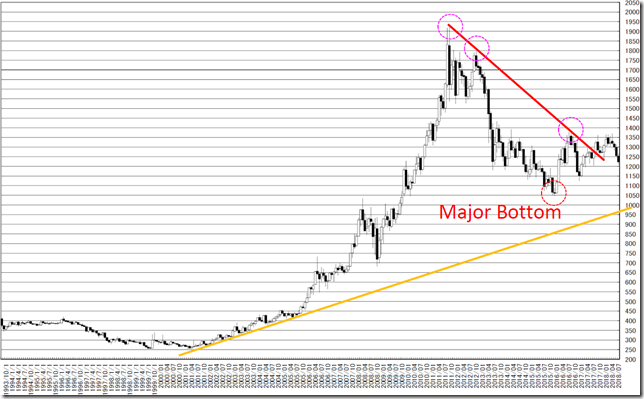
トレンドラインを引いてみました。

振り返ると赤を超えたので下げ止まったことが確認できたはずです。

1050ドルは大底であり、この地点を通過するトレンドラインには意味があります。

つまり、メインシナリオは青、オレンジで止まる。

どちらも1200ドルを指しており、注目しています。

しかし、底打ちしていないときは、黄色もあるため考えておきます。

This is trend line analysis.

We can confirm the price stopped falling by cutting Red line.

We can confirm 1050dollar is the major bottom and this point will be meaningful.

So Blue and Orange line are meaningful.

These lines point out 1200 point around.

But if the price will not have already taken the bottom, Yellow line will be next support.

chart1_convchart2_convchart3_conv


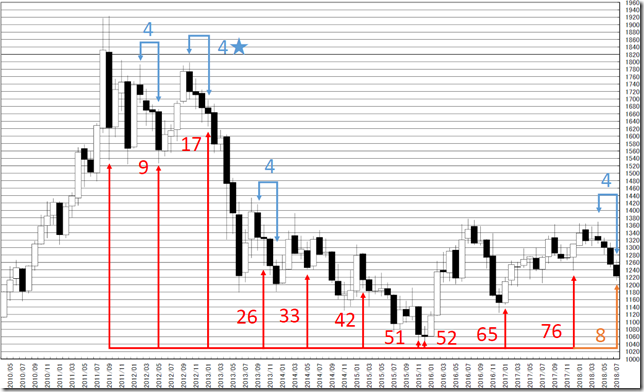
日柄的にも来月に注目しています。

4ヶ月連続を超えての陰線を出すのは「下落示唆」です。(★の地点)

来月は反転しやすいとみています。

This week will be notable from “HIGARA” view.

If the next month will be black candle stick, this will be 4 months over black and this will be bear signal. (Star point)

So we think the next month will be reversal phase.

chart4_conv


★★レポート作成時データのダウンロード★★

ブログで使用したデータをダウンロードしていただけます。

内容により非提供の場合があります。


相場分析のリクエストがありましたら“Contact Us”からお知らせください。ご要望にお応えできるように努力いたします。

このブログはあくまでも個人的な見解であり、投資判断は各自でお願い致します。当ブログは一切の投資損益に対する責任を負いません。

ブログに来て下さってありがとうございます。明日もよろしくお願いいたします。

If you have some request to analyze, please write to “Contact Us”.

We do best effort for your request.

These are only personal opinions on this blog, and you need the investment judgment in each one. This blog doesn’t assume the responsibility to all the investment profit and loss.

Thank for watching our contents. My best regards next day.

如果您需要行情分析,请点击“Contact Us”联系我们。我们将尽力满足您的要求。

本博客仅为个人意见,请各自做出投资判断。本博客概不对任何投资盈亏负责。

感谢您访问本博客。欢迎再次使用。


ドル円1時間足・レンジ上限113円even、下限は107円?の持ち合い相場・狭い値幅を急変動に注意しながら臨みたい

2018/07/30

ドル円1時間足・レンジ上限113円even、下限は107円?の持ち合い相場・狭い値幅を急変動に注意しながら臨みたい

USDJPY hourly; Now is range market from 113yen even to 107yen around; we need to aim narrow range and escape quickly.

美元/日元。现在是从113日元到107日元左右区间。我们对窄的范围需要注意的突然变化。


今週の結論はレンジ下限探し。

しばらくは107円~113円のレンジだとみています。

大枠のレンジ感が決まるまでリスクリワードに見合わないようなイメージです。

エントリーするなら「パクっと食ってトットと逃げる」。

Our conclusion is now is seeking for lower limit of the range.

The range will be from 107yen to 113yen.

In any way, we need to cut our position as soon as possible because the condition is unstable.


復習です。

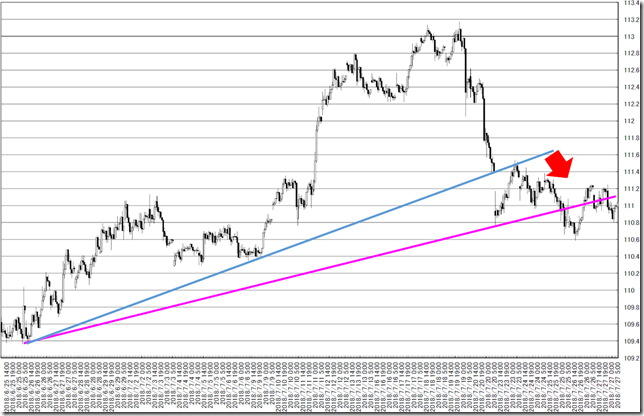
「ドル円1時間足・110円Highを守り切れるなら上方向への芽・切れると107円台を目指す動きにも。例えば、青をレジスタンスにピンクがらみのトレードが面白そうだとみています。」(2018/7/23)

大きな値幅がでるわけではなく、夏枯れなのか本当にチョビットの相場です。

Reviewing our report.

We reported “USDJPY hourly; if the price will keep 110yen high over, rally will continue; but cutting it, the target will be 107yen around. For example, main trade zone will be from blue line to pink line” in 7/23/2018.

A big price movement did not occur and we need to aim narrow range.

chart1_convchart2_conv


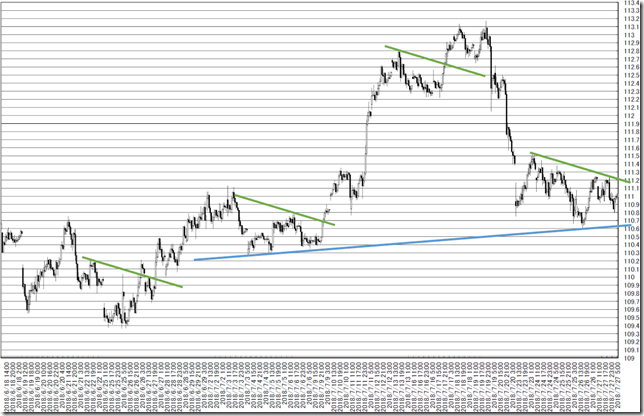
「ドル円週足・本気の下げならば111.50円付近のレジスタンスを確認してから・上ヒゲがでるかどうかよく見たい」(2018/7/24)

それでも売りから入るか、買いから入るかと聞かれたら売りです。

そう下がらないが、レンジの下限を覗きにゆくイメージです。

We reported “USDJPY weekly; if bear market will come true, we will need to confirm the resistance at 111.50yen around will work” in 7/24/2018.

But we are also aiming selling opportunity.

A big fall will not come but selling will provide opportunities.


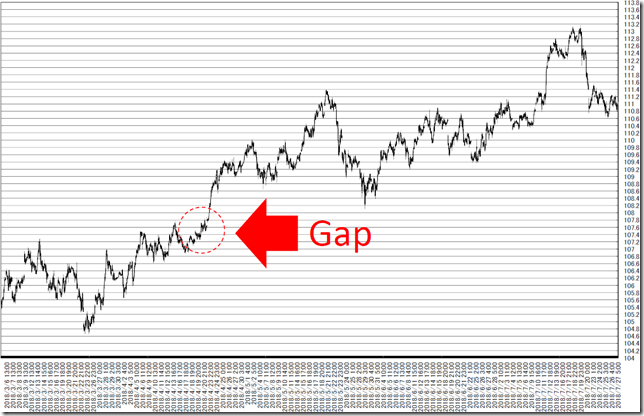
オセアニア時間帯抜きの足です。

今週は新しい窓はありません。

107円台に窓を3つ残しています。

長い時間をかけ112円台の窓は埋まりました。

「107円の窓だって絶対に埋まる」と思うのが人情です。

These are latest candle sticks without Oceania time.

There are no new gaps.

There remained 3 gaps in 107yen around.

chart3_conv


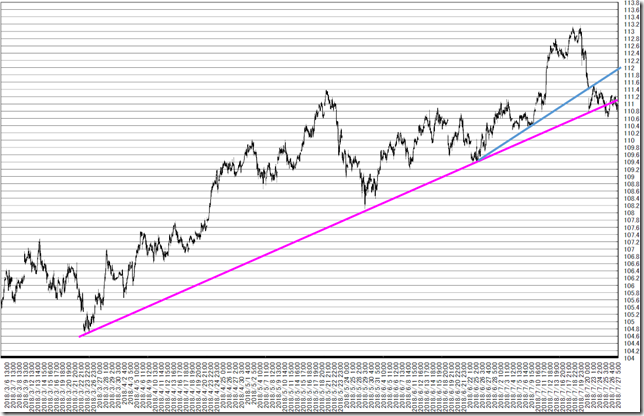
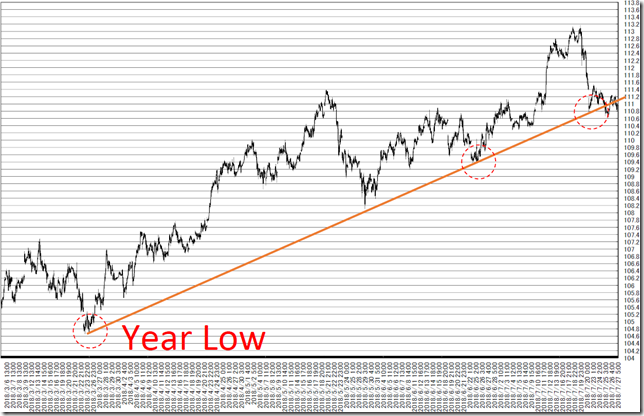
トレンドラインです。

年初来安値からの3点サポートを割り込んでいます。

しかし、週足のレジスタンスも超えています。(2018/7/25)

つまり、持ち合い臭さが満点です。

「ヤリヅラーイ」相場の特徴がいよいよ出てきます。

This is trend line analysis.

The price cut the most outer support from year low.

But the price cut the major weekly resistance.

This occasion often implies steadiness market.

So we think this market will be difficult to entry.

chart4_convchart5_conv


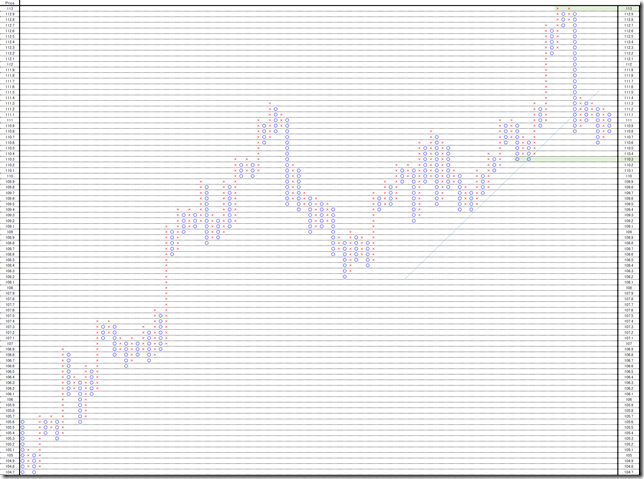
1時間足を使用しオセアニア時間帯を省いたP&Fです。

「111円even、110.30円でダブルトップです。」(2018/07/09)

抜けた方についていきたいのですが、急な戻しがあるのも最近の相場の特徴です。

例えば、110.30円を割り、110.30円がレジスタンスになるようなところを狙ってみるのがいいかもしれません。

This is 0.1 price change and 3 box reversal close price’s Point and Figure chart.

We reported “The price forms double top at 111yen and 110.30yen” in 7/9/2018.

We want to follow but sharp recovery is recent trend.

For example, cutting 110.30 yen and back to this zone may be opportunity.

PF_conv


★★レポート作成時データのダウンロード★★

ブログで使用したデータをダウンロードしていただけます。

内容により非提供の場合があります。


相場分析のリクエストがありましたら“Contact Us”からお知らせください。ご要望にお応えできるように努力いたします。

このブログはあくまでも個人的な見解であり、投資判断は各自でお願い致します。当ブログは一切の投資損益に対する責任を負いません。

ブログに来て下さってありがとうございます。明日もよろしくお願いいたします。

If you have some request to analyze, please write to “Contact Us”.

We do best effort for your request.

These are only personal opinions on this blog, and you need the investment judgment in each one. This blog doesn’t assume the responsibility to all the investment profit and loss.

Thank for watching our contents. My best regards next day.

如果您需要行情分析,请点击“Contact Us”联系我们。我们将尽力满足您的要求。

本博客仅为个人意见,请各自做出投资判断。本博客概不对任何投资盈亏负责。

感谢您访问本博客。欢迎再次使用。

© 2024 Retar