2019/02

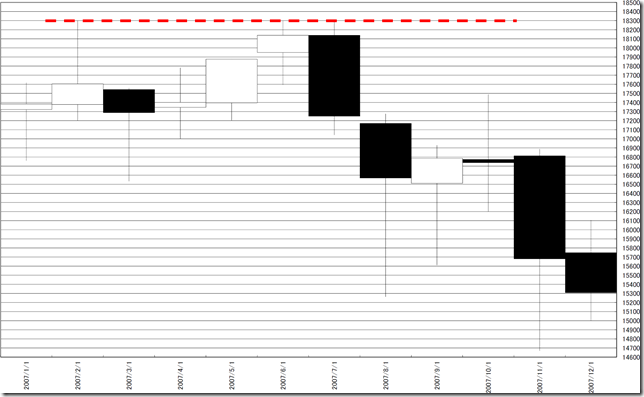
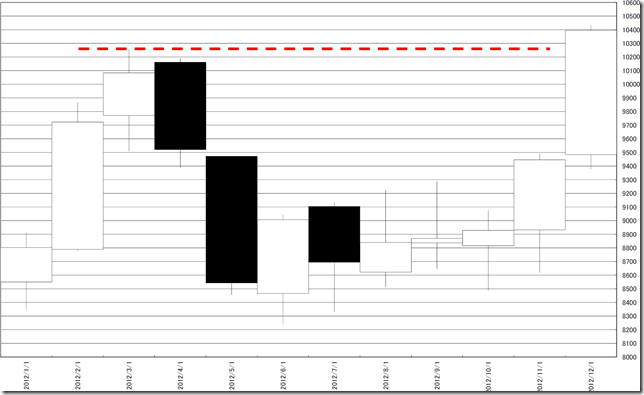
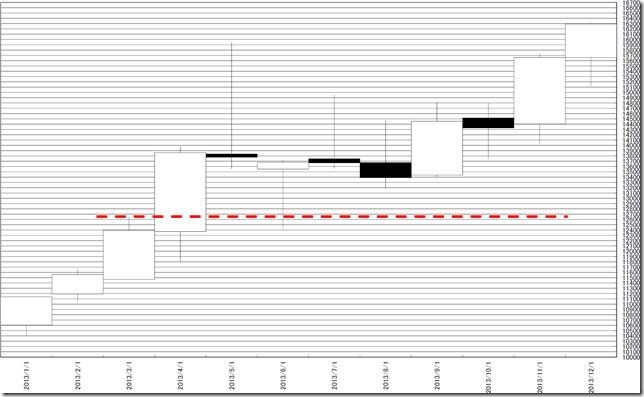
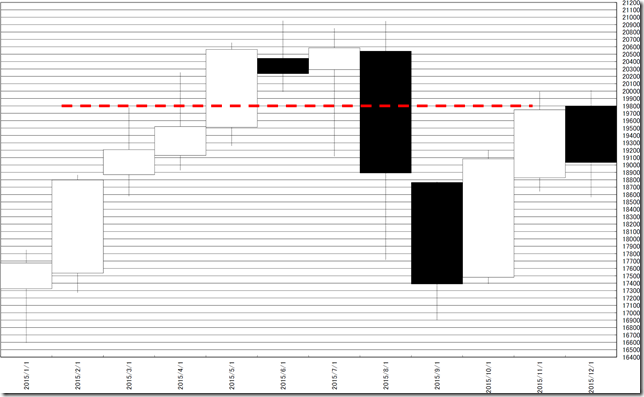
日経平均月足・2000年以降、1、2月共に陽線なのは6回・3月までの高値は重要なレジスタンス

2019/02/28

日経平均月足・2000年以降、1、2月共に陽線なのは6回・3月までの高値は重要なレジスタンス

N225 monthly; after 2000, white candle sticks in Jan. and Feb. are 6 times; the highest from Jan. to Mar. is important.

日经225。2000年之后,1月和2月的白色蜡烛棒是6次。 从1月到3月最高是很重要的。


1月、2月の日経平均月足は陽線になりました。

2000年以降のデータを調査すると、結論は3月までの高値がレジスタンスになりそうです。

N225 forms white candle stick in January and February.

After 2000, the highest form January to March will be strong resistance.


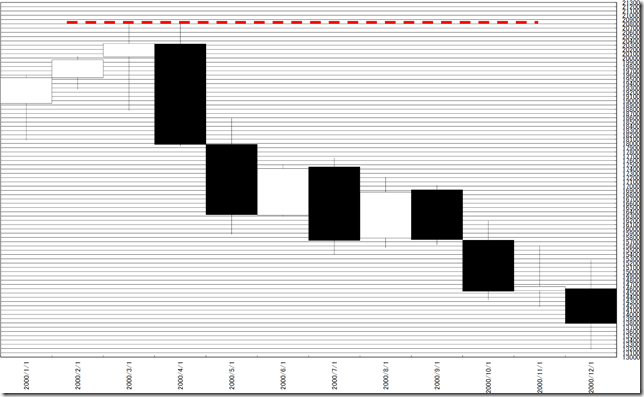
2000年以降の日経225月足です。

経験則として4月以降もグイグイ伸びるようなら、年後半も上値が追えそうです。

しかし、3月までの高値を4月以降に超えられなければ、上値は重くなりそうです。

These charts are after 2000.

We can know if rally will continue, the price will get higher in April.

But if the price will not take new high, rally will end.

2000_conv2007_conv2012_conv2013_conv2015_conv2019_conv


★★レポート作成時データのダウンロード★★

ブログで使用したデータをダウンロードしていただけます。

内容により非提供の場合があります。


相場分析のリクエストがありましたら“Contact Us”からお知らせください。ご要望にお応えできるように努力いたします。

このブログはあくまでも個人的な見解であり、投資判断は各自でお願い致します。当ブログは一切の投資損益に対する責任を負いません。

ブログに来て下さってありがとうございます。明日もよろしくお願いいたします。

If you have some request to analyze, please write to “Contact Us”.

We do best effort for your request.

These are only personal opinions on this blog, and you need the investment judgment in each one. This blog doesn’t assume the responsibility to all the investment profit and loss.

Thank for watching our contents. My best regards next day.

如果您需要行情分析,请点击“Contact Us”联系我们。我们将尽力满足您的要求。

本博客仅为个人意见,请各自做出投资判断。本博客概不对任何投资盈亏负责。

感谢您访问本博客。欢迎再次使用。


NY金日足・1320ドルを維持できれば更なる上値の可能性・P&Fでは昨年4月高値狙いの型

2019/02/27

NY金日足・1320ドルを維持できれば更なる上値の可能性・P&Fでは昨年4月高値狙いの型

NY GOLD Daily; if the price will keep 1320 dollar over, rally will continue; now is aiming the highest by P&F vertical calculation.

纽约黄金。如果价格保持在1320美元以上,反弹将继续。根据P&F,现在和去年4月的高价的目标类型是相似。


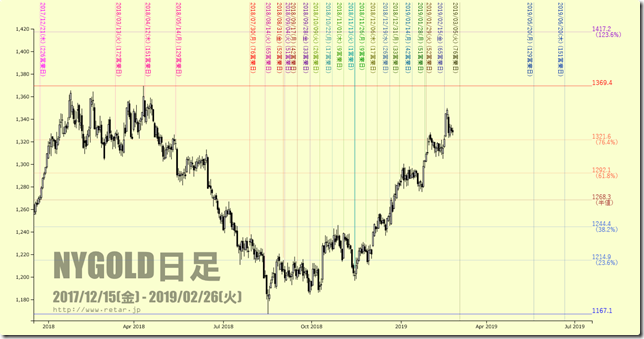
結論は1320ドルを維持できれば更なる上値の可能性。P&Fでは昨年4月高値狙いの型。

Our conclusion is if the price will keep 1320 dollar over, rally will continue.

And now is aiming the highest by P&F vertical calculation.


直近安値からの76手は2019/3/5。

新高値をつけなければ、調整から下落に転じやすいはずです。

とは言っても1300ドルの節目など、1200ドル台は少し遠くなりました。

76 business days from the latest low is 3/5/2019.

If the price will take new high before it, rally will end or falling will start.

But now is 1300 dollar over and 1200 dollar is far.

chart1


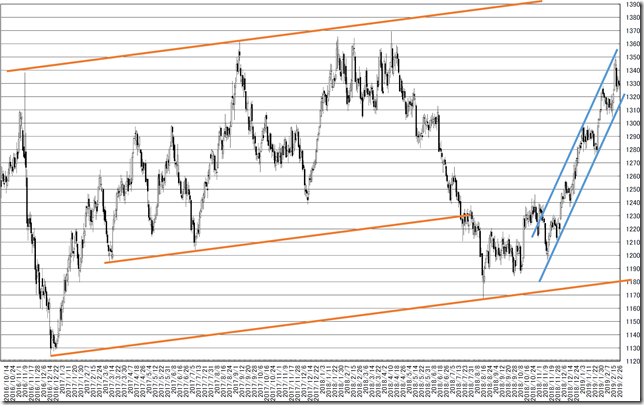
トレンドラインにはアイディアがありません。

We have no idea in trend line analysis.

chart2_conv


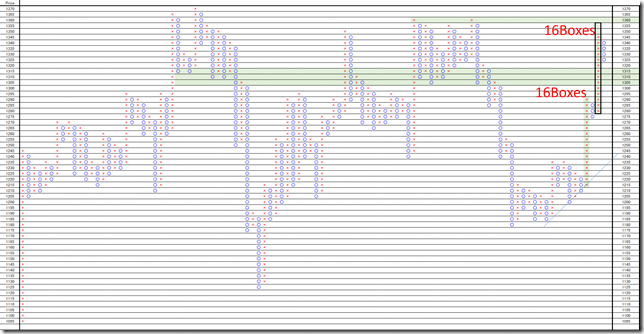
日足の5pointのP&Fです。

垂直分析では16枠のターゲットは1355ドル。

もう一声上があるとみています。

1320ドルから1300ドル付近がsupportになりそうです。

This is daily 5 point P&F chart.

1355dollar is 16 boxes vertical move target.

We think rally will continue more.

And support is from 1320 dollar to 1300 dollar.

pf_conv


★★レポート作成時データのダウンロード★★

ブログで使用したデータをダウンロードしていただけます。

内容により非提供の場合があります。


相場分析のリクエストがありましたら“Contact Us”からお知らせください。ご要望にお応えできるように努力いたします。

このブログはあくまでも個人的な見解であり、投資判断は各自でお願い致します。当ブログは一切の投資損益に対する責任を負いません。

ブログに来て下さってありがとうございます。明日もよろしくお願いいたします。

If you have some request to analyze, please write to “Contact Us”.

We do best effort for your request.

These are only personal opinions on this blog, and you need the investment judgment in each one. This blog doesn’t assume the responsibility to all the investment profit and loss.

Thank for watching our contents. My best regards next day.

如果您需要行情分析,请点击“Contact Us”联系我们。我们将尽力满足您的要求。

本博客仅为个人意见,请各自做出投资判断。本博客概不对任何投资盈亏负责。

感谢您访问本博客。欢迎再次使用。

© 2024 Retar