本日は上海総合指数日足についてです。
Today’s analyze is SSE Composite Index daily data.
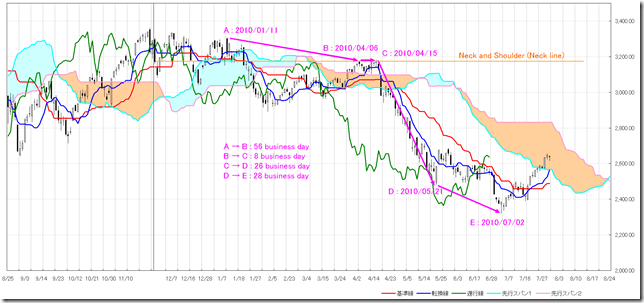
はじめに2010年相場を見てみましょう。
遅行スパンに注目すると、年初に形成したネックアンドショルダーのネックラインに戻せずに4月から下落しています。(オレンジ色)
A点は2010年の年初来高値であり、なおかつ、ネックアンドショルダーの頂点となるため、S変化点としてみなせるポイントだと思います。
A点を基点にした日柄はマゼンダ色で示しています。
First, we analyze 2010 year market.
When we pay attention to the “CHIKOU SPAN”, the market price forms the “neck and shoulder” at the beginning of the year, can not go over the “neck line” in April and fall. (See orange line)
The point A is the year high of 2010 and also the highest point of the “neck and shoulder”; we can determine “S HENKATEN”.
The A point was made a base point, and we calculate the “HIGARA”. (See magenta color)
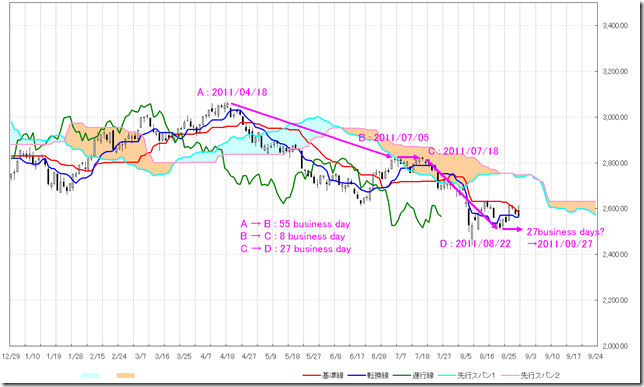
次に今年のマーケットです。
2011/04/18を基点に同じような日柄で動いているようです。ds
2011/08/22からの27営業日は2011/09/27になります。
Next is this year market.
If 2011/04/18 settles a base point, we can see the similar “HIGARA” as 2010.
27 business days from 2011/08/22 become 2011/09/27.
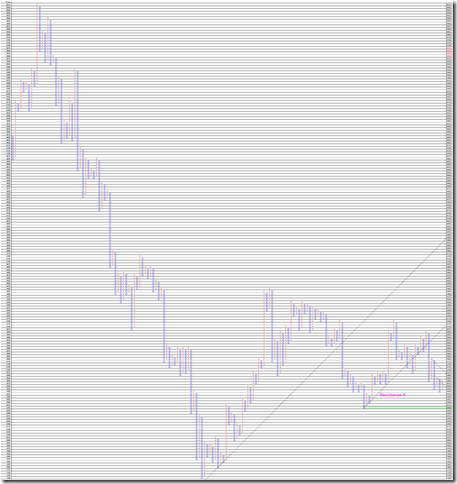
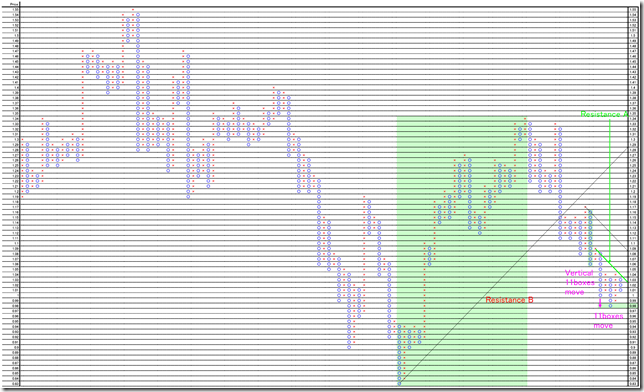
1枠25ポイント、3枠転換の終値ポイントアンドフィギュアです。
Resistance A(45度線)を割り込み価格推移しているため、弱い地合いだと考えられます。
This is 25 point change and 3 box reversal close price’s Point and Figure chart.
The market price is now under “Resistance A” (45 degree line); now the market is bearish.
相場分析のリクエストがありましたら“Contact Us”からお知らせください。ご要望にお応えできるように努力いたします。
このブログはあくまでも個人的な見解であり、投資判断は各自でお願い致します。当ブログは一切の投資損益に対する責任を負いません。
ホームページに来て下さってありがとうございます。明日もよろしくお願いいたします。
If you have some request to analyze, please write to “Contact Us”.
We do best effort for your request.
These are only personal opinions on this blog, and you need the investment judgment in each one. This blog doesn’t assume the responsibility to all the investment profit and loss.
Thank for watching our contents. My best regards next day.


