アメリカ株 : 美国股市 : U.S. stocks

APPLE週足・2013/07/15変化週・変化日アルゴリズム検出/Apple Inc. (AAPL) Weekly; 07/15/2013 week will be “HENKABI”; Automated “HEKABI” extract algorism. /苹果公司。用算法查出变化日。 “变化日”周 是2013年7月15日。

2013/05/06

APPLE週足・2013/07/15変化週・変化日アルゴリズム検出

Apple Inc. (AAPL) Weekly; 07/15/2013 week will be “HENKABI”; Automated “HEKABI” extract algorism.

苹果公司。用算法查出变化日。 “变化日”周 是2013年7月15日。


本日はアップル株週足についてです。

私たちは変化日を求めるためのアルゴリズムを研究しています。

最新アルゴリズムの信頼性が高まってきたため、本日は紹介したいと思います。

今回は未知のデータであるアップル株を扱いました。

Today’s analyze is about Apple Inc. (AAPL) (Weekly Data).

We develop the new type of algorism seeking for “HENKABI” (Based on “ICHIMOKU” method).

Since the reliability of the newest algorithm has increased, we would like to introduce today.

And we started the development of the parallel computing system applying this algorithm.

We deal the brand-new Apple Inc. (AAPL).

時計を2013/01/07に戻します。

2013/01/07時点の値動きを使用して、最新のアルゴリズムで求められた変化日が2013/02/26の週です。

普段観察していない銘柄なのでチャートです。

今後のメーンシナリオとしては、どこかで下げ止まる気配が出て、持ち合い、その後次の離れとみるのが普通のようです。

We back to the past (01/07/2013) and analyze.

02/25/2013 week is “HENKABI” point using our latest algorism.

This is not our regular watching brand.

The main future scenario is the market price will stop dropping and will be the steadiness and will rise or fall again.

はじめに基点探しです。

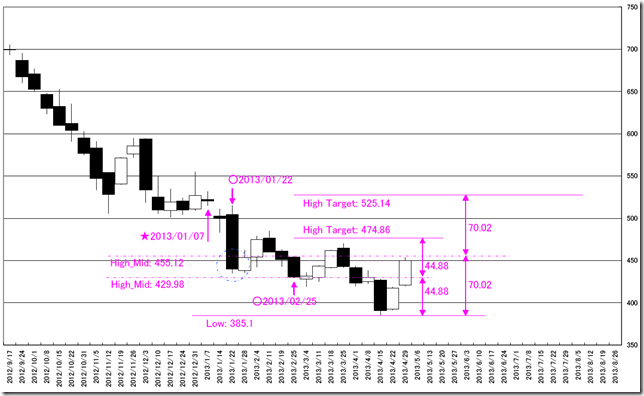
2013/02/26の週の変化日は、反転ポイントというよりも、終値、高値、安値のどれかが、半値関係となっている可能性が高いとみることができます。

このうち、半値関係が大陰線とぶつかるのは、2013/01/22となります。(青丸、高値)

先週も高値は半値で押さえ込まれています。

結論としては、2013/01/22の週からの変化日が重要になってくる。

また、レジスタンスポイントとしては、474.86、525.14ポイント。

This first is finding basis point.

We think 02/26/2013 week is not the obvious reversal point; this week’s high, low or close price will be the half price relation.

And the half price touching point with the big black candle stick is 01/22/2013 week. (Blue circle and High price touching)

The last week high price has resisted by this half price.

The conclusion is 2013/01/22 week is basis point.

And the resistance point is 474.86 ad 525.14 point.

CHART01


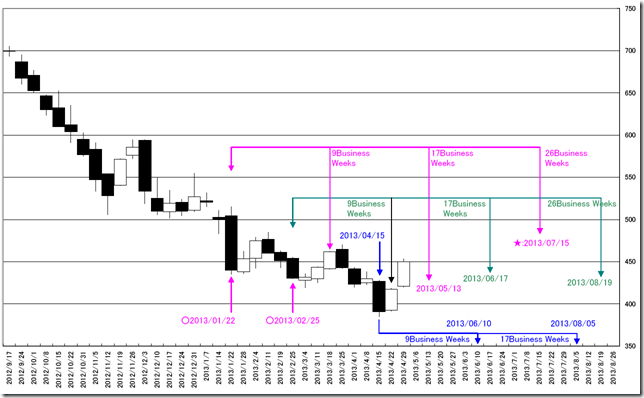
先週末までのデータを使用して、アルゴリズムで求めた変化日は2013/07/15の週です。

この地点は2013/01/22の週からの26週となっているため、確証性が高いと思います。

また、2013/01/22の週からの17週の2013/05/13の週も変化日となっている可能性が高いと思います。

Using last week data and we can conclude 07/15/2013 week will be the “HENKABI” week.

This point is the 26 business weeks from 01/22/2013 week.

And 17 business weeks from 01/22/2013 week is 05/13/2013 week and this week will also be the “HENKABI” point.

CHART02


相場分析のリクエストがありましたら“Contact Us”からお知らせください。ご要望にお応えできるように努力いたします。

このブログはあくまでも個人的な見解であり、投資判断は各自でお願い致します。当ブログは一切の投資損益に対する責任を負いません。

ホームページに来て下さってありがとうございます。明日もよろしくお願いいたします。

If you have some request to analyze, please write to “Contact Us”.

We do best effort for your request.

These are only personal opinions on this blog, and you need the investment judgment in each one. This blog doesn’t assume the responsibility to all the investment profit and loss.

Thank for watching our contents. My best regards next day.


インテル週足・2013/05/20変化週・変化日アルゴリズム検出/Intel Corporation (INTC) Weekly; 05/20/2013 week will be “HENKABI”; Automated “HEKABI” extract algorism. /英特尔公司。用算法查出变化日。 “变化日”周 是2013年5月20日。

2013/05/05

インテル週足・2013/05/20変化週・変化日アルゴリズム検出

Intel Corporation (INTC) Weekly; 05/20/2013 week will be “HENKABI”; Automated “HEKABI” extract algorism.

英特尔公司。用算法查出变化日。 “变化日”周 是2013年5月20日。


本日はインテル株週足についてです。

私たちは変化日を求めるためのアルゴリズムを研究しています。

最新アルゴリズムの信頼性が高まってきたため、本日は紹介したいと思います。

今回は未知のデータであるインテル株を扱いました。

新アルゴリズムは持ち合い関係を適切に判定されています。

Today’s analyze is about Intel Corporation (INTC) (Weekly Data).

We develop the new type of algorism seeking for “HENKABI” (Based on “ICHIMOKU” method).

Since the reliability of the newest algorithm has increased, we would like to introduce today.

And we started the development of the parallel computing system applying this algorithm.

We deal the brand-new Intel Corporation (INTC).

This new algorism can take the proper half price relation.

時計を2013/01/07に戻します。

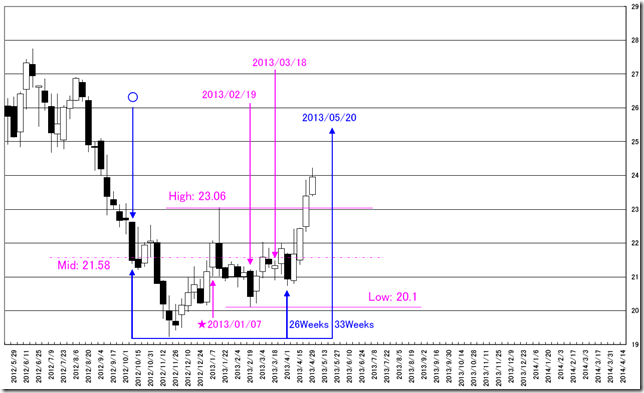
2013/01/07時点の値動きを使用して、最新のアルゴリズムで求められた変化日がピンク色です。

年初来安値を見事に捕らえています。

高値と安値の持ち合いが意識できれば、持ち合い地点が意識できます。(丸)

ここからの26週は上げの前の最後の押しとなっています。

We back to the past (01/07/2013) and analyze.

Pink arrow is “HENKABI” point. (With out star point)

This algorism points out the year low.

We need to consider the highest and the lowest point and we can reach circle point.

And the point of the last dip was 26 business weeks from the circle point.

CHART01


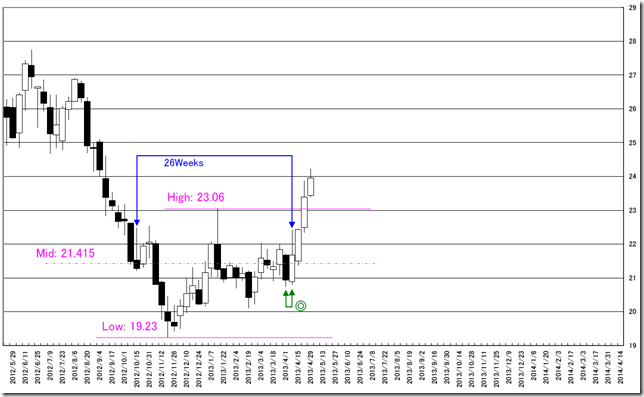
最安値と最高値の半値関係をみていくと基点となる週は翌週になります。

ここからの26週は二重丸地点となり、変化週となっています。

次の変化週は2013/05/20の週。

最安値からの26週、持ち合いからの33週となるため注目です。

The half price of the lowest and the highest point is next week and this is basis point.

And double circle point is “HENKABI” weeks.

The next “HENKABI” week is 05/20/2013 week.

This week is the 26 business weeks from the lowest and 33 business weeks from the steadiness starting point.

CHART02


相場分析のリクエストがありましたら“Contact Us”からお知らせください。ご要望にお応えできるように努力いたします。

このブログはあくまでも個人的な見解であり、投資判断は各自でお願い致します。当ブログは一切の投資損益に対する責任を負いません。

ホームページに来て下さってありがとうございます。明日もよろしくお願いいたします。

If you have some request to analyze, please write to “Contact Us”.

We do best effort for your request.

These are only personal opinions on this blog, and you need the investment judgment in each one. This blog doesn’t assume the responsibility to all the investment profit and loss.

Thank for watching our contents. My best regards next day.

© 2024 Retar