2019/05

日経平均週足・羽黒13(12)号線・普通なら底入れか、下げ余地の小さいシグナル

2019/05/31

日経平均週足・羽黒13(12)号線・普通なら底入れか、下げ余地の小さいシグナル

NIKKEI 225 week; “HAGURO” No.13(12) formation; in usual cases, this formation often implies bottom out.

日经225。羽黑13(12)号线形成的结合常常意味着采取底部。


結論は、羽黒足の真骨頂出現、ベアマーケットの踏み絵。

真のベアマーケットは13(12)号線を抜くこととも言える足です。

Our conclusion is if the price will get lower in next week, we can confirm bear market.


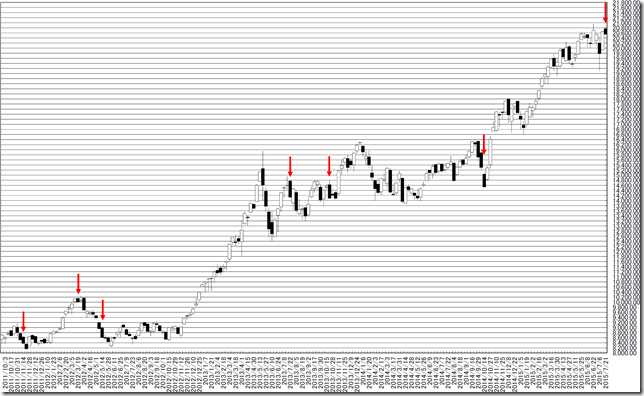
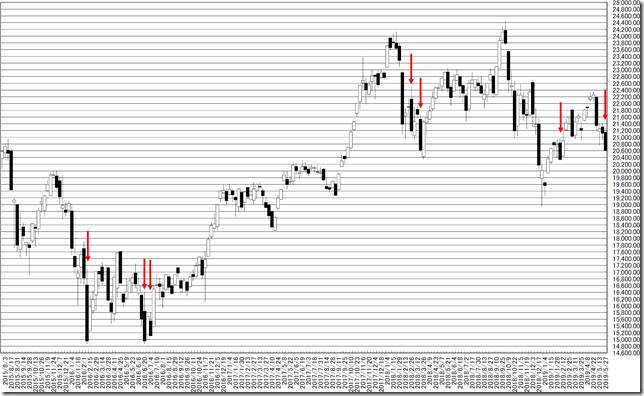
日経225週足線は羽黒13(12)号線となりました。

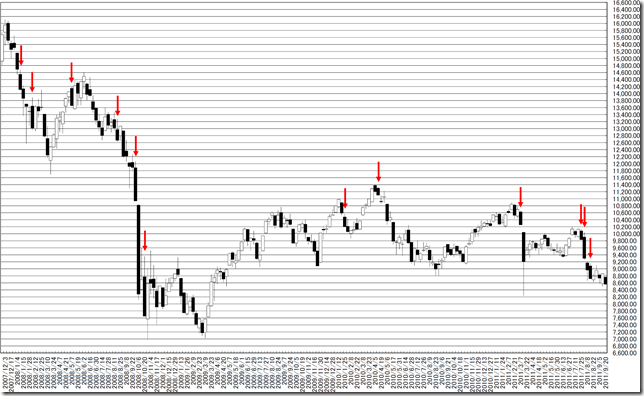
日経225週足線では600週で羽黒13(12)号線は27回出現しています。

通常の場合は、この足が出るとリバーサルシグナルになりました。

しかし、リーマン前のようなときは、反転してもバンバン実体抜きしていきます。

In this week, N225 formed “HAGURO” No. 13(12) formation.

In past 600 weeks, N225 price formed “HAGURO” No. 13(12) formation was 27 times.

In usual cases, we can see this formation became reversal signal.

But a big fall before Lehman shock, the price cut the lowest with candle stick black body.

chart1_convchart2_convchart3_conv


相場分析のリクエストがありましたら“Contact Us”からお知らせください。ご要望にお応えできるように努力いたします。

このブログはあくまでも個人的な見解であり、投資判断は各自でお願い致します。当ブログは一切の投資損益に対する責任を負いません。

ブログに来て下さってありがとうございます。明日もよろしくお願いいたします。

If you have some request to analyze, please write to “Contact Us”.

We do best effort for your request.

These are only personal opinions on this blog, and you need the investment judgment in each one. This blog doesn’t assume the responsibility to all the investment profit and loss.

Thank for watching our contents. My best regards next day.

如果您需要行情分析,请点击“Contact Us”联系我们。我们将尽力满足您的要求。

本博客仅为个人意见,请各自做出投资判断。本博客概不对任何投资盈亏负责。

感谢您访问本博客。欢迎再次使用。


米ダウ工業株週足・トランプ大統領の支持率と株価には正の相関関係があるようです

2019/05/30

米ダウ工業株週足・トランプ大統領の支持率と株価には正の相関関係があるようです

DJI Weekly Data; we can know positive correlation between approval of Mr. Trump and stock price.

美国道琼斯。特朗普总统的支持率与股票价格之间存在正相关关系。


本日はトランプ大統領の支持率と株価指数の相関関係を調べてみました。

ギャラップ社のデータと週足クローズで書いてみました。

Today, we survey correlation between approval of Mr. Trump and stock price.

We use Gallup data and close price.


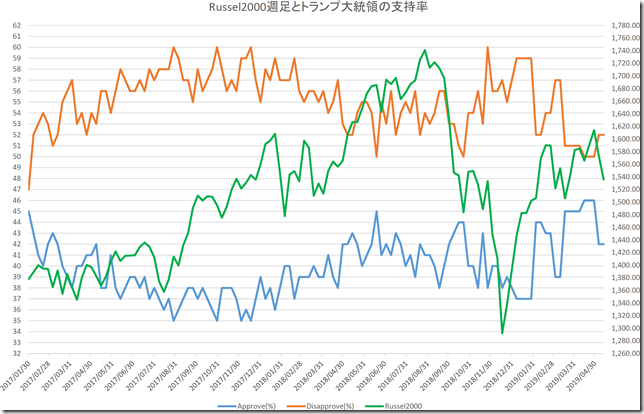
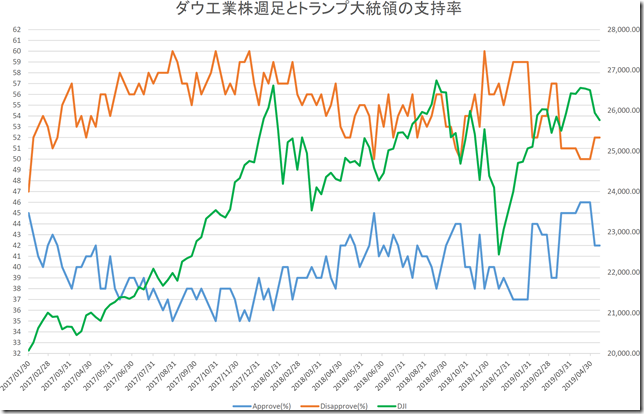
株価と支持率の2Y軸のチャートを書いてみてもぜんぜん関係が分かりません。

We plot stock price, approval (%) and disapproval (%).

But we can find out nothing.

chart1_conv

chart2_conv


相関関係をみてみると、強い相関があるわけではありません。

しかし、傾向として株価が上がると支持率があがり、不支持率が下がります。

相対的にもRussell 2000の方との相関関係が高いため、分析しておくと投資に役立つと思います。

There are no strong correlation.

But there is weak correlation between stock price and approval.

And Russell 2000 is stronger relation.

chart3_conv


相場分析のリクエストがありましたら“Contact Us”からお知らせください。ご要望にお応えできるように努力いたします。

このブログはあくまでも個人的な見解であり、投資判断は各自でお願い致します。当ブログは一切の投資損益に対する責任を負いません。

ブログに来て下さってありがとうございます。明日もよろしくお願いいたします。

If you have some request to analyze, please write to “Contact Us”.

We do best effort for your request.

These are only personal opinions on this blog, and you need the investment judgment in each one. This blog doesn’t assume the responsibility to all the investment profit and loss.

Thank for watching our contents. My best regards next day.

如果您需要行情分析,请点击“Contact Us”联系我们。我们将尽力满足您的要求。

本博客仅为个人意见,请各自做出投资判断。本博客概不对任何投资盈亏负责。

感谢您访问本博客。欢迎再次使用。

© 2024 Retar