2017/06

日経平均週足・羽黒16(10)号線・またまたハラミの抜けなし・終値20200円超えから買い・サポート19883.92円/NIKKEI 225 weekly is “HAGURO” No.16(10) formation; Still “Inside day”; cutting 20200yen over will start new rally and support is 19883.92yen. /日经225。羽黑16(10)号线。支持是1988.3.92日元。

2017/06/30

日経平均週足・羽黒16(10)号線・またまたハラミの抜けなし・終値20200円超えから買い・サポート19883.92円

NIKKEI 225 weekly is “HAGURO” No.16(10) formation; Still “Inside day”; cutting 20200yen over will start new rally and support is 19883.92yen.

日经225。羽黑16(10)号线。支持是1988.3.92日元。


本日は日経225についてです。

Today is about N225 Weekly.


「日経平均・過去をなぞるなら20000円超の値もちはどんなに長くても今年10月末まで?・20200円を超えたらとりあえずLong」(2017/6/8)

2017/6/20には、「本日は20200円の終値を超えてきましたが、週末まで20200円をKeepできるか注目です。週足終値で20200円超をキープできると、Rally startとみています。」と報告しています。

相変わらず20200円は近くて遠い。

We reported “N225 historically; keeping 20000yen over may be end of October at longest; 20200yen over will be buying opportunity” in 6/8/2017.

We reported “Today, the market price went 20200yen over in close price and keeping 20200yen over in weekend close will start a new rally” in 6/20/2017

20200yen is still close but keeping is difficult.


日経225週足線は羽黒16(10)号線となりました。

日経225週足線では200週で羽黒16(10)号線は39回出現しています。

単体では判別不能の線です。

In this week, N225 formed “HAGURO” No. 16(10) formation.

In past 200 weeks, N225 price formed “HAGURO” No. 16(10) formation was 39 time.

Single formation does not have no mean.


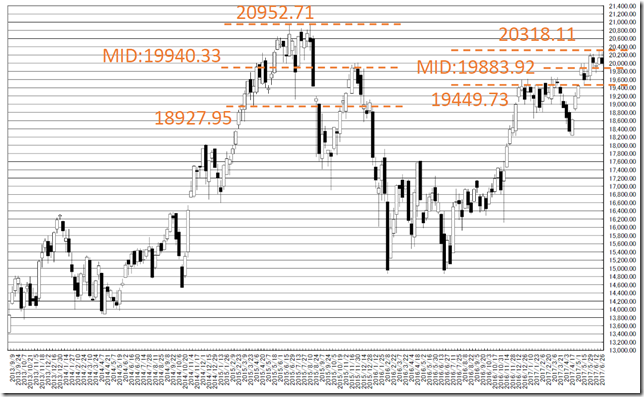
今週確認できたことは、「20200円は強力なレジスタンス」。

つまり、強力なブレークポイントです。

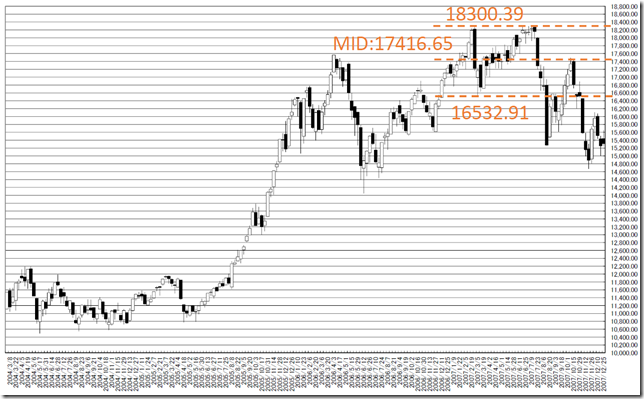
一方、過去の天井付近の様子を観察すると、抜けないレジスタンスの示現がありました。

落ちることを考えると、天井付近の押しと天井の半値が重要サポートになる性質があるようです。

今回の場合は、19883.92円。

実体抜きを伴った下落はピークアウトのシグナルとなりそうです。

We can confirm “20200yen works resistance”.

This means 20200 yen is strong breaking point.

On the other hand, in past highest, we can confirm strong resistance points.

When the price falls, the half price between the highest and the first dip word as support.

Applying this to the latest case, this price is 19883.92yen.

Cutting 19883.92yen with candle stick body will be a signal of start falling.

chart0

chart1

相場分析のリクエストがありましたら“Contact Us”からお知らせください。ご要望にお応えできるように努力いたします。

このブログはあくまでも個人的な見解であり、投資判断は各自でお願い致します。当ブログは一切の投資損益に対する責任を負いません。

ホームページに来て下さってありがとうございます。明日もよろしくお願いいたします。

If you have some request to analyze, please write to “Contact Us”.

We do best effort for your request.

These are only personal opinions on this blog, and you need the investment judgment in each one. This blog doesn’t assume the responsibility to all the investment profit and loss.

Thank for watching our contents. My best regards next day.

如果您需要行情分析,请点击“Contact Us”联系我们。我们将尽力满足您的要求。

本博客仅为个人意见,请各自做出投资判断。本博客概不对任何投资盈亏负责。

感谢您访问本博客。欢迎再次使用。


米ダウ工業株・変化日2017/7/11、2017/7/12・サマーラリーかも/Dow Jones Industrial Average (^DJI) Daily; “HENKABI” are 7/11/2017 and 7/12/2017; Summer rally? /美国道琼斯工业平均指数。“变化日”是2017年7月11号和2017年7月12号。夏季的反弹,是不是?

2017/06/29

米ダウ工業株・変化日2017/7/11、2017/7/12・サマーラリーかも

Dow Jones Industrial Average (^DJI) Daily; “HENKABI” are 7/11/2017 and 7/12/2017; Summer rally?

美国道琼斯工业平均指数。“变化日”是2017年7月11号和2017年7月12号。夏季的反弹,是不是?


本日は米ダウ工業株日足についてです。

バブルなら、上昇に恐怖するものです。

結論は変化日前後から新高値となるなら、サマーラリーとなりそうです。

Today’s analyze is Dow Jones Industrial Average (^DJI) Daily.

When bubble comes true, rally often be fearful.

Our conclusion is when new high will be at “HENKABI” around, this will be the signal of summer rally.


日柄のレポートは復習つきで解説していきます。

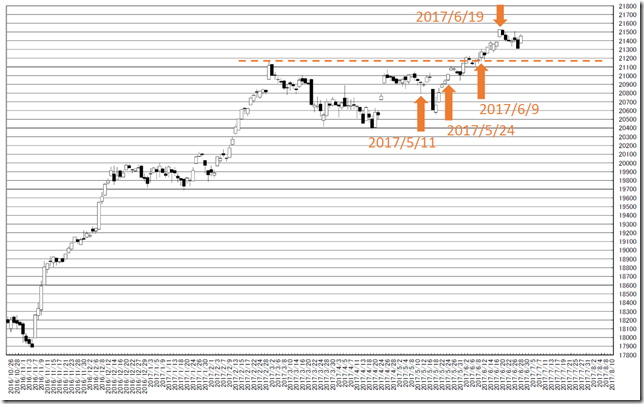
「米ダウ工業株・変化日2017/5/11、2017/5/24、2017/6/9・変動は6月中旬?」(2017/5/10)

夏至直前に高値をつけ、新高値をとれないでいます。

We review our past “HIGARA” report in any time.

We reported “Dow Jones Industrial Average (^DJI) Daily; “HENKABI” are 5/11/2017, 5/24/2017 and 6/9/2017; A big price movement may start in mid-June?” in 5/10/2017.

This market took the highest before summer solstice and cannot take new high after that.

chart1


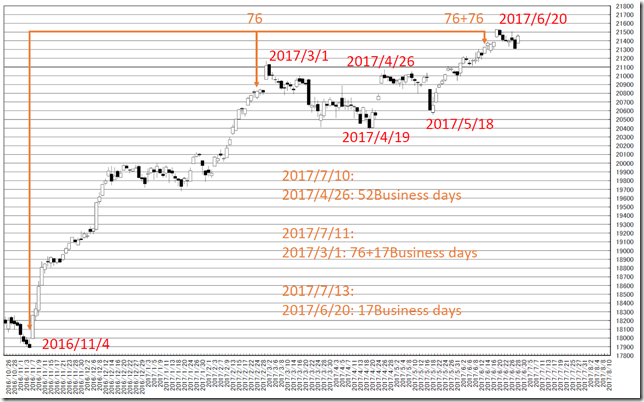
メジャーピークからの位置です。

主だった集中日はありません。

2017/7/10から2017/7/13に注目したいと思います。

むしろ注目するべき点は2016/11/4からの76+76手を過ぎたことです。

次の76手は相場が違った顔をみせるとみています。

This is from the major peaks.

There are no major concentrated days.

Notable days are from 7/10/2017 to 7/13/2017.

Rather than, most notable point has already passed 76+76 business days from 11/4/2017.

Next 76 business days will change condition.

chart2


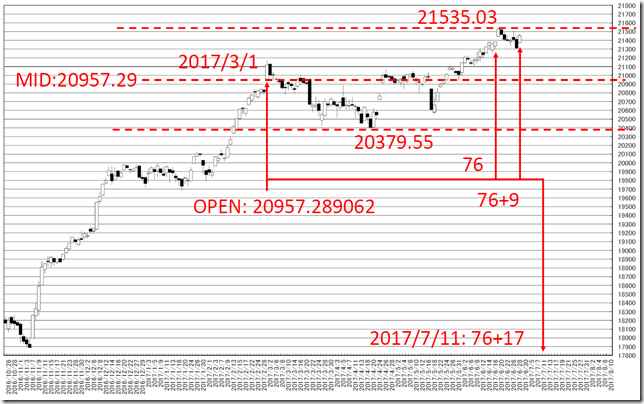
2017/3/1基点の持ち合いです。

76+17手は2017/7/11。

76手から新高値、76+9手前に反転は強気の示唆です。

また、2017/3/1に見事な半値をとっており、レンジも適切です。

新高値から買いとなる相場ですが、抑え込まれると持ち合いだとみています。

This is the steadiness from 3/1/2017.

76+17 business days is 7/11/2017.

In 76 business days, the price took new high and the price reversed before 76+9 business days; these are bullish signal.

And the half price was perfect day and range seems to be proper.

New high will start new rally but if cannot take new high, this market will be range market.

chart3


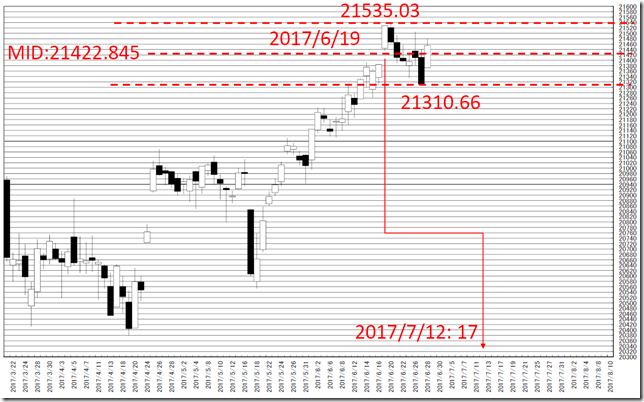
2017/6/19基点の持ち合いです。

9手は2017/6/29、17手は2017/7/12。

This is the steadiness from 6/19/2017.

9 business days is 6/29/2017 and 17 business days is 7/12/2017.

chart4


相場分析のリクエストがありましたら“Contact Us”からお知らせください。ご要望にお応えできるように努力いたします。

このブログはあくまでも個人的な見解であり、投資判断は各自でお願い致します。当ブログは一切の投資損益に対する責任を負いません。

ホームページに来て下さってありがとうございます。明日もよろしくお願いいたします。

If you have some request to analyze, please write to “Contact Us”.

We do best effort for your request.

These are only personal opinions on this blog, and you need the investment judgment in each one. This blog doesn’t assume the responsibility to all the investment profit and loss.

Thank for watching our contents. My best regards next day.

如果您需要行情分析,请点击“Contact Us”联系我们。我们将尽力满足您的要求。

本博客仅为个人意见,请各自做出投资判断。本博客概不对任何投资盈亏负责。

感谢您访问本博客。欢迎再次使用。

© 2024 Retar