2012/08

NY原油。98ドルにレジスタンスポイント、83ドルにサポート/West Texas Intermediate (WTI); resistance point is 98point and support point is 83point./西德克萨斯中质原油(WTI),阻力点为98点和支持点是83点。

2012/08/31

NY原油。98ドルにレジスタンスポイント、83ドルにサポート

West Texas Intermediate (WTI); resistance point is 98point and support point is 83point.

西德克萨斯中质原油(WTI),阻力点为98点和支持点是83点。


本日はNY原油についてです。

Today’s analyze is West Texas Intermediate (WTI).


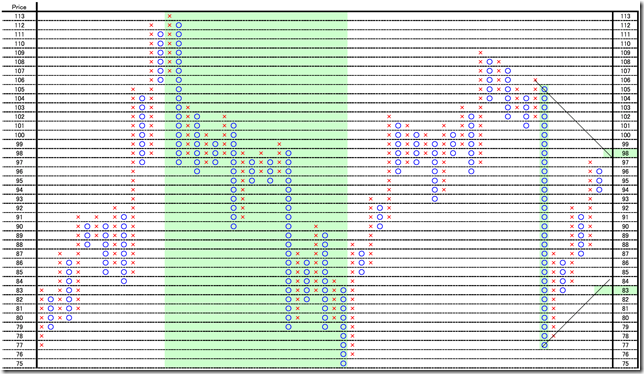
日足のポイントアンドフィギュアです。

1枠1ポイント、3枠転換の終値ポイントアンドフィギュアです。

2012/06/08の通り「NY原油。腰を据えた下落ならターゲット71ポイント」の見方には変更ありません。キャンセルは105ポイント超えです。

目先はハラミからの45度線のブレークに注目です。

現在の上方ブレークは98ポイント、下方ブレークは83ポイントです。

This is Point and Figure chart written by daily data.

This is 1 point price change and 3 box reversal close price’s Point and Figure chart.

Our view in 06/08/2012 “West Texas Intermediate (WTI); if this may become true fall, the target price is 71point” has not changed.

We need to watch the market price cut which direction of 45 degree resistance or support.

The latest upper side breaking point is 98point and down side is 83point.

PF


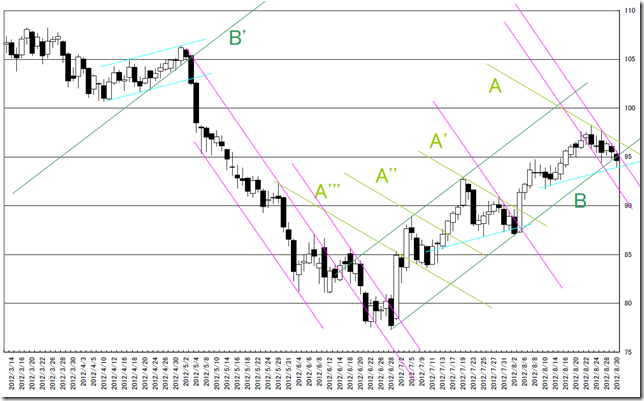
トレンドラインも引きなおしました。

同じ角度のもので色分けしています。

原油チャートのトレンドラインはダマシが少ないと感じます。

A線系列を終値でしっかり越えるところで、LONGを建てるといい感じですね。

同じことが3回続いたので、そろそろ同じ手口は使えないかもしれません。

注目はB線系列です。B線を割り込んだところで、前回は下落に転じています。

もし今ロングを持っていたら、私だったら手仕舞いします。

水色は前回ダマシとなりましたが、ダマシとならない所かもしれません。

ピンクも上値を押さえ込んできているのも注目。

We added trend line on the chart.

We colored same degree lines.

We fell there are few cheats in this chart.

When the market price cut “A” linear series, they were the best point to take long position.

There occurred 3times and we can not use this tactics.

The most notice point is “B” linear series; last time, the market price fall there.

If I have long position, I would close.

The Light-blue line may works as support, but this may cheat.

And pink line appeared; this may work as strong resistance point.

CHART


相場分析のリクエストがありましたら“Contact Us”からお知らせください。ご要望にお応えできるように努力いたします。

このブログはあくまでも個人的な見解であり、投資判断は各自でお願い致します。当ブログは一切の投資損益に対する責任を負いません。

ホームページに来て下さってありがとうございます。明日もよろしくお願いいたします。

If you have some request to analyze, please write to “Contact Us”.

We do best effort for your request.

These are only personal opinions on this blog, and you need the investment judgment in each one. This blog doesn’t assume the responsibility to all the investment profit and loss.

Thank for watching our contents. My best regards next day.


ドル円。ブレークポイント79.60円超え、77.50円割れ/Dollar/Yen; the upper side breaking is 79.60yen and the down side breaking is 77.50yen. /美元/日元。上侧破是79.60日元的,和向下的侧破是77.50日元的。

2012/08/30

ドル円。ブレークポイント79.60円超え、77.50円割れ

Dollar/Yen; the upper side breaking is 79.60yen and the down side breaking is 77.50yen.

美元/日元。上侧破是79.60日元的,和向下的侧破是77.50日元的。


本日はドル円についてです。

「ドル円長期足。後味は悪くとも下落相場に転換と見ています」の通りです。(2012/06/06レポート参照)

週末NYクローズに82.00円以上をつけるまでは、下落トレンド継続だと私は思います。

2012/08/14の見立て「ドル円中長期。上がるなら85円付近、下がるなら74円台ターゲット」にも変更ありません。

Today’s analyze is Dollar/Yen rate.

We reported “Long term USDJPY view. As aftertaste is bad; we think the market became bearish market.” in 06/06/2012 report.

We think now is bear market until the weekend NY close price will go over 82.00yen.

Our view in 08/14/2012 is not still change.


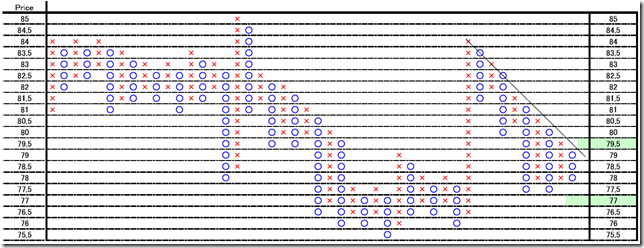
1枠0.5円、3枠転換の終値ポイントアンドフィギュアです。

1時間足を使用しオセアニア時間帯を省いています。

上方ブレークポイントは79.50円、下方ブレークポイントは77.00円です。

This is 0.5 price change and 3 box reversal close price’s Point and Figure chart.

We used hourly data and the Oceania time zone market price is pulled out.

The upper side breaking point is 79.50yen and down side breaking point is 77.00yen.

05


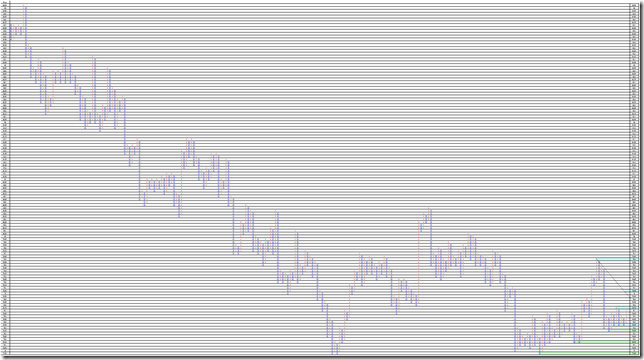
1枠0.05円、3枠転換の終値ポイントアンドフィギュアです。

1時間足を使用しオセアニア時間帯を省いています。

上方ブレークポイントは78.75円、79.05円、79.60円となります。

下方ブレークポイントは78.45円、78.35円、78.15円、77.95円となります。

This is 0.05 price change and 3 box reversal close price’s Point and Figure chart.

We used hourly data and the Oceania time zone market price is pulled out.

The upper side breaking point is 78.75yen, 79.05yen and 79.60yen.

The down side breaking point is 78.45yen, 78.35yen, 78.15yen and 77.95yen.

005


この2つのチャートから考えられることは、以下のようになります。

  • 79.05円を超えると79.50-79.60円の抵抗帯手前で弾かれやすい。
  • 79.50-79.60円の抵抗帯を抜けると上方向に走りやすい。
  • 78.45円から下方に4つの抵抗帯を控えており、どこかで下堀もとまる可能性が高い。
  • 77.95を割り込んでも77.50を割り込まない限り下方ブレークとはならないため、どこかで止まってもおかしくない。
  • 77.50円割れで下方ブレーク


どちらかに離れないと仕掛けづらいと思います。


From these charts, we can see under these.

  • If the market price will go over 79.05yen, 79.50-60yen will work as resistance point.
  • If the market price will go over 79.50-60yen, this is upper side breaking.
  • There are 4 resistance points under 78.45yen, and these resistance points will work.
  • If the market price cut 77.95yen and does not cut 77.50yen, this is not the real down side breaking; the market price will be reversal.
  • If the market price will cut 77.50yen, this is down side breaking.

Our conclusion is “Waiting for the breaking”.


相場分析のリクエストがありましたら“Contact Us”からお知らせください。ご要望にお応えできるように努力いたします。

このブログはあくまでも個人的な見解であり、投資判断は各自でお願い致します。当ブログは一切の投資損益に対する責任を負いません。

ホームページに来て下さってありがとうございます。明日もよろしくお願いいたします。

If you have some request to analyze, please write to “Contact Us”.

We do best effort for your request.

These are only personal opinions on this blog, and you need the investment judgment in each one. This blog doesn’t assume the responsibility to all the investment profit and loss.

Thank for watching our contents. My best regards next day.

© 2024 Retar