米ダウ工業株 : 美国道琼斯 : Dow Jones Industrial Average

米ダウ工業株・変化日2017/9/14、2017/9/27、2017/10/10・新高値をとれなければ天井感も・近づくトランプ相場“一環”/Dow Jones Industrial Average (^DJI) Daily; cannot take new high, collection may start; “IKKAN” of Trump rally is getting close. /美国道琼斯工业平均指数。“变化日”是2017年9月14号、2017年9月27号和2017年10月10号。特朗普拉力赛的一目均衡表的“一環”越来越近了。

2017/09/14

米ダウ工業株・変化日2017/9/14、2017/9/27、2017/10/10・新高値をとれなければ天井感も・近づくトランプ相場“一環”

Dow Jones Industrial Average (^DJI) Daily; cannot take new high, collection may start; “IKKAN” of Trump rally is getting close.

美国道琼斯工业平均指数。“变化日”是2017年9月14号、2017年9月27号和2017年10月10号。特朗普拉力赛的一目均衡表的“一環”越来越近了。


本日は米ダウ工業株日足についてです。

バブルなら、上昇に恐怖するものです。

結論は2017/9/14に新高値をとらなければ天井感も。9月末から10月はじめにかけ変化時間帯。

Today’s analyze is Dow Jones Industrial Average (^DJI) Daily.

When bubble comes true, rally often be fearful.

Our conclusion is if the price will take new high in 9/14/2017, collection may start and from end of this month to beginning of new month will be “HENKABI” zone.


日柄のレポートは復習つきで解説していきます。

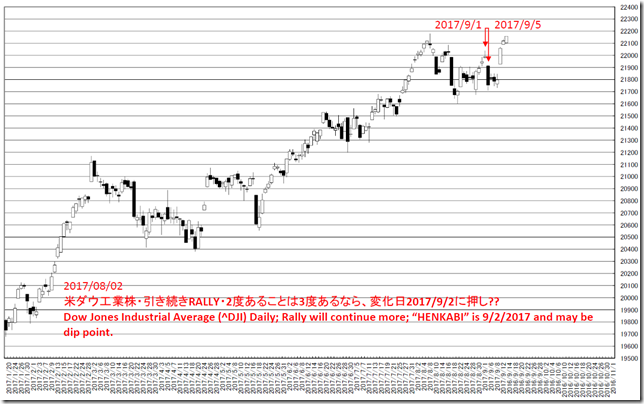
「米ダウ工業株・引き続きRALLY・2度あることは3度あるなら、変化日2017/9/2に押し??」(2017/08/02)

絶好の買い場でした。

We review our past “HIGARA” report in any time.

We reported “Dow Jones Industrial Average (^DJI) Daily; Rally will continue more; “HENKABI” is 9/2/2017 and may be dip point” in 8/2/2017.

This was perfect buying point.

chart1


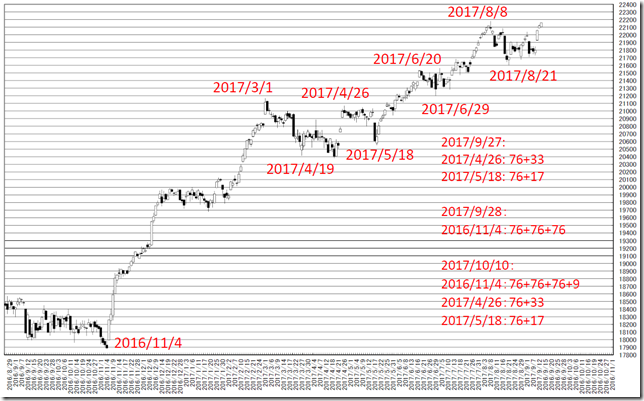
メジャーピークからの位置です。

2017/9/27、2017/9/28、2017/10/10に注目したいと思います。

特に月末はトランプ相場の「一環」。

This is from the major peaks.

Notable “HENKABI” are 9/27/2017, 9/28/2017 and 10/10/2017.

Especially end of this month is “IKKAN” of Trump rally.

chart2


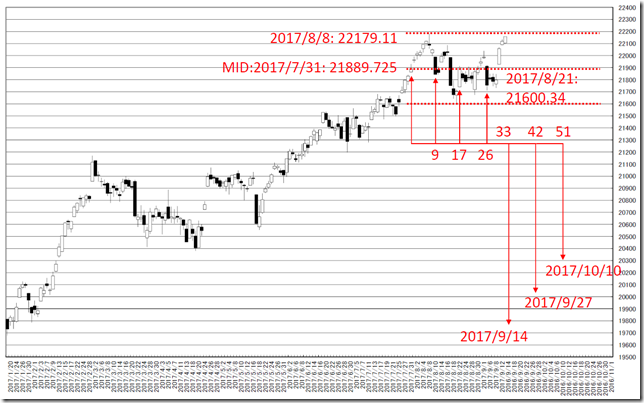
2017/7/31を基点とした持ち合いです。

9、17、26手で半値に関わる動きでした。

「結論は2017/9/28付近までは、強気相場継続??、2017/9/2に押し。」(2017/8/2)

2017/9/13に新高値とはなりませんでした。

2017/9/14は33手になりますが、2017/8/8高値を抜けなければ、持ち合いが確定します。

42手の2017/9/27、51手の2017/10/10なども注目の変化日であり、注視したい局面です。

This is steadiness from 7/31/2016.

9, 17 and 26 business days are related to the half price.

We reported “Our conclusion is rally may continue by 9/28/2017 around?? And 9/2/2017 may be dip point” in 8/2/2017.

But this market cannot take new high in 9/13/2017.

9/14/2017 is 33 business days and if the price cannot cut 8/8/2017 highest at this day, higher zone steadiness will confirm.

And we also need to watch 9/27/2017 and 10/10/2017. (42 and 51 business days)

chart3


相場分析のリクエストがありましたら“Contact Us”からお知らせください。ご要望にお応えできるように努力いたします。

このブログはあくまでも個人的な見解であり、投資判断は各自でお願い致します。当ブログは一切の投資損益に対する責任を負いません。

ホームページに来て下さってありがとうございます。明日もよろしくお願いいたします。

If you have some request to analyze, please write to “Contact Us”.

We do best effort for your request.

These are only personal opinions on this blog, and you need the investment judgment in each one. This blog doesn’t assume the responsibility to all the investment profit and loss.

Thank for watching our contents. My best regards next day.

如果您需要行情分析,请点击“Contact Us”联系我们。我们将尽力满足您的要求。

本博客仅为个人意见,请各自做出投资判断。本博客概不对任何投资盈亏负责。

感谢您访问本博客。欢迎再次使用。


米ダウ工業株・今月に入り過熱感、調整含み/Dow Jones Industrial Average (^DJI); the price gets into bubble zone. /美国道琼斯工业平均指数。价格进入泡沫区了。

2017/08/22

米ダウ工業株・今月に入り過熱感、調整含み

Dow Jones Industrial Average (^DJI); the price gets into bubble zone.

美国道琼斯工业平均指数。价格进入泡沫区了。


本日は米ダウ工業株についてです。

バブルなら、上昇に恐怖するものです。

結論は、現在は高値圏の売り時??

Today’s analyze is Dow Jones Industrial Average (^DJI).

When bubble comes true, rally often be fearful.

Our conclusion is the price is too high and now is the time to sell??


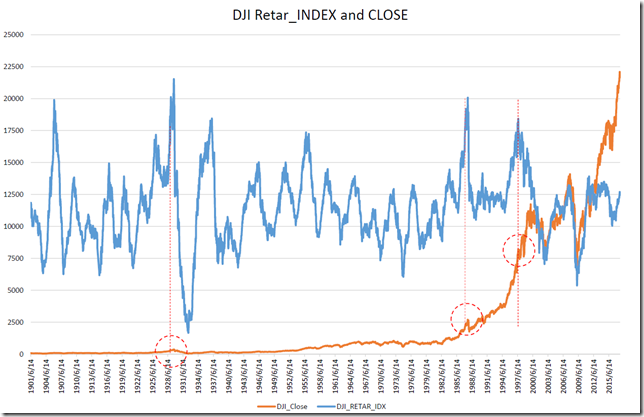
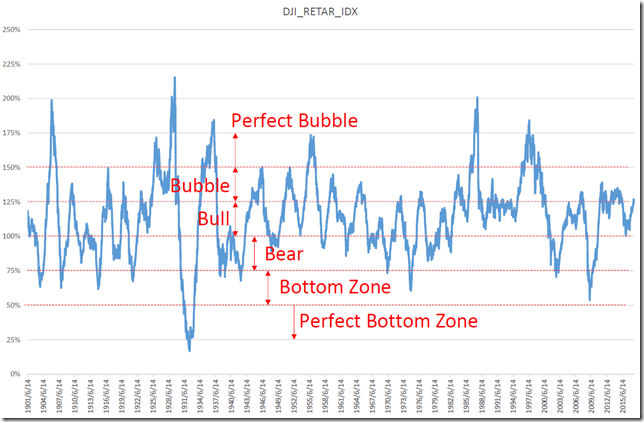
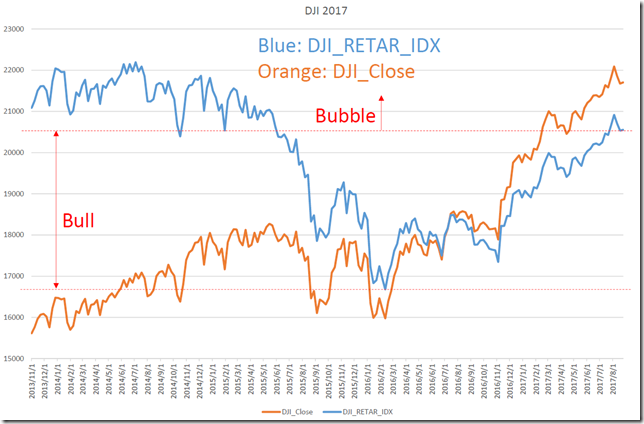
私たちの開発した「Retar INDEX」は、多用途の汎用INDEXですが、今回は相場の強気、弱気を表現しています。

Our “Retar INDEX” is multi-purpose index and in this case, we figure bull and bear condition.


米ダウ工業株は、絶好調に上げてきましたが、Retar INDEXでは、歴史的にさほど過熱感はありません。

8月に入り過熱感が出始めた程度です。

ITバブルのほうがバブル感はきつく、本格的なバブルはそれ以降発生していません。

しかし、例えば、2007年の場合はバブルゾーンから半年で弱気ゾーンへと転落しています。

DJI seems to be a big rally but our “Retar INDEX” does not see so in historically.

The price get into bubble zone just in August.

After “IT bubble”, there were no true bubble condition.

But for example, in 2007 case, the price fall from bubble zone to bear zone only in half year.

CHART1CHART2


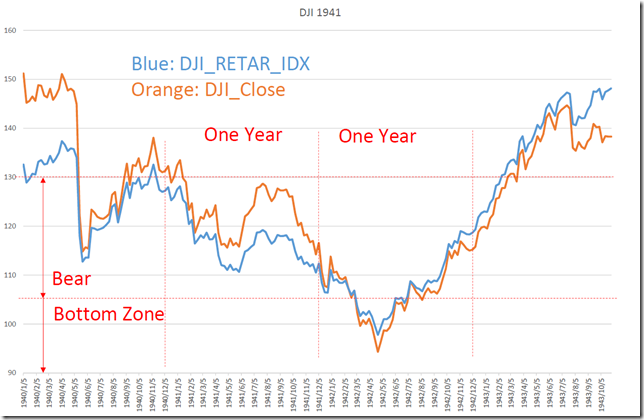
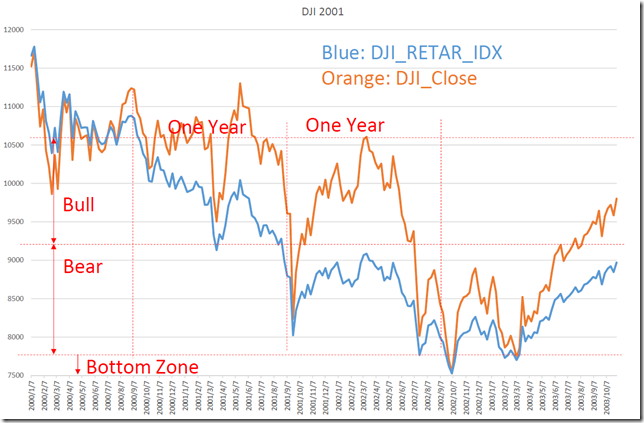
1941年と2001年の「米国が攻撃をうけた時」も考察します。

攻撃を受ける前はバブルゾーンを過ぎた強気ゾーンに入っています。

現在のようなバブルゾーンに入っている時とは異なります。

また、攻撃をうけた1年後は良い買い場を提供していた地点でした。

We analyze “U.S. was attacked” in 1941 and 2001.

Before attacking, the price got into bull zone after bubble zone.

This is not different to the latest condition; now is bubble zone.

And after one year “U.S. was attacked”, this zone provided buying opportunity.

194120012017


相場分析のリクエストがありましたら“Contact Us”からお知らせください。ご要望にお応えできるように努力いたします。

このブログはあくまでも個人的な見解であり、投資判断は各自でお願い致します。当ブログは一切の投資損益に対する責任を負いません。

ホームページに来て下さってありがとうございます。明日もよろしくお願いいたします。

If you have some request to analyze, please write to “Contact Us”.

We do best effort for your request.

These are only personal opinions on this blog, and you need the investment judgment in each one. This blog doesn’t assume the responsibility to all the investment profit and loss.

Thank for watching our contents. My best regards next day.

如果您需要行情分析,请点击“Contact Us”联系我们。我们将尽力满足您的要求。

本博客仅为个人意见,请各自做出投资判断。本博客概不对任何投资盈亏负责。

感谢您访问本博客。欢迎再次使用。

© 2025 Retar