米ダウ工業株 : 美国道琼斯 : Dow Jones Industrial Average

米ダウ工業株・トレンドライン・パターン通りなら13000ミドルを試すはず/Dow Jones Industrial Average (^DJI); trend line analysis; Following the past pattern, the price will reach 13000 point middle /美国道琼斯工业平均指数。趋势线分析。如果在过去的模式,就价格将达到13000点的中间。

2016/01/17

米ダウ工業株・トレンドライン・パターン通りなら13000ミドルを試すはず

Dow Jones Industrial Average (^DJI); trend line analysis; Following the past pattern, the price will reach 13000 point middle

美国道琼斯工业平均指数。趋势线分析。如果在过去的模式,就价格将达到13000点的中间。


トレンドラインの有効性とは、あらかじめ引いたトレンドラインが機能したかどうかを確認することです。

利いたかどうかは、過去の相場に平行線を引いてみて、同一角度のトレンドラインの有効性を検証します。

作業の積み重ねを通して、トレンドラインは確信へと変化します。

The efficiency of trend line is confirming the past market and how did it work.

You can draw same degree of the trend line on the chart and confirming the efficiency.

Drawing these lines, we can only make confidence.


本日は米ダウ工業株についてです。

Today’s analyze is Dow Jones Industrial Average (^DJI) Daily.


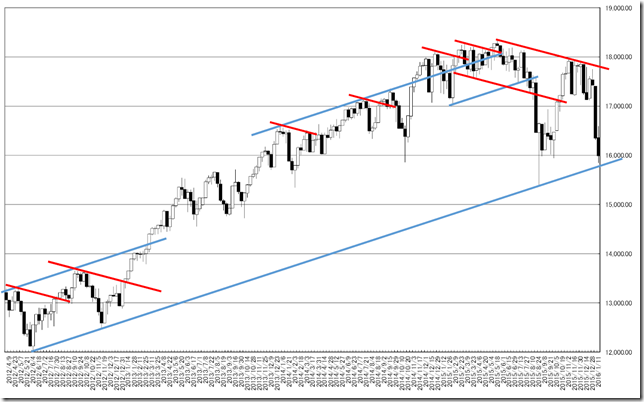
2015/09/16のレポートでは「結論は型的にベアマーケット入りを示唆しています」と報告しています。

2015/10/22のレポートでは「米ダウ工業株・トレンドライン分析・週足ベースでは皮一枚サポート割れせず」と報告しており、一応、反転を見せました。

しかし、現在は再び割り込みに向け挑戦中であることを報告したいと思います。

We reported “Our conclusion is this market seems to have already getting into bearish market” in 09/16/2015 report.

And we also reported “Dow Jones Industrial Average (^DJI); trend line analysis; the price does not cut the major support in weekly data” in 10/22/2015.

But now, the market price is challenging again.

WEEK


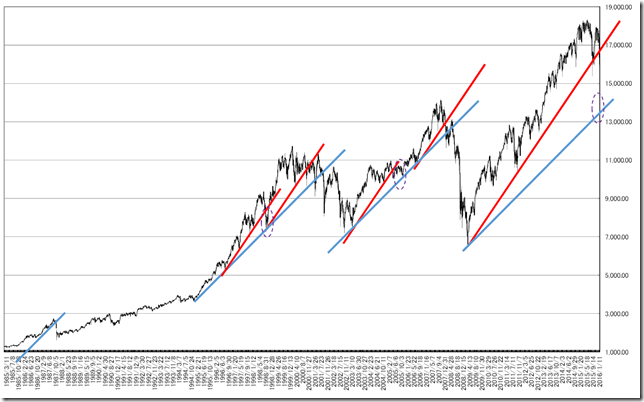
1985年以降のチャートです。

こうしてみると、たとえば1990年に株を買って黙って持っているだけで大変にHAPPYだったことがわかります。

それはさておき、急速な上昇がみられた局面は過去に2回ありました。

その中で、赤と青の関係に注目してみると、過去2回の局面では赤を割り込むと青にチャレンジする特性がみてとれます。

これを現在の相場に当てはめると、赤を割り込んだため、青に挑戦するのが筋となるため(紫地点)、13000ポイントミドルを試すと考えられます。

This is the weekly chart after 1985.

If we buy in 1990’s and hold, we become very happy now.

That aside, there were two big-bull phases in past market.

In these cases, we can see red and blue lines worked well and after cutting red line, the price challenged the blue line.

Applying this to the latest market, the market price cut the red line now and it will be natural to challenge the blue line (purple circle) and this is 13000 point middle.

LONGTERM


もしこのシナリオが実現して反転して、過去の相場を踏襲するならば、これから起きるのは大幅下落後の大幅高です。

この大幅高のターゲット計算はしませんが、相当なものであることは間違いないとみています。

この意味を考えてみたいと思います。

If this scenario will come true and follow the past market track, a big fall will come true and a big jump will start.

This will be a great big jump but what does it mean?


相場分析のリクエストがありましたら“Contact Us”からお知らせください。ご要望にお応えできるように努力いたします。

このブログはあくまでも個人的な見解であり、投資判断は各自でお願い致します。当ブログは一切の投資損益に対する責任を負いません。

ホームページに来て下さってありがとうございます。明日もよろしくお願いいたします。

If you have some request to analyze, please write to “Contact Us”.

We do best effort for your request.

These are only personal opinions on this blog, and you need the investment judgment in each one. This blog doesn’t assume the responsibility to all the investment profit and loss.

Thank for watching our contents. My best regards next day.

如果您需要行情分析,请点击“Contact Us”联系我们。我们将尽力满足您的要求。

本博客仅为个人意见,请各自做出投资判断。本博客概不对任何投资盈亏负责。

感谢您访问本博客。欢迎再次使用。


米ダウ工業株日足P&F・引け値の新高値が上昇トレンドのシグナルか?・メジャーサポートは16500ポイント/Dow Jones Industrial Average (^DJI) P&F Daily; New high in close price will be a start of bullish trend; the major support is 16500 point. /美国道琼斯工业平均指数。收盘价的新高价将是看涨的趋势开始。主要的支持是16500点。

2015/12/16

米ダウ工業株日足P&F・引け値の新高値が上昇トレンドのシグナルか?・メジャーサポートは16500ポイント

Dow Jones Industrial Average (^DJI) P&F Daily; New high in close price will be a start of bullish trend; the major support is 16500 point.

美国道琼斯工业平均指数。收盘价的新高价将是看涨的趋势开始。主要的支持是16500点。


本日は米ダウ工業株日足についてです。

結論は新高値をつけないかぎりベアマーケットラリー中。

Today’s analyze is Dow Jones Industrial Average (^DJI) Daily.

Our conclusion is now is bear market rally unless the market price will take new high.


2015/09/16に「米ダウ工業株日足P&F・2007年ピークアウトと現在の相場の共通点・大天井をつけている可能性あり」と報告しています。

既にベアマーケット入りしているのか、45度線割れがダマシであったのか試されています。

しかし、P&Fは間違わない点も強調しておきたいたいと思います。

We reported “Dow Jones Industrial Average (^DJI) P&F Daily; the similarity of 2007’s market and the latest market; this market seems to have already peaked out” in 09/16/2015.

Now is the time of junction peak the condition is bullish or bearish.

But we emphasize to say P&F chart does not wrong.


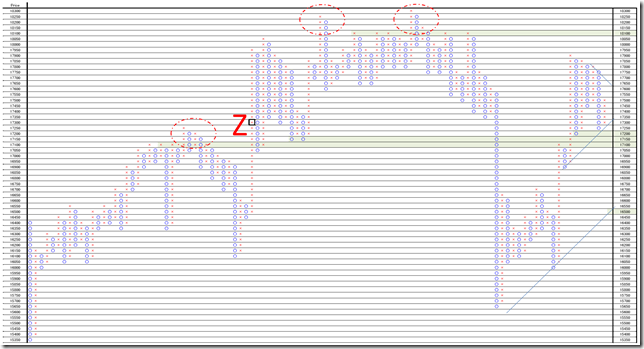
1枠50point、3枠転換の終値ポイントアンドフィギュアです。

新たな気づきがあったので紹介したいと思います。

注目は「Z」地点です。

フラットトップ臭いところから、少々の上値があった後、新高値をスパッととっています。

現在の相場も似たようなもので、更なる上昇となるためには終値がスパッと18300ポイントを超えていくようなイメージを持ちたいと思います。

一方、下方向をみていくとメジャーサポートは16500ポイントに位置しています。

この地点までは、押しの可能性があります。

This is 50point change and 3 box reversal close price’s Point and Figure chart.

We find out new object.

The notable point is “Z” point.

After taking flat top, the price took some new high and jump.

Now is similar to “Z” point condition and if it will be a new rally, the price will take clear new high.

On the other hand, the major support exists 16500 point around.

And a big dip may be this zone around.

PF


相場分析のリクエストがありましたら“Contact Us”からお知らせください。ご要望にお応えできるように努力いたします。

このブログはあくまでも個人的な見解であり、投資判断は各自でお願い致します。当ブログは一切の投資損益に対する責任を負いません。

ホームページに来て下さってありがとうございます。明日もよろしくお願いいたします。

If you have some request to analyze, please write to “Contact Us”.

We do best effort for your request.

These are only personal opinions on this blog, and you need the investment judgment in each one. This blog doesn’t assume the responsibility to all the investment profit and loss.

Thank for watching our contents. My best regards next day.

如果您需要行情分析,请点击“Contact Us”联系我们。我们将尽力满足您的要求。

本博客仅为个人意见,请各自做出投资判断。本博客概不对任何投资盈亏负责。

感谢您访问本博客。欢迎再次使用。

© 2025 Retar