米ダウ工業株 : 美国道琼斯 : Dow Jones Industrial Average

米ダウ工業株日足P&F・今はHAPPYでも慢心に注意/Dow Jones Industrial Average (^DJI) P&F Daily. Now may be happy but don’t be so conceited. /美国道琼斯工业平均指数。P&F分析。现在可能会很乐意,但不要太自高自大。

2015/04/16

米ダウ工業株日足P&F・今はHAPPYでも慢心に注意

Dow Jones Industrial Average (^DJI) P&F Daily. Now may be happy but don’t be so conceited.

美国道琼斯工业平均指数。P&F分析。现在可能会很乐意,但不要太自高自大。


本日は米ダウ工業株日足についてです。

Today’s analyze is Dow Jones Industrial Average (^DJI) Daily.


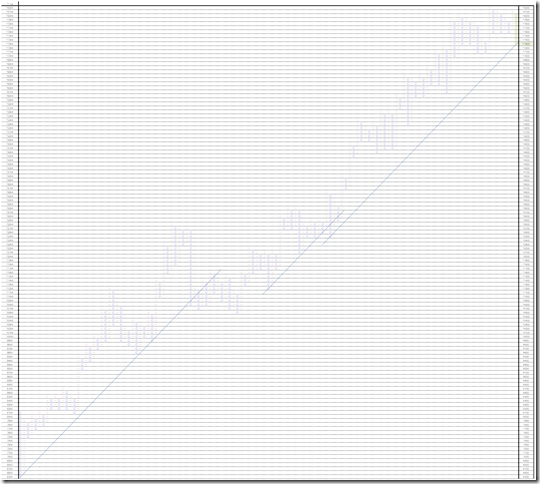
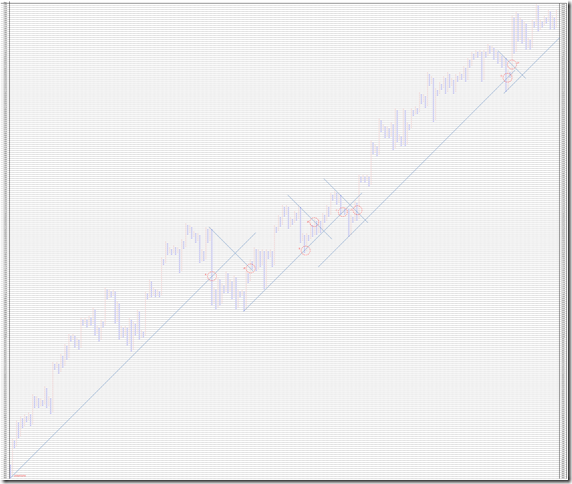
1枠50point、3枠転換の終値ポイントアンドフィギュアです。

2009年3月からの45度前割れは現在まで4回発生しています。

押しだったことの確認は「ダッシュ」部分でレジスタンスを超えてくる地点から確認できます。

現在の相場もレジスタンスD’を超えて来ているため、強気相場が継続しているとみてまちがいありません。

This is 50point change and 3 box reversal close price’s Point and Figure chart.

There exists 4 times cutting 45 degree support line from 03/2009.

We can confirm the dip by “DASH” points; cutting 45 degree resistance.

So now still keep bull trend because the market price had already cut 45 degree resistance D’.


しかし、考えてみると、2009年3月以降、45度を割れたら買いを入れれば大成功できました。

メジャーな45度線を4度も割り込み復活しているというのは、本当に強烈な上げ相場です。

私たちは過去にも、2014/11/04に「米ダウ工業株週足・トレンドライン分析・「割れ」を甘く見てはいけない」、 2011/08/17 に「米ダウ工業株日足・トレンドに変化」などを紹介してきました。

やはり、45度線を切れば警戒するのが基本です。

今後ともダマシはあっても、慢心することなく相場に臨みたいと思います。

But we can know when the market price cut the 45 degree support and bought, this was a great success.

The market price cut 45 degree support 4 times and recover; this is too strong market trend.

We reported “Dow Jones Industrial Average (^DJI) weekly; Trend line analysis; We can know the “Cutting” meaning in future” (11/04/2014) and “Dow Jones Industrial Average (^DJI) Daily. The market trend has changed” (08/17/2011).

And P&F basic is “Cutting 45 degree means very important”.

Using P&F, sometimes causes fake but don’t be so conceited.

pf


1枠100point、3枠転換の終値ポイントアンドフィギュアです。

この相場の崩れは、こちらのチャートの方が向いているようです。

現在のサポートは17300ポイントです。

こちらのほうが、ダマシが少ないようです。

This is 100point change and 3 box reversal close price’s Point and Figure chart.

We think the true falling will obvious appear in this P&F.

The latest support is 17300 point around.

The fake points will be fewer than 50 points P&F.

100


相場分析のリクエストがありましたら“Contact Us”からお知らせください。ご要望にお応えできるように努力いたします。

このブログはあくまでも個人的な見解であり、投資判断は各自でお願い致します。当ブログは一切の投資損益に対する責任を負いません。

ホームページに来て下さってありがとうございます。明日もよろしくお願いいたします。

If you have some request to analyze, please write to “Contact Us”.

We do best effort for your request.

These are only personal opinions on this blog, and you need the investment judgment in each one. This blog doesn’t assume the responsibility to all the investment profit and loss.

Thank for watching our contents. My best regards next day.

如果您需要行情分析,请点击“Contact Us”联系我们。我们将尽力满足您的要求。

本博客仅为个人意见,请各自做出投资判断。本博客概不对任何投资盈亏负责。

感谢您访问本博客。欢迎再次使用。


米ダウ工業株週足・5月上旬に変化時間帯/ Dow Jones Industrial Average (^DJI) weekly; Start of May will be “HENKABI” Zone. /美国道琼斯工业平均指数。5月上旬将是“変化日”时区的。

2015/04/11

米ダウ工業株週足・5月上旬に変化時間帯

Dow Jones Industrial Average (^DJI) weekly; Start of May will be “HENKABI” Zone.

美国道琼斯工业平均指数。5月上旬将是“変化日”时区的。


本日は米ダウ工業株日足についてです。

Today’s analyze is Dow Jones Industrial Average (^DJI) daily.


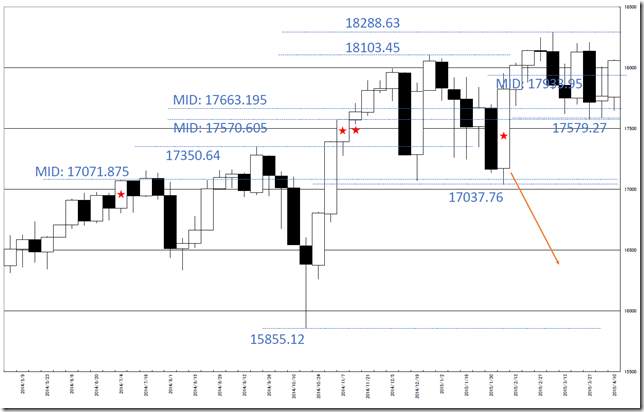
2015/01/30のレポートでは「米ダウ工業株日足・下離れの可能性あり・17067.59ポイント割れを試す」ことを想定していました。

17037.76ポイントまで一瞬下げた後、2月からベアマーケット入りも覚悟していましたが(オレンジ)、カブセとなり急速な回復となりました。

ベアマーケット入りしていないようなので、仕切り直しが必要です。

We reported “Dow Jones Industrial Average (^DJI) daily; now seems to be down side breaking; the price will try 17067.59point cutting” in 01/30/2015.

The market price reached 17037.76point and this seemed to start bear market but it did not become so. (Orange)

This market did not become bear market and we need to change our thinking.

chart1


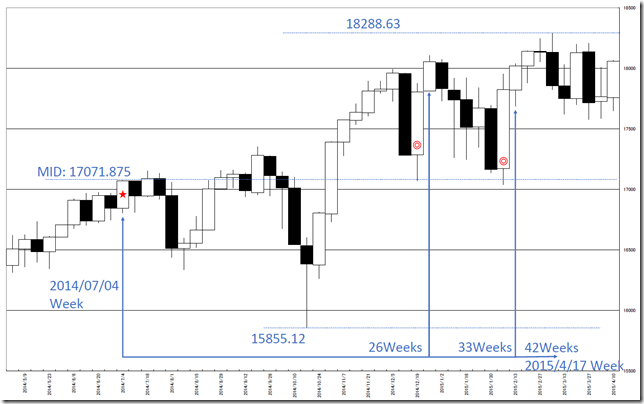
現在の相場は2015/03/06の週に新高値をとっている点がポイントです。

最もメジャーな持ち合いは2014/07/04の週を基点とした持ち合いです。

17071.875ポイントが中間値となっており、25営業日、32営業日でサポートされています。(二重丸)

今後も17000ポイントがサポートになりそうです。

The best important is the market price took new high in 03/06/2015.

The major steadiness starts in 07/04/2014.

And the half price is 17071.875 point and worked in 25 business weeks and 32 business weeks. (Double circle)

And 17000 point will work as support.

chart2


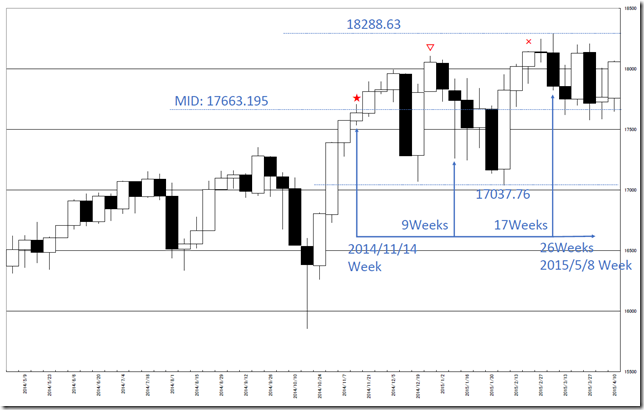
むしろレンジを切り替えて持ち合いになったと見るべき局面です。

現在の相場は2014/11/14の週を基点、半値17663.195ポイントがメジャーです。

終値でみると×から▽まで9週です。

新高値からの9週は2015/05/01の週。

また、持ち合い起点からの26週が2015/05/08の週。

5月上旬に変化時間帯になりそうです。

Rather than, the market become steadiness after changing the price range.

The start of the steadiness is 11/14/2014 and the half price is 17663.195point.

It took 9 business days from x-mark to white down-pointing triangle.

The 9 business weeks from the new high is 05/08/2015 week.

And the 26 business weeks from the start of the steadiness will be 05/08/2015 week.

Start of the May will be “HENKABI” zone.

chart3


相場分析のリクエストがありましたら“Contact Us”からお知らせください。ご要望にお応えできるように努力いたします。

このブログはあくまでも個人的な見解であり、投資判断は各自でお願い致します。当ブログは一切の投資損益に対する責任を負いません。

ホームページに来て下さってありがとうございます。明日もよろしくお願いいたします。

If you have some request to analyze, please write to “Contact Us”.

We do best effort for your request.

These are only personal opinions on this blog, and you need the investment judgment in each one. This blog doesn’t assume the responsibility to all the investment profit and loss.

Thank for watching our contents. My best regards next day.

如果您需要行情分析,请点击“Contact Us”联系我们。我们将尽力满足您的要求。

本博客仅为个人意见,请各自做出投资判断。本博客概不对任何投资盈亏负责。

感谢您访问本博客。欢迎再次使用。

© 2025 Retar