米ダウ工業株 : 美国道琼斯 : Dow Jones Industrial Average

米ダウ工業株週足・1998年とは日柄的には似てないと感じました/Dow Jones Industrial Average (^DJI) Daily. Comparing 1998, we feel there is no similarity from “HIGARA” point of view.

2011/11/04

本日は米ダウ工業株週足についてです。

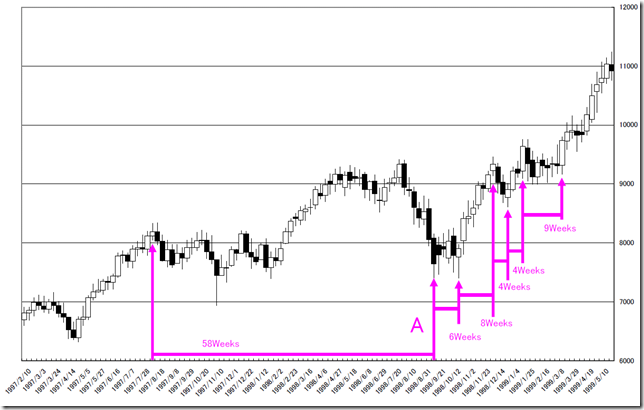
1998年相場と最近の相場を比較しました。

今週の日経ヴェリタス59ページ「米バロンズから」では1998年の相場と現在の相場の類似性が指摘されています。

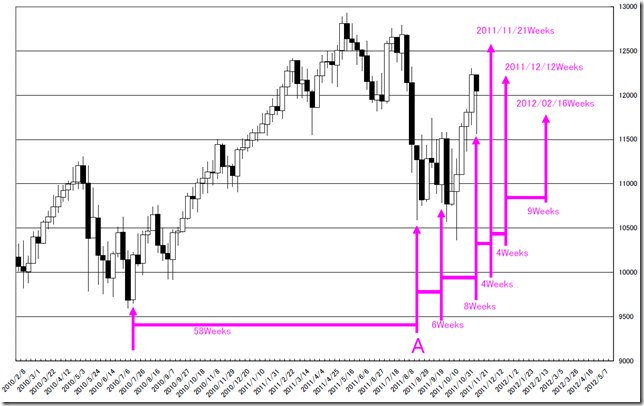
山から山、谷から谷の間の日柄に共通点が少ないと感じました。

今回の相場はA点(2011/08/08週)から9週目(2011/10/03週)に底割れしていることを考慮すると週ベースの変化日ではないと考えています。

Today’s analyze is Dow Jones Industrial Average (^DJI) weekly data.

Today, we compare the 1998 market and the recent market.

This week NIKKEI Veritas 59 page article “BARRON’S” points out the similarity of the market as 1998.

Comparing 1998, we feel there is no similarity from “HIGARA” point of view; the peak to peak and the bottom to bottom “HIGARA” do not have similarity.

And the recent market, the market price cuts “A” point (08/08/2011 week) at ninth week (10/03/2011 week).

The conclusion, we think the recent market “HIGARA” does not resemble 1998 “HIGARA”.

1998

2011


相場分析のリクエストがありましたら“Contact Us”からお知らせください。ご要望にお応えできるように努力いたします。

このブログはあくまでも個人的な見解であり、投資判断は各自でお願い致します。当ブログは一切の投資損益に対する責任を負いません。

ホームページに来て下さってありがとうございます。明日もよろしくお願いいたします。

If you have some request to analyze, please write to “Contact Us”.

We do best effort for your request.

These are only personal opinions on this blog, and you need the investment judgment in each one. This blog doesn’t assume the responsibility to all the investment profit and loss.

Thank for watching our contents. My best regards next day.


価格比較の罠/ The trap of comparing the price.

2011/10/23

本日は分析手法について考えてみます。

Today, we consider the analyzing way.


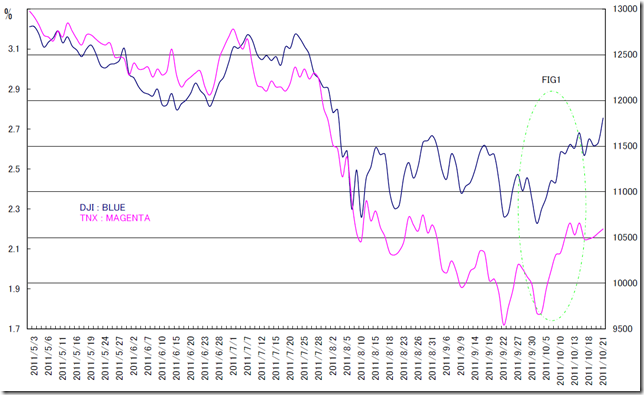
チャートは2011/05/02から2011/10/21までの米10年債金利と米ダウ工業株を比較しています。

FIG1部分に着目しますと、FIG1の解釈には、「金利の上げは小さいのに株式の上昇率が大きい」という見解になると思います。

We compare the CBOE Interest Rate 10-Year T-No (Chicago Options: ^TNX) and Dow Jones Industrial Average (^DJI) data from 05/02/2011 to 10/21/2011.

When we focus on FIG.1, we can explain “the interest rise is small and the stock rise is bigger”.

N1


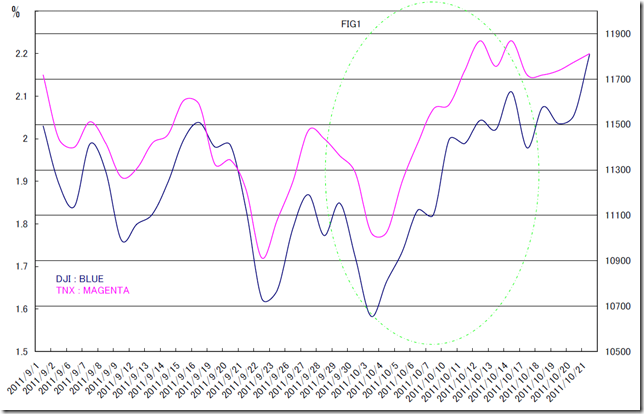
次にFIG1の期間を2011/09/01から2011/10/21までのチャートに書き改めます。

米10年債金利と米ダウ工業株の価格追随性がよくわかるように書き改めることができます。

Next, we redraw the chart changing the term from 09/01/2011 to 10/21/2011.

We can confirm a high correlation between CBOE Interest Rate 10-Year T-No (Chicago Options: ^TNX) and Dow Jones Industrial Average (^DJI).

N2


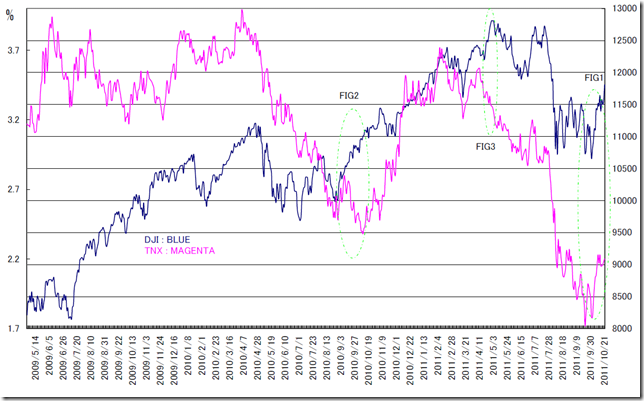
今度は、期間を2009/05/01から2011/10/21までの期間に書き改めてみます。このチャートからわかることは「2009年代では金利が3%台なのに、9000ドル、現在は金利が2%なのに11500ドル」。

得られる見解は、「ダウはもっと下げても良い」か「金利がもっと上昇してもよい」ということになると思います。

更にFIG2,FIG3のように金利は低下しているのに、ダウは上昇している局面もあるわけです。

Next, we redraw the chart from 05/01/2009 to 10/21/2011.

We can find out “In 2009, the interest is 3 point around and the stock is 9000 point. The latest, the interest is 2 point around and the stock is 11500 point.”

So we can say the conclusion “The stock should go down side.” or “The interest should do upper side.”

Further, FIG2 and FIG3 situation are opposite correction.


N3


一般的には株価と金利には相関関係あるように言われています。

しかし、過去には相関関係のなかった時期もあります。(FIG.2 FIG.3参照)

見方によっては、どのようにでも解釈できてしまうので、前提条件や期間などを明示するべきだと考えております。

Generally, there is a relationship between the stock and the interest.

But there are opposite correlation in the past.

Depending on a view, we can interpret as we like.

We think a precondition, a period, etc. should be specified.


相場分析のリクエストがありましたら“Contact Us”からお知らせください。ご要望にお応えできるように努力いたします。

このブログはあくまでも個人的な見解であり、投資判断は各自でお願い致します。当ブログは一切の投資損益に対する責任を負いません。

ホームページに来て下さってありがとうございます。明日もよろしくお願いいたします。

If you have some request to analyze, please write to “Contact Us”.

We do best effort for your request.

These are only personal opinions on this blog, and you need the investment judgment in each one. This blog doesn’t assume the responsibility to all the investment profit and loss.

Thank for watching our contents. My best regards next day.

© 2025 Retar