上海総合指数週足・バブル崩壊後にどうなったか?(7)・再下落開始は6月か9月
SSE Composite Index (Shanghai: 000001.SS) Weekly (7); re-fall will start June or September.
上证指数。泡沫破裂后,变成了怎样?第7部。重新下跌将起动6月还是9月。
本日は上海総合指数週足です。
2015/07/19と2015/10/06と2015/10/29と2015/11/28と2016/1/29と2016/03/30のレポートでは「上海総合指数週足・バブル崩壊後にどうなったか?・日経、ダウ工業株と比較」について紹介しました。
本日はその後の様子について報告します。
Today’s analyze is SSE Composite Index weekly data.
We reported “SSE Composite Index (Shanghai: 000001.SS) Weekly; After Bubble Burst, what it would be?; Comparing N225 and DJI” in 07/19/2015, 10/06/2015, 10/29/2015, 11/28/2015, 1/29/2016 and 03/30/2016.
Today, we introduce what happened after that.
2015/07/19のレポートでは以下のように報告しています。
2. 35~45週の下げ
アヤ戻しからの下げ地点です。
しかし、これでは許してもらえません。
上海の相場に当てはめると、2016年2月上旬から2016年4月中旬です。
ぴったりカンカンの動きでしたが、過去のバブルの特徴と照らし合わせただけです。
導き出される考察として、値動きが過去の日柄をなぞるのは、中国経済のバブルが崩壊した証拠となります。
We reported under these in 07/19/2015.
2. The fall of from 35 to 45 weeks
This is after technical rally and fall.
But this is not the major bottom.
Applying Shanghai market, this will be from the beginning of February, 2016 to the middle of April, 2016.
This was the proper report but we only apply the past market price movement.
We can conclude Chinese bubble has already busted because the price followed the past market price movement.
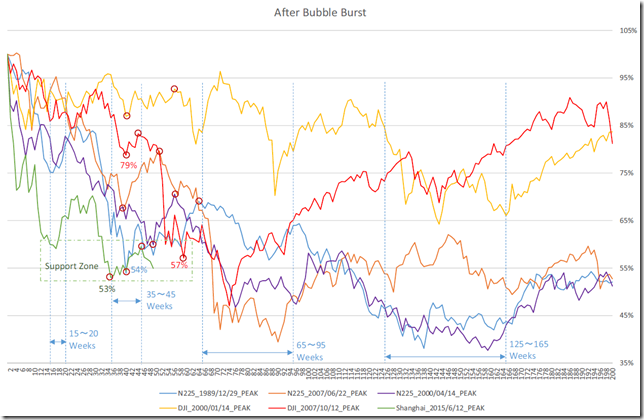
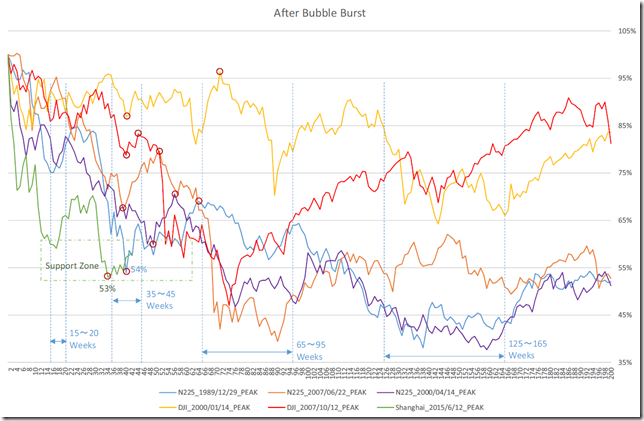
上海総合指数のチャートから考察できる重要ポイントは、戻りが悪い点です。
2016/03/30のレポートでは、終値ベースの戻りの期待値は、-1σが3019ポイント、AVが3175ポイントと想定しており、実際の戻り高値は3078.12ポイントでした。
値幅的には、上海総合指数は2700ポイント台を底として、反転していますが、35、36、38週と2700ポイント台を維持したため、なかなか浮上できずにいました。
日経平均は頂点から41週の1990年10月初旬に20000円割れをみて反転していきました。
上海市場の節は3000ポイントであり、3000ポイントをこえて越週できたのは43週と45週のみでした。
3000ポイントはレジスタンスであり、この先の「山高く谷深し」を暗示する可能性があります。
We can know Shanghai market recovery is worst.
In 03/30/3016, the expected recovery price (Close price based) are -1 sigma is 3019point and AV is 3175 point and actual recovery price was 3078.12point.
From the price range view, Shanghai market was supported 2700 point around and took 2700 point around in 35, 26 and 38 week.
N225 in 1990, the price cut 20000yen at41 week (Beginning of October 1990) and reversed.
In Shanghai market, convenient number is 3000 point and cutting over this number was 43 and 45 week.
3000 point seems to be the resistance point and this market may imply a future mess.
もう一点気になる動きがあります。
2007年のダウ工業株です。(赤線)
ダウ工業株の場合は、35-45週はおとなしい動きとなりましたが、ここから一気に下値を探りだしました。
40週でつけた安値を一目数字の51週に同値、52週に割り込んでいきました。
上海総合指数に当てはめると5月最終週(51週)から、6月第1週(52週)になります。
2007年のダウ工業株は59週で57%まで落ちていますが、既に上海総合指数は、同じような値幅まで落ちているため、今のところ再下落は考えにくいとみています。
しかし、相場は相場なので、更なる加速的な下落も考慮する必要があります。
The other notable point is DJI in 2007. (Red line)
In DJI, the market price was calm from 35 weeks to 45 weeks but it felled after that.
The market price cut 40 week’s low price in 51 week and 52 week.
Applying to Shanghai market, this will be from the end of May to the beginning of June.
DJI in 2007 felled 57% in 59 week but Shanghai market has already dropped similar zone; it seems to be difficult fall more.
But we cannot say true future and the price may fall more.
メインシナリオは、既に2番底をつけており、9月上旬まではまちまちの持ち合い相場とみるのがファーストシナリオです。
しかしながら、値もちしなければ、6月からの爆発的な下げがある可能性も否定できません。
Our main scenario is steadiness will continue at the beginning of September and the major bottom has already taken.
But cannot keep the price, a big fall may come in June.
相場分析のリクエストがありましたら“Contact Us”からお知らせください。ご要望にお応えできるように努力いたします。
このブログはあくまでも個人的な見解であり、投資判断は各自でお願い致します。当ブログは一切の投資損益に対する責任を負いません。
ホームページに来て下さってありがとうございます。明日もよろしくお願いいたします。
If you have some request to analyze, please write to “Contact Us”.
We do best effort for your request.
These are only personal opinions on this blog, and you need the investment judgment in each one. This blog doesn’t assume the responsibility to all the investment profit and loss.
Thank for watching our contents. My best regards next day.
如果您需要行情分析,请点击“Contact Us”联系我们。我们将尽力满足您的要求。
本博客仅为个人意见,请各自做出投资判断。本博客概不对任何投资盈亏负责。
感谢您访问本博客。欢迎再次使用。


