バルチック海運指数 : 波罗的海指数 : Baltic Dry Index Daily

バルチック海運指数日足・しばらく上値は重い/Baltic Dry Index Daily. Down side break. We think the market may be bearish for some time.

2012/04/04

本日はバルチック海運指数日足を分析しました。

Today’s analyze is Baltic Dry Index Daily.


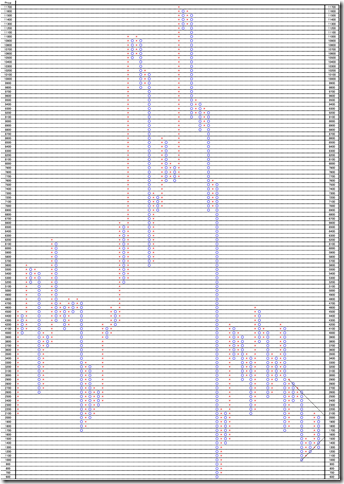
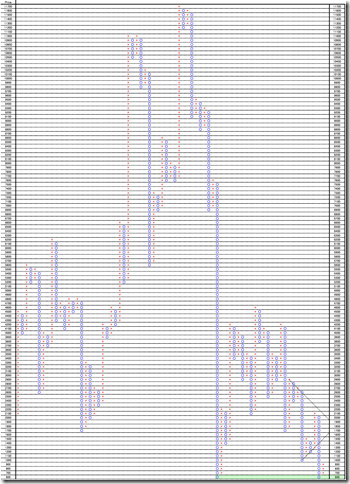
1枠100pt、3枠転換の終値ポイントアンドフィギュアです。

2003年5月から本日までのデータで作成しています。

600ポイントでダブルボトムを打ちました。

しかし、ペナントの下抜け型であるため、しばらく値固めしないと、上昇できないと考えられます。

This is 100pt change and 3 box reversal close price’s Point and Figure chart.

We plot it from 05/2003 to today’s data.

The market price took double dip at 600 point around.

And this fall was the breaking from the pennant formation; we think the market price may stay there around for some time.

PF


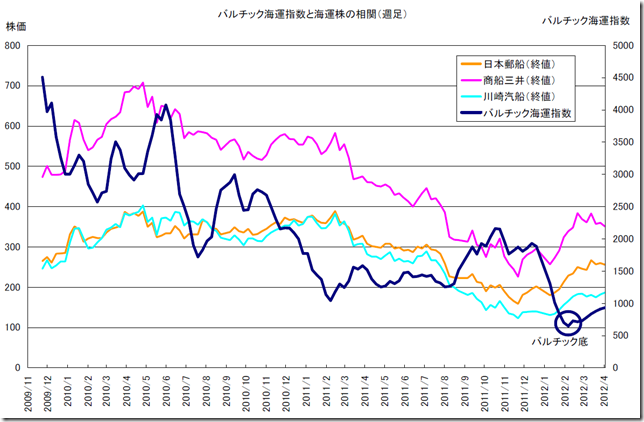
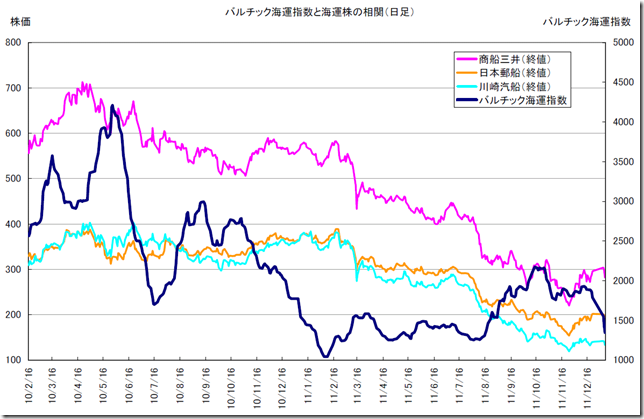
前回のレポート(2012/01/10)では、バルチック海運指数底入れ後の3-4か月後に船株が底入れしているようであるということを述べました。

この経験則を当てはめるなら、今回のバルチック海運指数の大底は2012/02/03となり、これに相関する船株の底が5月上旬から6月上旬にかけてやってくるのではないかと想定されます。

We reported in 01/10/2012 “There needs 3 to 4 months taking the ships stock bottom after Baltic Dry Index took the bottom.”

Applying this experience, the recent bottom was 02/03/2012 and this bottom effects from the beginning of May to the beginning of June ships stock bottom.

STOCK


相場分析のリクエストがありましたら“Contact Us”からお知らせください。ご要望にお応えできるように努力いたします。

このブログはあくまでも個人的な見解であり、投資判断は各自でお願い致します。当ブログは一切の投資損益に対する責任を負いません。

ホームページに来て下さってありがとうございます。明日もよろしくお願いいたします。

If you have some request to analyze, please write to “Contact Us”.

We do best effort for your request.

These are only personal opinions on this blog, and you need the investment judgment in each one. This blog doesn’t assume the responsibility to all the investment profit and loss.

Thank for watching our contents. My best regards next day.


バルチック海運指数日足・下方ブレーク。ターゲット1200-1000ポイント/Baltic Dry Index Daily. Down side break. The target may be 1200-1000point.

2012/01/10

本日はバルチック海運指数日足を分析しました。

Today’s analyze is Baltic Dry Index Daily.


1枠100pt、3枠転換の終値ポイントアンドフィギュアです。

2003年5月から本日までのデータで作成しています。

45度線を下方に割り込みました。

ターゲットとしては、①1200ポイントまたは1000ポイント付近でボトムをとるか、②600ポイントまでの下落まで下げるのかを想定しなくてはいけないと思います。

上昇反転は3枠転換で1600ポイント以上を回復することです。

This is 100pt change and 3 box reversal close price’s Point and Figure chart.

We plot it from 05/2003 to today’s data.

The market price cuts 45 degree resistance line.

We can consider the target price is 1200point, 1000point and 600point.

The upper side breaking is the market price goes over 1600 point; this is 3 frame conversion.

PF


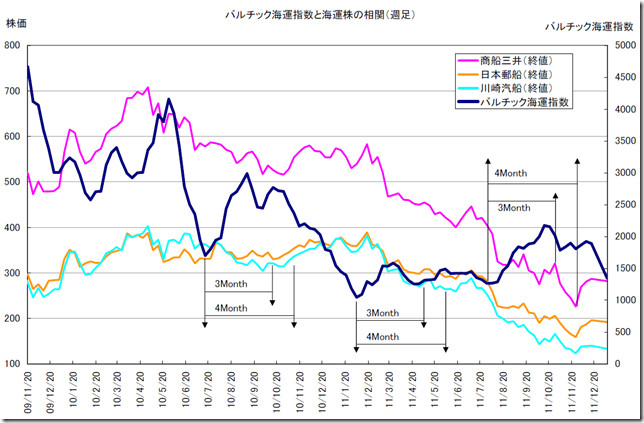
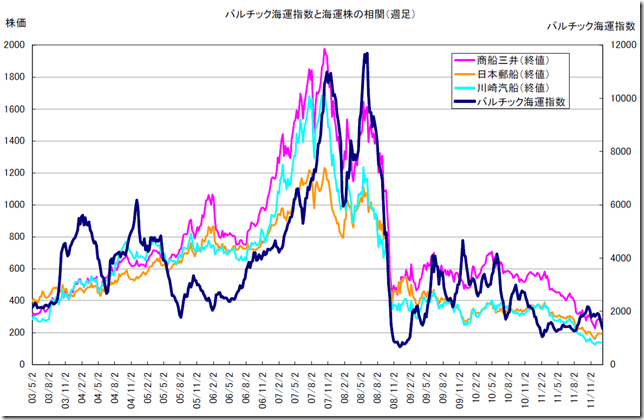
船株とバルチック海運指数の相関も作成してみました。

2009年11月20日の高値からの最近までの動きの特徴は、バルチック海運指数が底入れ後、3-4ケ月経って船株が底入れすることがわかります。

トレード戦略としては、たとえば、バルチック海運指数の底入れ確認の後SHORT、バルチック海運指数の底から3-4ケ月後にドテンし利食いする戦略が考えられます。

We compare Japanese ship stock and Baltic Dry Index and made some chart.

The unique character from 11/20/2009 high to the recent market is there needs 3 to 4 months taking the bottom after Baltic Dry Index take the bottom.

If we consider a trading tactics, for example, when we confirm Baltic Dry Index take the bottom, we may take a short position.

And after 3 to 4 months from the Baltic Dry Index bottom, we may close the short position and take a long position.

SHORT_WEEK

LONG_WEEK

DAY


相場分析のリクエストがありましたら“Contact Us”からお知らせください。ご要望にお応えできるように努力いたします。

このブログはあくまでも個人的な見解であり、投資判断は各自でお願い致します。当ブログは一切の投資損益に対する責任を負いません。

ホームページに来て下さってありがとうございます。明日もよろしくお願いいたします。

If you have some request to analyze, please write to “Contact Us”.

We do best effort for your request.

These are only personal opinions on this blog, and you need the investment judgment in each one. This blog doesn’t assume the responsibility to all the investment profit and loss.

Thank for watching our contents. My best regards next day.

© 2024 Retar