NY金 : 纽约黄金 : NY GOLD

NY GOLD日足・2013/05/13、2013/06/13変化日・変化日アルゴリズム検出/NY GOLD daily; 05/13/2013 and 06/13/2013 will be “HENKABI”; Automated “HEKABI” extract algorism. /纽约黄金。用算法查出变化日。“变化日” 是2013年5月13日与2013年6月13日。

2013/04/25

NY GOLD日足・2013/05/13、2013/06/13変化日・変化日アルゴリズム検出

NY GOLD daily; 05/13/2013 and 06/13/2013 will be “HENKABI”; Automated “HEKABI” extract algorism.

纽约黄金。用算法查出变化日。“变化日” 是2013年5月13日与2013年6月13日。


本日は東京マーケット円建て銀日足についてです。

私たちは変化日を求めるためのアルゴリズムを研究しています。

最新アルゴリズムの信頼性が高まってきたため、本日は紹介したいと思います。

Today’s analyze is about Tokyo market silver calculated in yen (Daily Data).

We develop the new type of algorism seeking for “HENKABI” (Based on “ICHIMOKU” method).

Since the reliability of the newest algorithm has increased, we would like to introduce today.

And we started the development of the parallel computing system applying this algorithm.

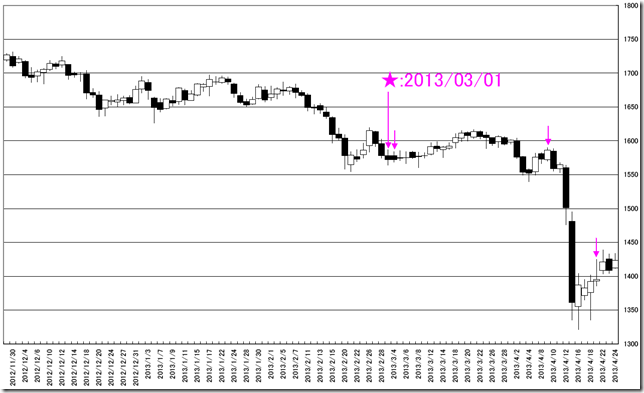
時計を2013/03/01に戻します。

2013/03/01時点の値動きを使用して、最新のアルゴリズムで求められた変化日がピンク色です。今回の崩れの初動を捉えていると思います。

We back to the past (03/01/2013) and analyze.

Pink arrow is “HENKABI” point. (With out star point)

This system can take the starting of the latest fall.

CHART


最新のアルゴリズムで、本日までのデータを使用して、求めた変化日は2013/05/13、2013/06/13となります。

We apply our latest algorism and draw the “HENKABI”; 05/13/2013 and 06/13/2013.

相場分析のリクエストがありましたら“Contact Us”からお知らせください。ご要望にお応えできるように努力いたします。

このブログはあくまでも個人的な見解であり、投資判断は各自でお願い致します。当ブログは一切の投資損益に対する責任を負いません。

ホームページに来て下さってありがとうございます。明日もよろしくお願いいたします。

If you have some request to analyze, please write to “Contact Us”.

We do best effort for your request.

These are only personal opinions on this blog, and you need the investment judgment in each one. This blog doesn’t assume the responsibility to all the investment profit and loss.

Thank for watching our contents. My best regards next day.


NY GOLD週足・トレンドライン分析/NY GOLD weekly; trend line analysis. /纽约黄金。趋势线分析。

2013/04/15

NY GOLD週足・トレンドライン分析

NY GOLD weekly; trend line analysis.

纽约黄金。趋势线分析。


本日はNYGOLD週足についてです。

Today’s analyze is NY GOLD weekly.

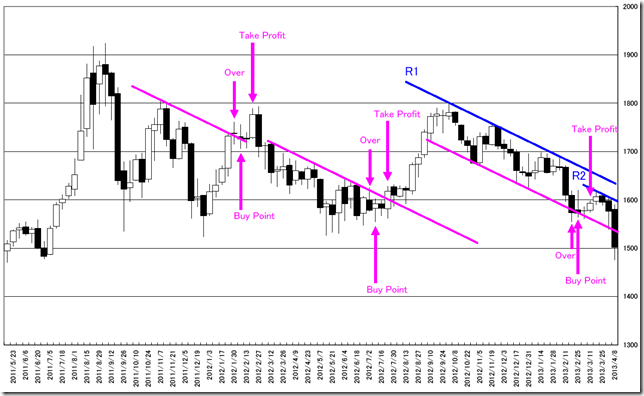
トレンドラインベースで面白い発見をしたので、紹介します。

同一の角度と太さで引かれたピンクのトレンドラインに注目してみてください。

1. 最初にトレンドラインを超えた(Over)

2. 翌週の寄り付きで買う(Buy Point)

3. 2週後の終値で利益確定(Take Profit)

タラレバのトレードですが、一定の規則があることがわかります。

大事なことは、この角度のラインに意味があることです。

R1,R2(青)も同じ角度のラインとなっており、今後の相場反転のシグナルになりうるラインです。

現在のR2は1600ポイント超え。

このラインを超えてくると、弱気はおしまいとみています。

We found out unique trend line character.

See pink lines; these are same degree and thickness.

1. The first point cut over the trend line. (Over)

2. Buy in the next week open. (Buy Point)

3. After 2 weeks, taking profit at close. (Take Profit)

This is only an assumption and there is a good rule.

The important thing is the same degree lines are meaningful.

R1 and R2 (Blue) resistance lines are same degree and cutting this line will be the trend changing.

The latest R2 line is 1600 point around.

If the market price will cut this line, the bear trend will end.

CHART


相場分析のリクエストがありましたら“Contact Us”からお知らせください。ご要望にお応えできるように努力いたします。

このブログはあくまでも個人的な見解であり、投資判断は各自でお願い致します。当ブログは一切の投資損益に対する責任を負いません。

ホームページに来て下さってありがとうございます。明日もよろしくお願いいたします。

If you have some request to analyze, please write to “Contact Us”.

We do best effort for your request.

These are only personal opinions on this blog, and you need the investment judgment in each one. This blog doesn’t assume the responsibility to all the investment profit and loss.

Thank for watching our contents. My best regards next day.

© 2025 Retar