S&P500 : 标普500指数

ジム・ロジャースさんは「2013年はおそらく最悪になる」とおっしゃっていました。本日の私たちのレポートも同じような結論に達しました/Mr. Jim Rogers says “2013 Is Probably Going to Be a Mess.” and today’s our view is very similar.

2012/05/23

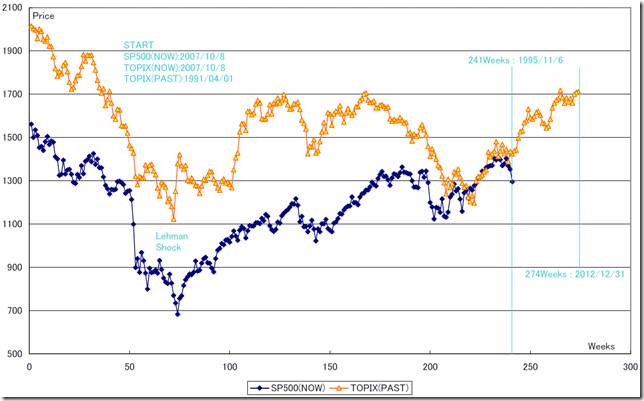
昨日のレポートでは、「先週はS&P500の基点(2007/10/8)からの241週となり、これをTOPIX(基点1991/04/01)に当てはめると1995/11/06の週に相当します」という見解が得られました。

本日は、今後ともしばらくS&P500がTOPIXに寄り添うことになったとするとどのようになるかを検証したいと思います。

Last day we reported “Applying the past TOPIX price movement to the recent S&P500 market, the recent price is similar to TOPIX 11/6/1995 price movement.”.

Today, we analyze if the S&P500 may follow TOPIX for some time, how the market price will become.


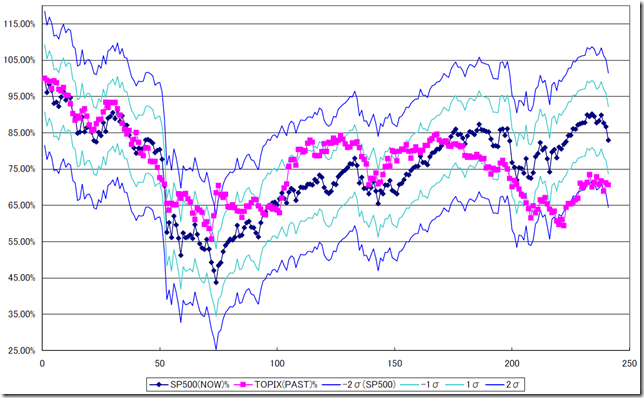
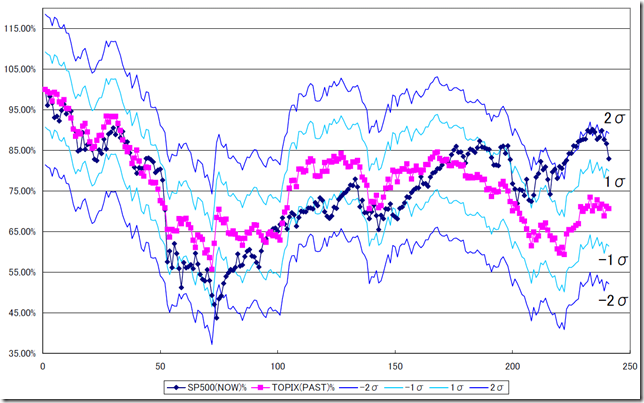
TOPIXを基準とした変動幅を書いてみると、S&P500は、ほとんどの期間で、-1σ~1σの間に収まっていることがわかります。

TOPIXに対して従属的な動きを想定するのであれば、現在のS&P500は上方にオーバーシュートしているところからの調整であることがわかります。

Almost all time, we can see the S&P500 market price is inside -1 sigma to 1 sigma (TOPIX basis).

If the S&P500 market price may follow past TOPIX, the recent S&P500 market price is overshoot and the recent collection is proper.

1_TOPIX


S&P500を基準とした変動幅を書いてみると、TOPIXは、ほとんどの期間で、-1σ~1σの間に収まっていることがわかります。

S&P500に対して従属的な動きを想定するのであれば、過去のTOPIXは2σ内に入っており想定内の動きです。

Almost all time, we can see the TOPIX market price is inside -1 sigma to 1 sigma (S&P500 basis).

If the past TOPIX market price may follow S&P500, the past TOPIX market price is inside 2sigma and this is an expected motion.

2_SP500


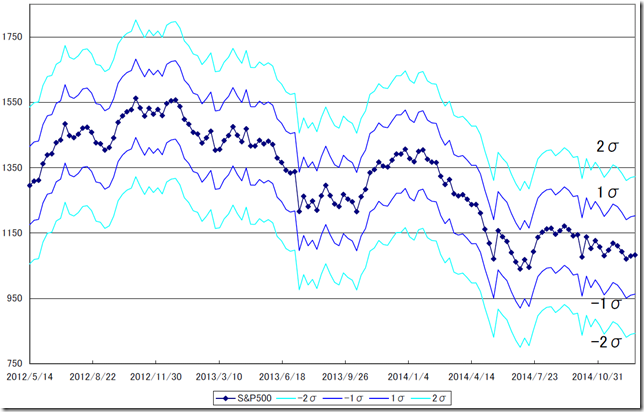
今後もS&P500がTOPIXに寄り添うような動きを想定し、2014年末までのS&P500の想定をしてみました。

上値の目処は2σ、下値の目処は-2σとなります。

今年の11月ぐらいまで上昇後は右肩下がりの曲線を描いています。

ジム・ロジャースさんは「2013 Is Probably Going To Be A Mess.」(2013年はおそらく最悪になる)とおっしゃっておりますが、まさにその通りです。

Next, if the S&P500 market price will follow in future and how the market price will become to 2014 end.

The upper side is 2 sigma and the lower side is -2 sigma.

We can see the S&P500 market price will continue bull market to November this year, after that the market will go into bear market.

Mr. Jim Rogers says “2013 Is Probably Going to Be a Mess.” and this report fits his view.

3_FUTURE


相場分析のリクエストがありましたら“Contact Us”からお知らせください。ご要望にお応えできるように努力いたします。

このブログはあくまでも個人的な見解であり、投資判断は各自でお願い致します。当ブログは一切の投資損益に対する責任を負いません。

ホームページに来て下さってありがとうございます。明日もよろしくお願いいたします。

If you have some request to analyze, please write to “Contact Us”.

We do best effort for your request.

These are only personal opinions on this blog, and you need the investment judgment in each one. This blog doesn’t assume the responsibility to all the investment profit and loss.

Thank for watching our contents. My best regards next day.


シラー教授「(米国は)日本の1995年前後に似ている」。S&P500とTOPIXを検証/ Professor Schiller says ”U.S. Is similar to 1995 Japanese condition” and we compare S&P500 and TOPIX.

2012/05/22

2012/05/20付け日経新聞にロバート・シラー教授へのインタビュー記事が掲載されておりました。そのインタビューの一部に「日本の1995年前後に似ている。」という意見が述べられていました。

本日は、S&P500とTOPIXの週足終値を元に検証します。

The interview to Professor Robert Schiller was published at 2012/05/20 attachment Nikkei newspaper.

In this interview, he says “U.S. is similar to 1995 Japanese condition”.

Today, we analyze S&P500 and TOPIX based on weekend close price.


2種類の基点のチャートを用意しました。(それぞれ価格ベースとパーセンテージベース)

We prepare 2 types of charts and these base points are different.(Each of them has a different a price base and a percentage base.).


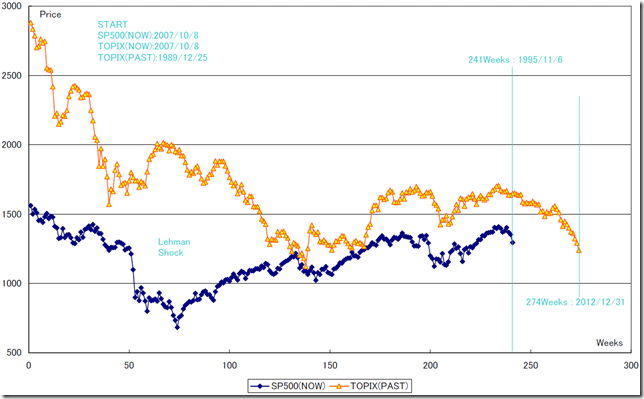
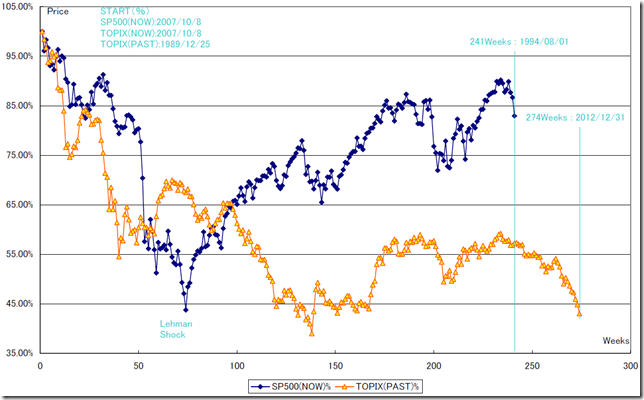
1. TOPIXの最高値(1989/12/25)とS&P500の高値(2007/10/8)基点のチャート(パーセンテージベース共分散値:0.26)

1. The base point are TOPIX highest (12/25/1989) and S&P500 high (10/08/2007) and the percentage based covariance value is 0.26point.

01

02


2. TOPIXの戻り高値(1991/04/01)とS&P500の高値(2007/10/8)基点のチャート(パーセンテージベース共分散値:0.65)

2. The base point are TOPIX highest (04/01/1991) and S&P500 high (10/08/2007) and the percentage based covariance value is 0.65point.

03

04


共分散値/The covariance value

-1 – 0.7

強い負の相関/Very strong negative correlation

-0.7 – -0.4

かなりの負の相関/Strong negative correlation

-0.4 – -0.2

やや相関あり/ some negative correlation

-0.2 – 0

ほとんど相関なし/No correlation

0 – 0.2

ほとんど相関なし/No correlation

0.2 – 0.4

やや相関あり/ Some correlation

0.4 – 0.7

かなりの正の相関/Correlation

0.7 – 1

強い正の相関/ Strong correlation


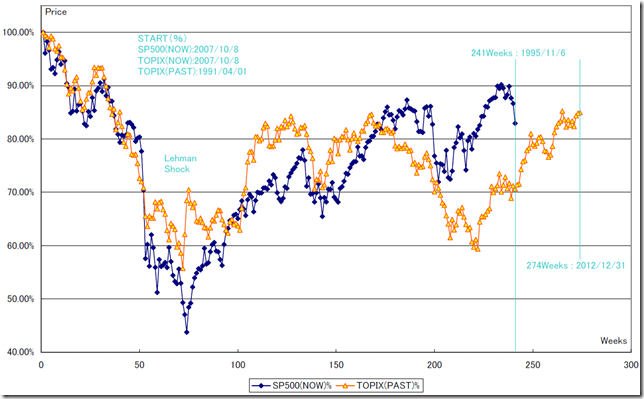
TOPIXの戻り高値(1991/04/01)とS&P500の高値(2007/10/8)からの動きは「かなりの正の相関」関係で動いていることがわかります。

日柄的にも先週はS&P500の基点からの241週となり、これをTOPIXに当てはめると1995/11/06の週に相当します。

ロバート・シラー教授の見解は株価と日柄の関係でみても的を射ていると思います。

There is a correlation between TOPIX 04/01/1991 and S&P500 10/08/2012.

Applying the past TOPIX price movement to the recent S&P500 market, the recent price is similar to TOPIX 11/6/1995 price movement.

Professor Robert Schiller provides us the proper “HIGARA” and “NEHABA”.


相場分析のリクエストがありましたら“Contact Us”からお知らせください。ご要望にお応えできるように努力いたします。

このブログはあくまでも個人的な見解であり、投資判断は各自でお願い致します。当ブログは一切の投資損益に対する責任を負いません。

ホームページに来て下さってありがとうございます。明日もよろしくお願いいたします。

If you have some request to analyze, please write to “Contact Us”.

We do best effort for your request.

These are only personal opinions on this blog, and you need the investment judgment in each one. This blog doesn’t assume the responsibility to all the investment profit and loss.

Thank for watching our contents. My best regards next day.

© 2024 Retar