ドル円 : 美元/日元 : USD/JPY

ドル円1時間足・レジスタンス110.3円、サポート109円ミドル・Sell on Highで臨みたい

2019/03/25

ドル円1時間足・レジスタンス110.3円、サポート109円ミドル・Sell on Highで臨みたい

USDJPY hourly; Resistance is 110.3 yen and support is 109 yen middle; “Sell on high” will be profitable.

美元/日元。阻力是110.3日元,支指是109日元中间。“高价的时候卖”将是有利可图的。


今週の結論は重症の持ち合いからの下抜けなので、”Sell on High”。

「多分112円台をもう一回舐める方に1票ですが、予想しても仕方がありません。予想は大抵外すのでよろしくです。」(2019/3/18)と言うことで、やっぱり外したでしょう。

Our conclusion is the price break from steadiness and “Sell on High” will be profitable.


「ドル円1時間足・ハラミからの抜けに注目」(2018/3/18)

一撃のレンジ抜きです。レンジブレークなので「翌週も売りましょう」です。

We reported “USDJPY hourly; the price is “Inside” and we need to watch the cutting direction” in 3/18/2019.

The range broke and the price got lower. The trend will continue.
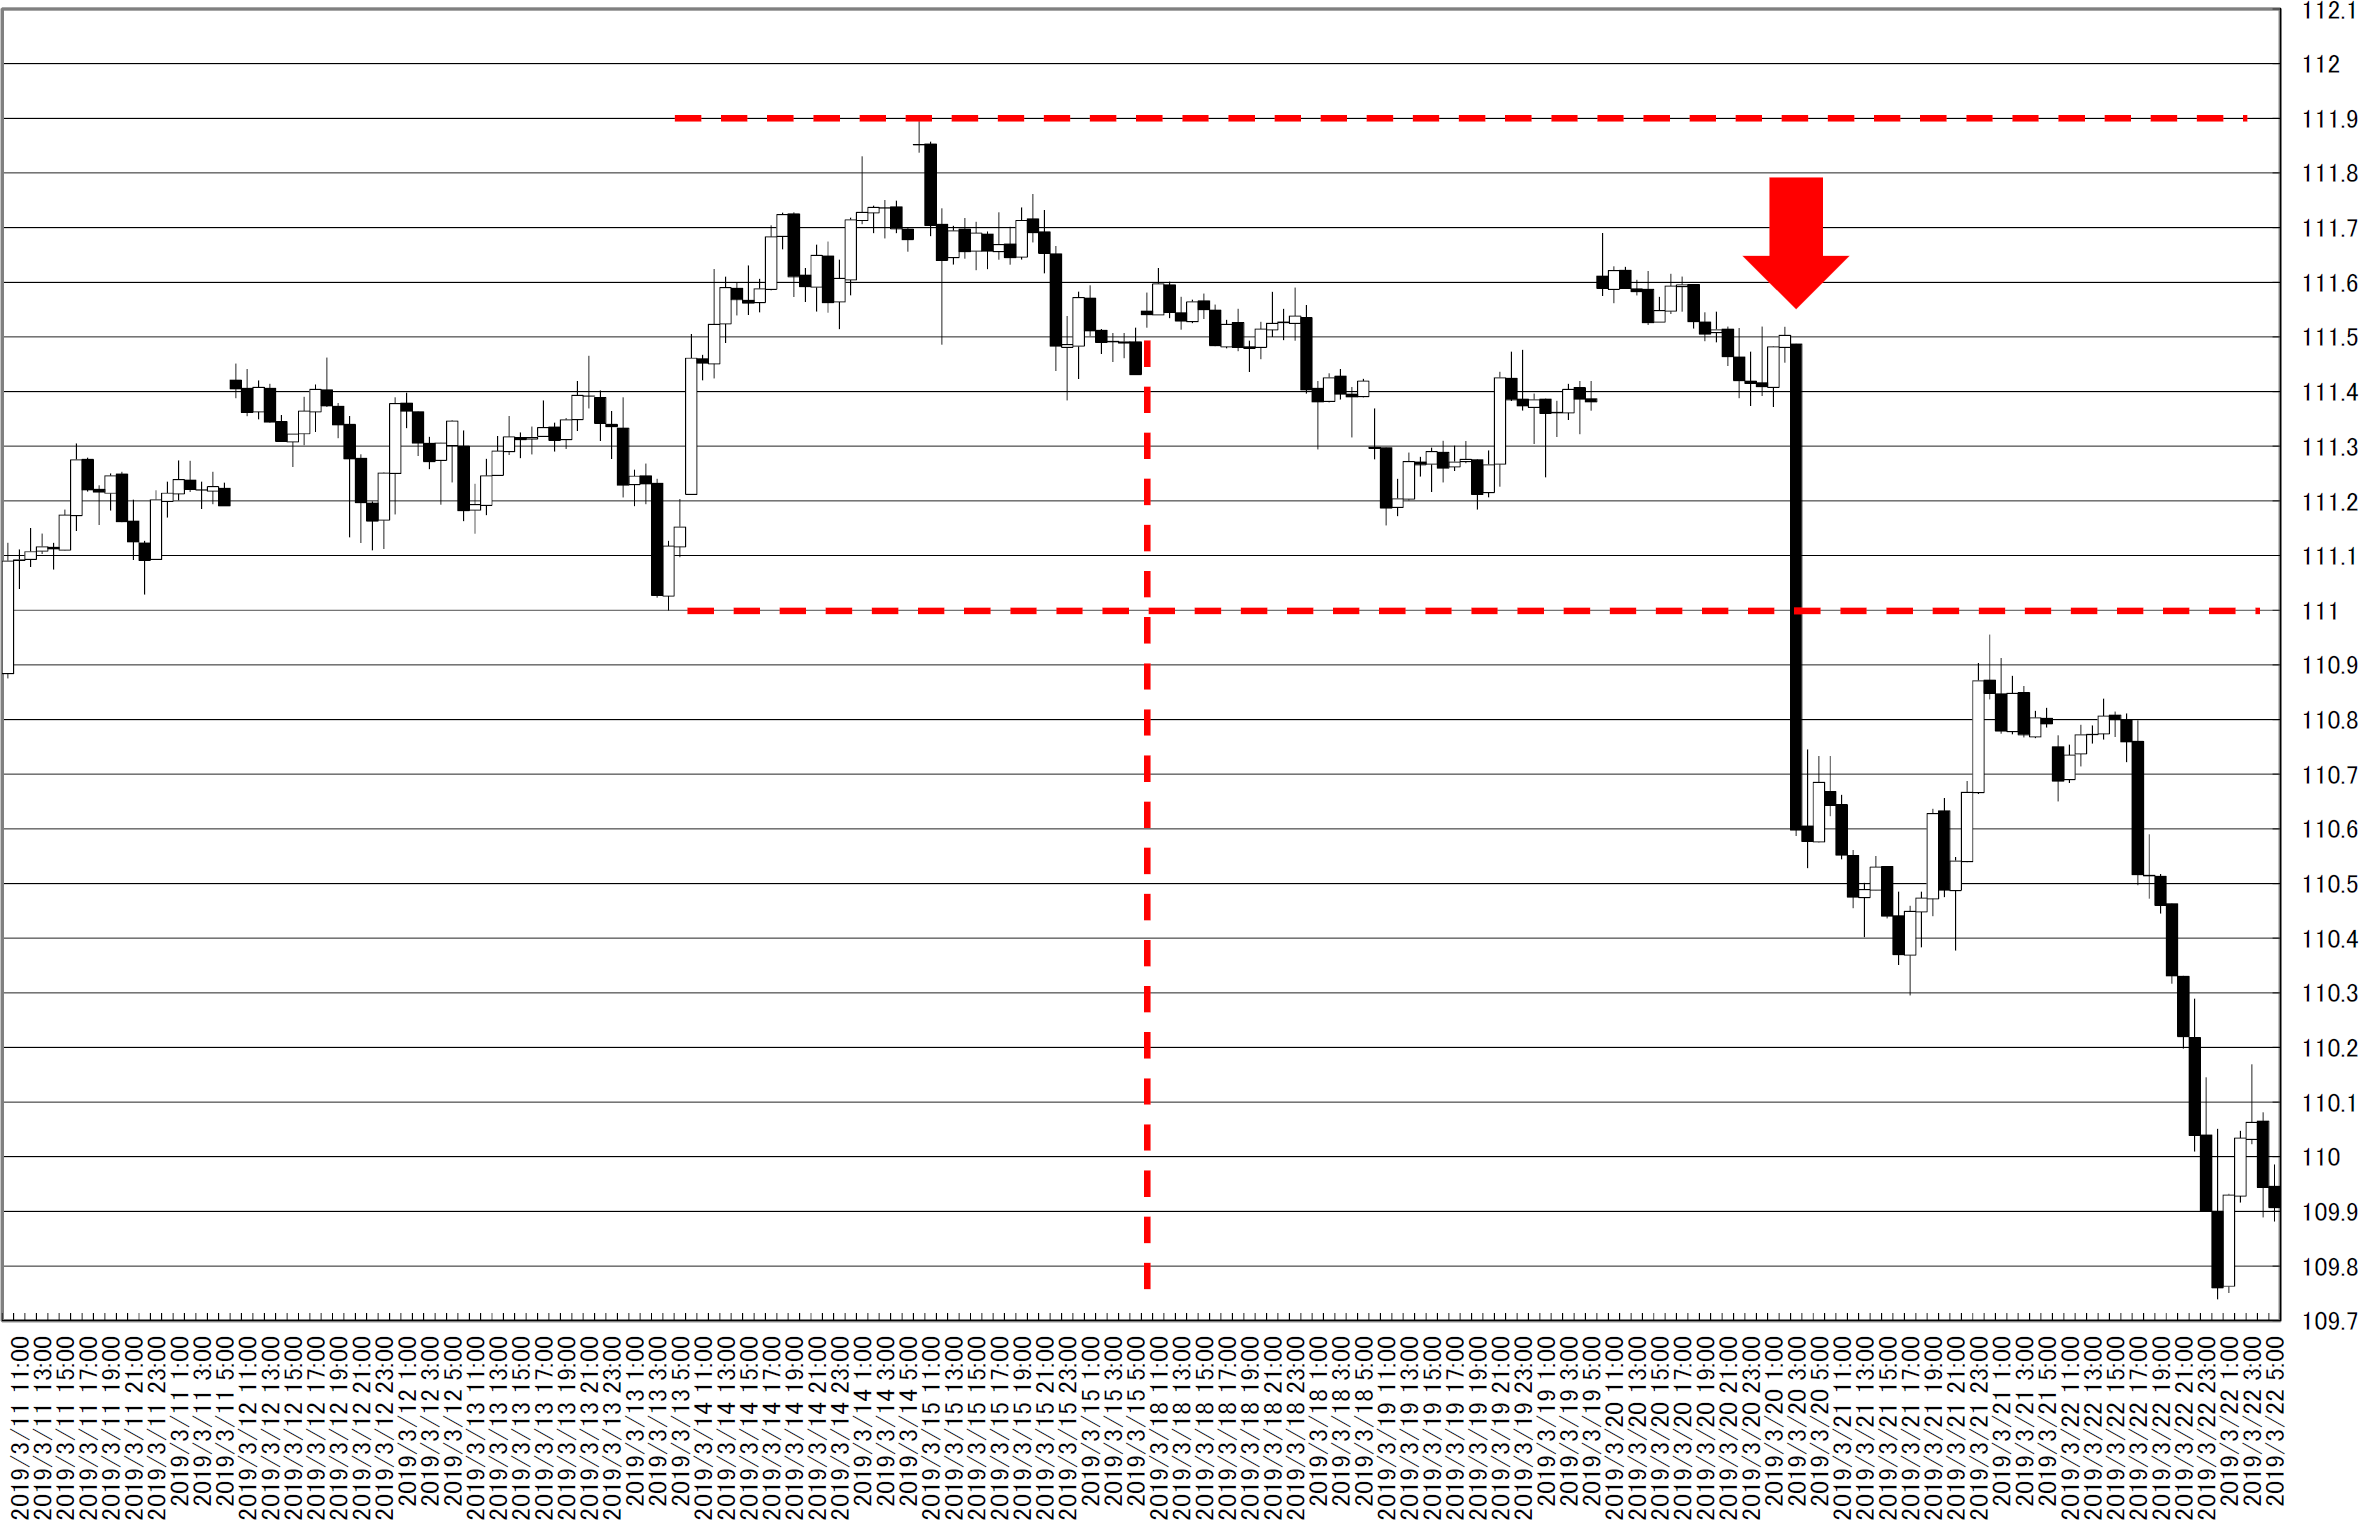
chart0_conv


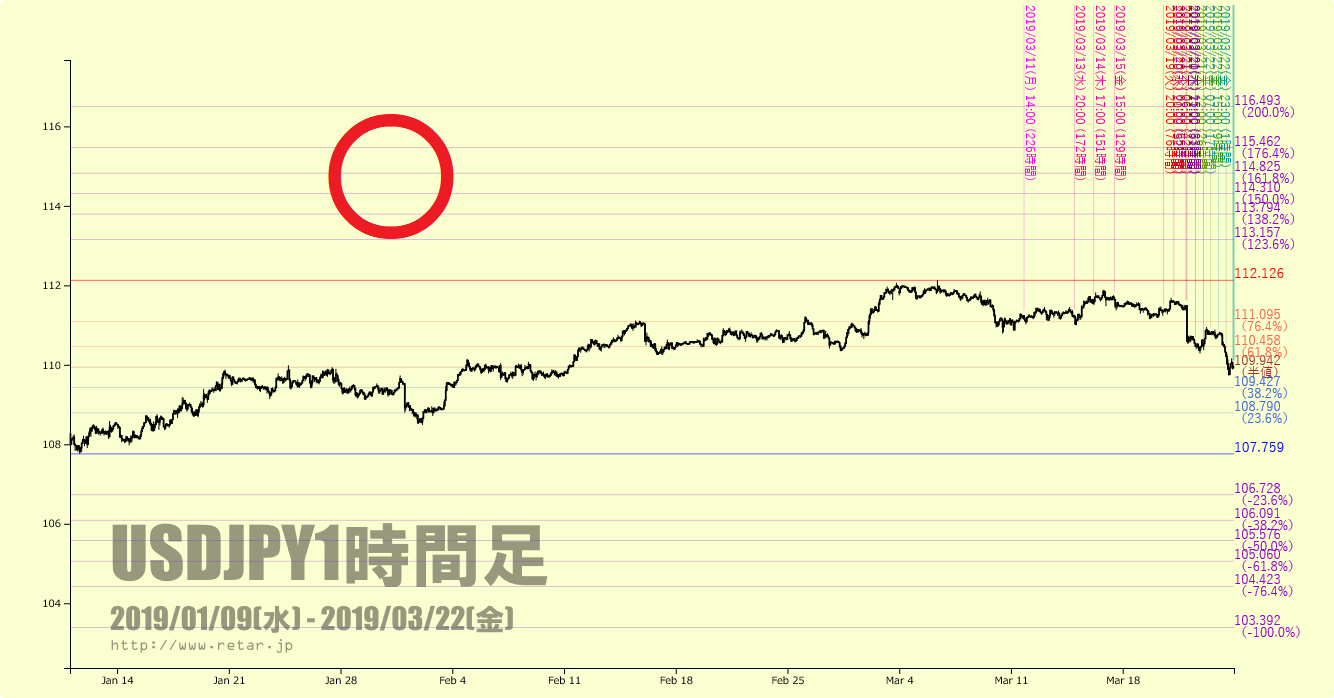
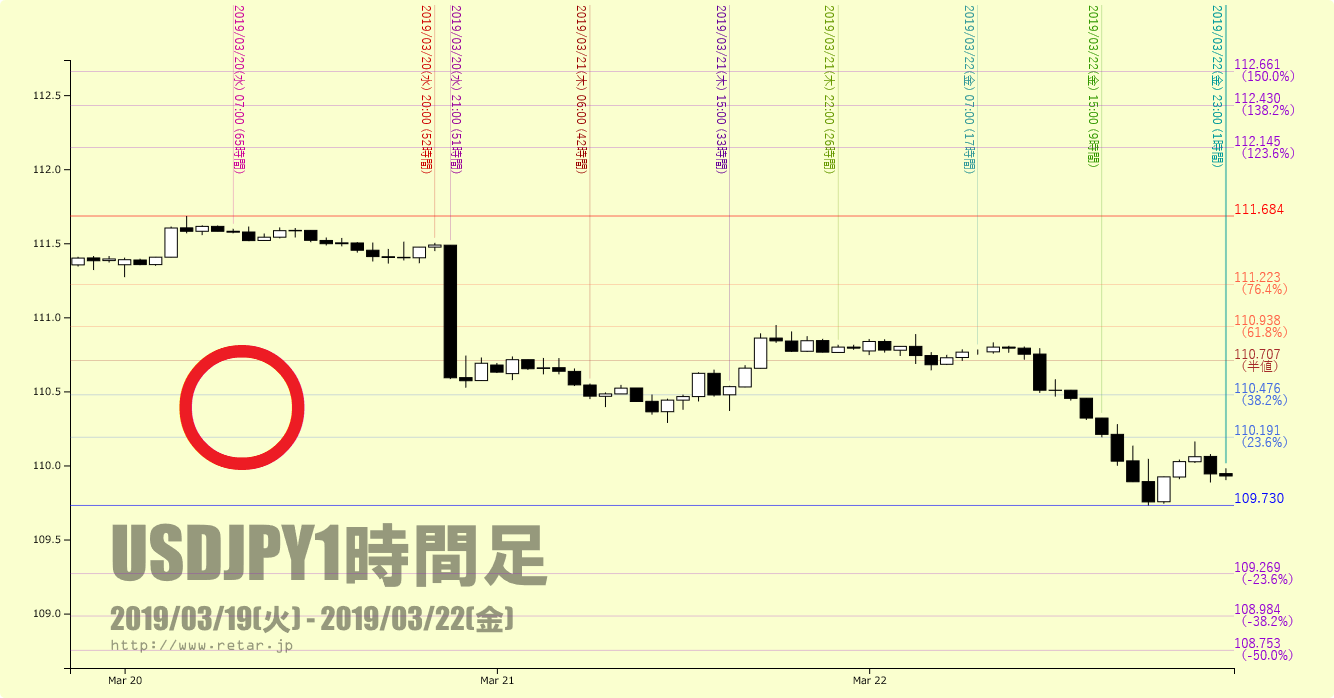
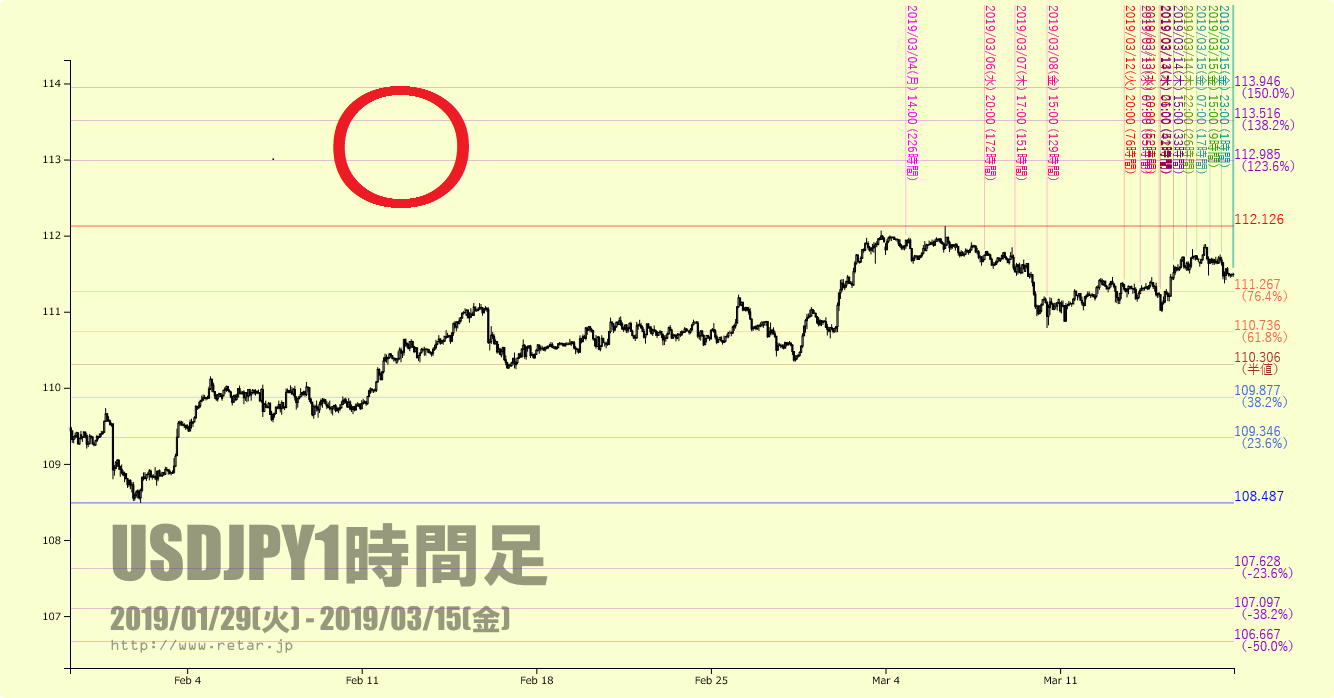
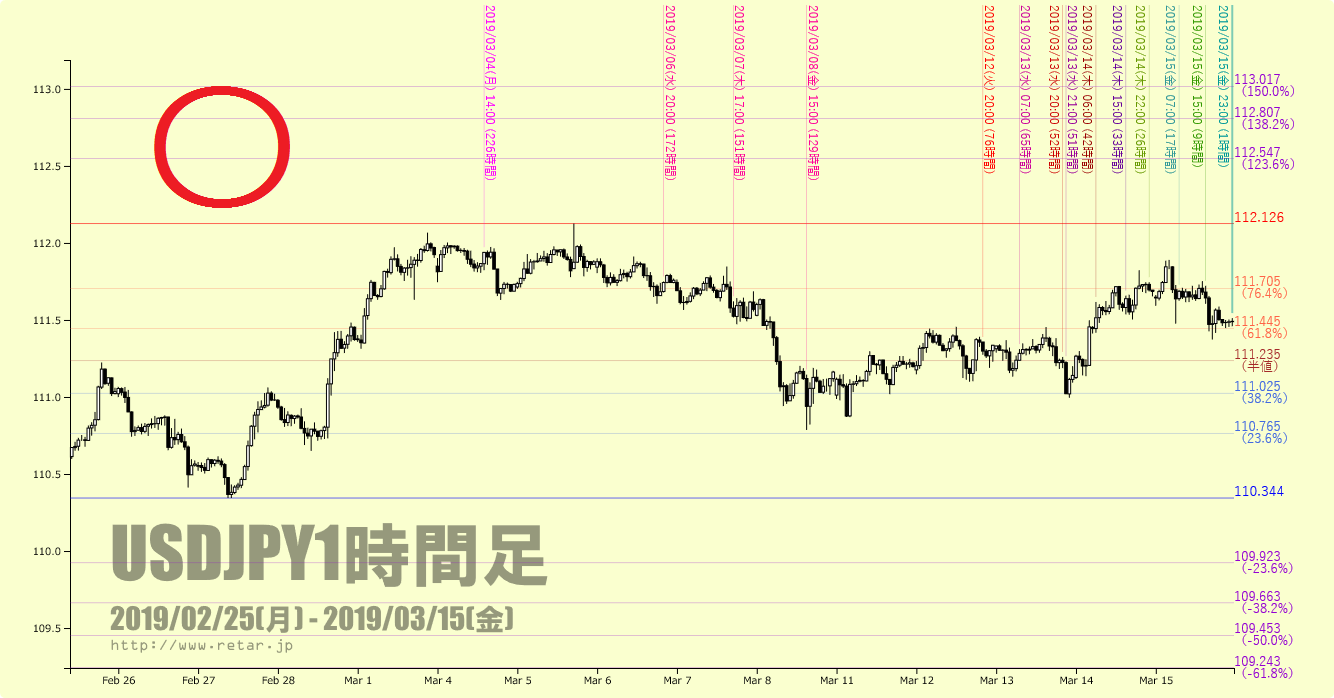
直近のフィボナッチと大枠のフィボナッチです。

適切なフィボナッチに「〇」、不適切なものには「×」をつけています。

うまくいけば、110円ミドルぐらいまでは戻るかもしれません。

いずれにせよ「酒田の体の骨子」(教科書61P)では下げ過ぎなので、少しは戻すとはみています。

These are four types of Fibonacci.

Proper Fibonacci are “〇”.

And inadequate Fibonacci are “×”.

The price may recover 110yen middle.

In any way, the price gets too lower and recovery will be natural.
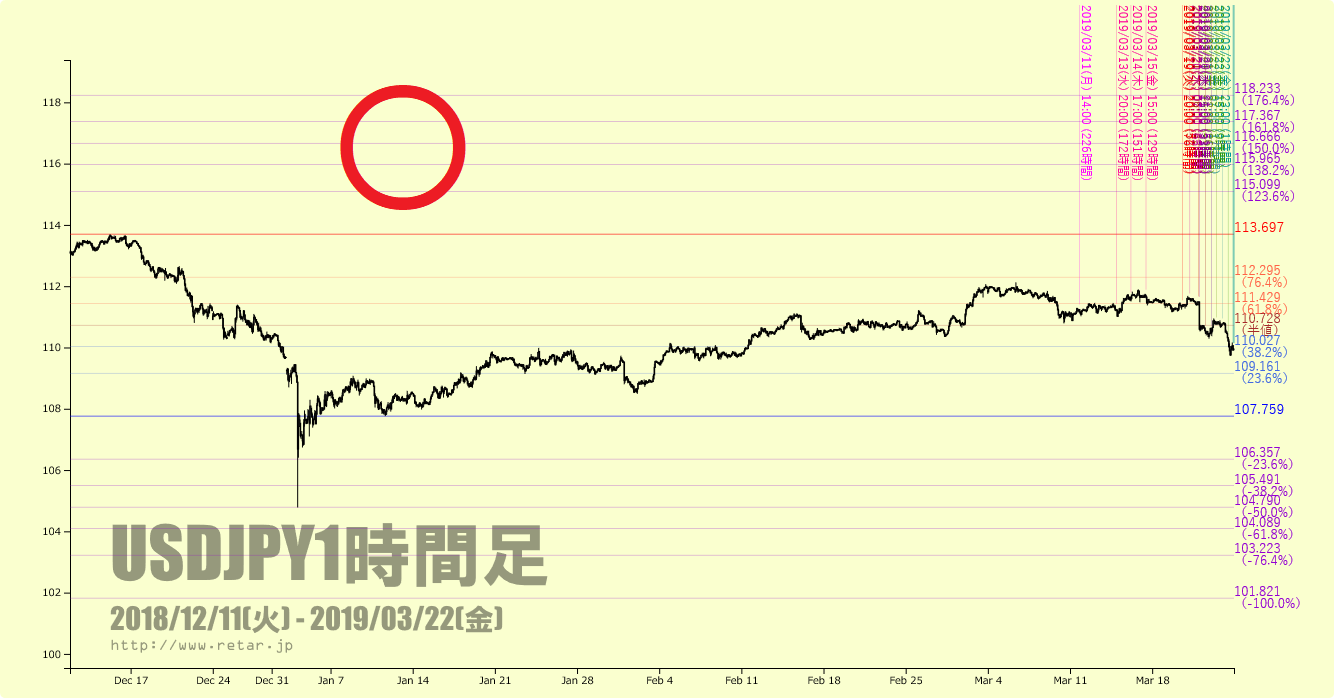
chart1chart2chart3


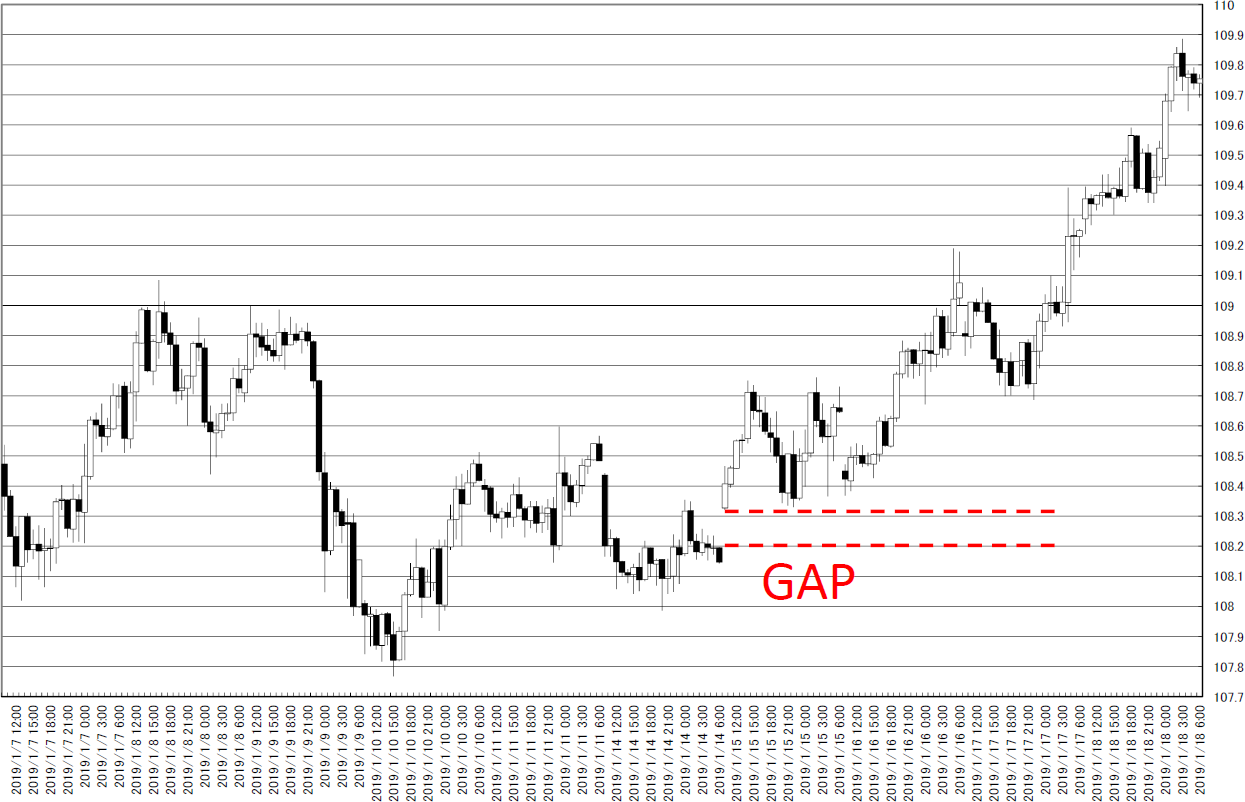
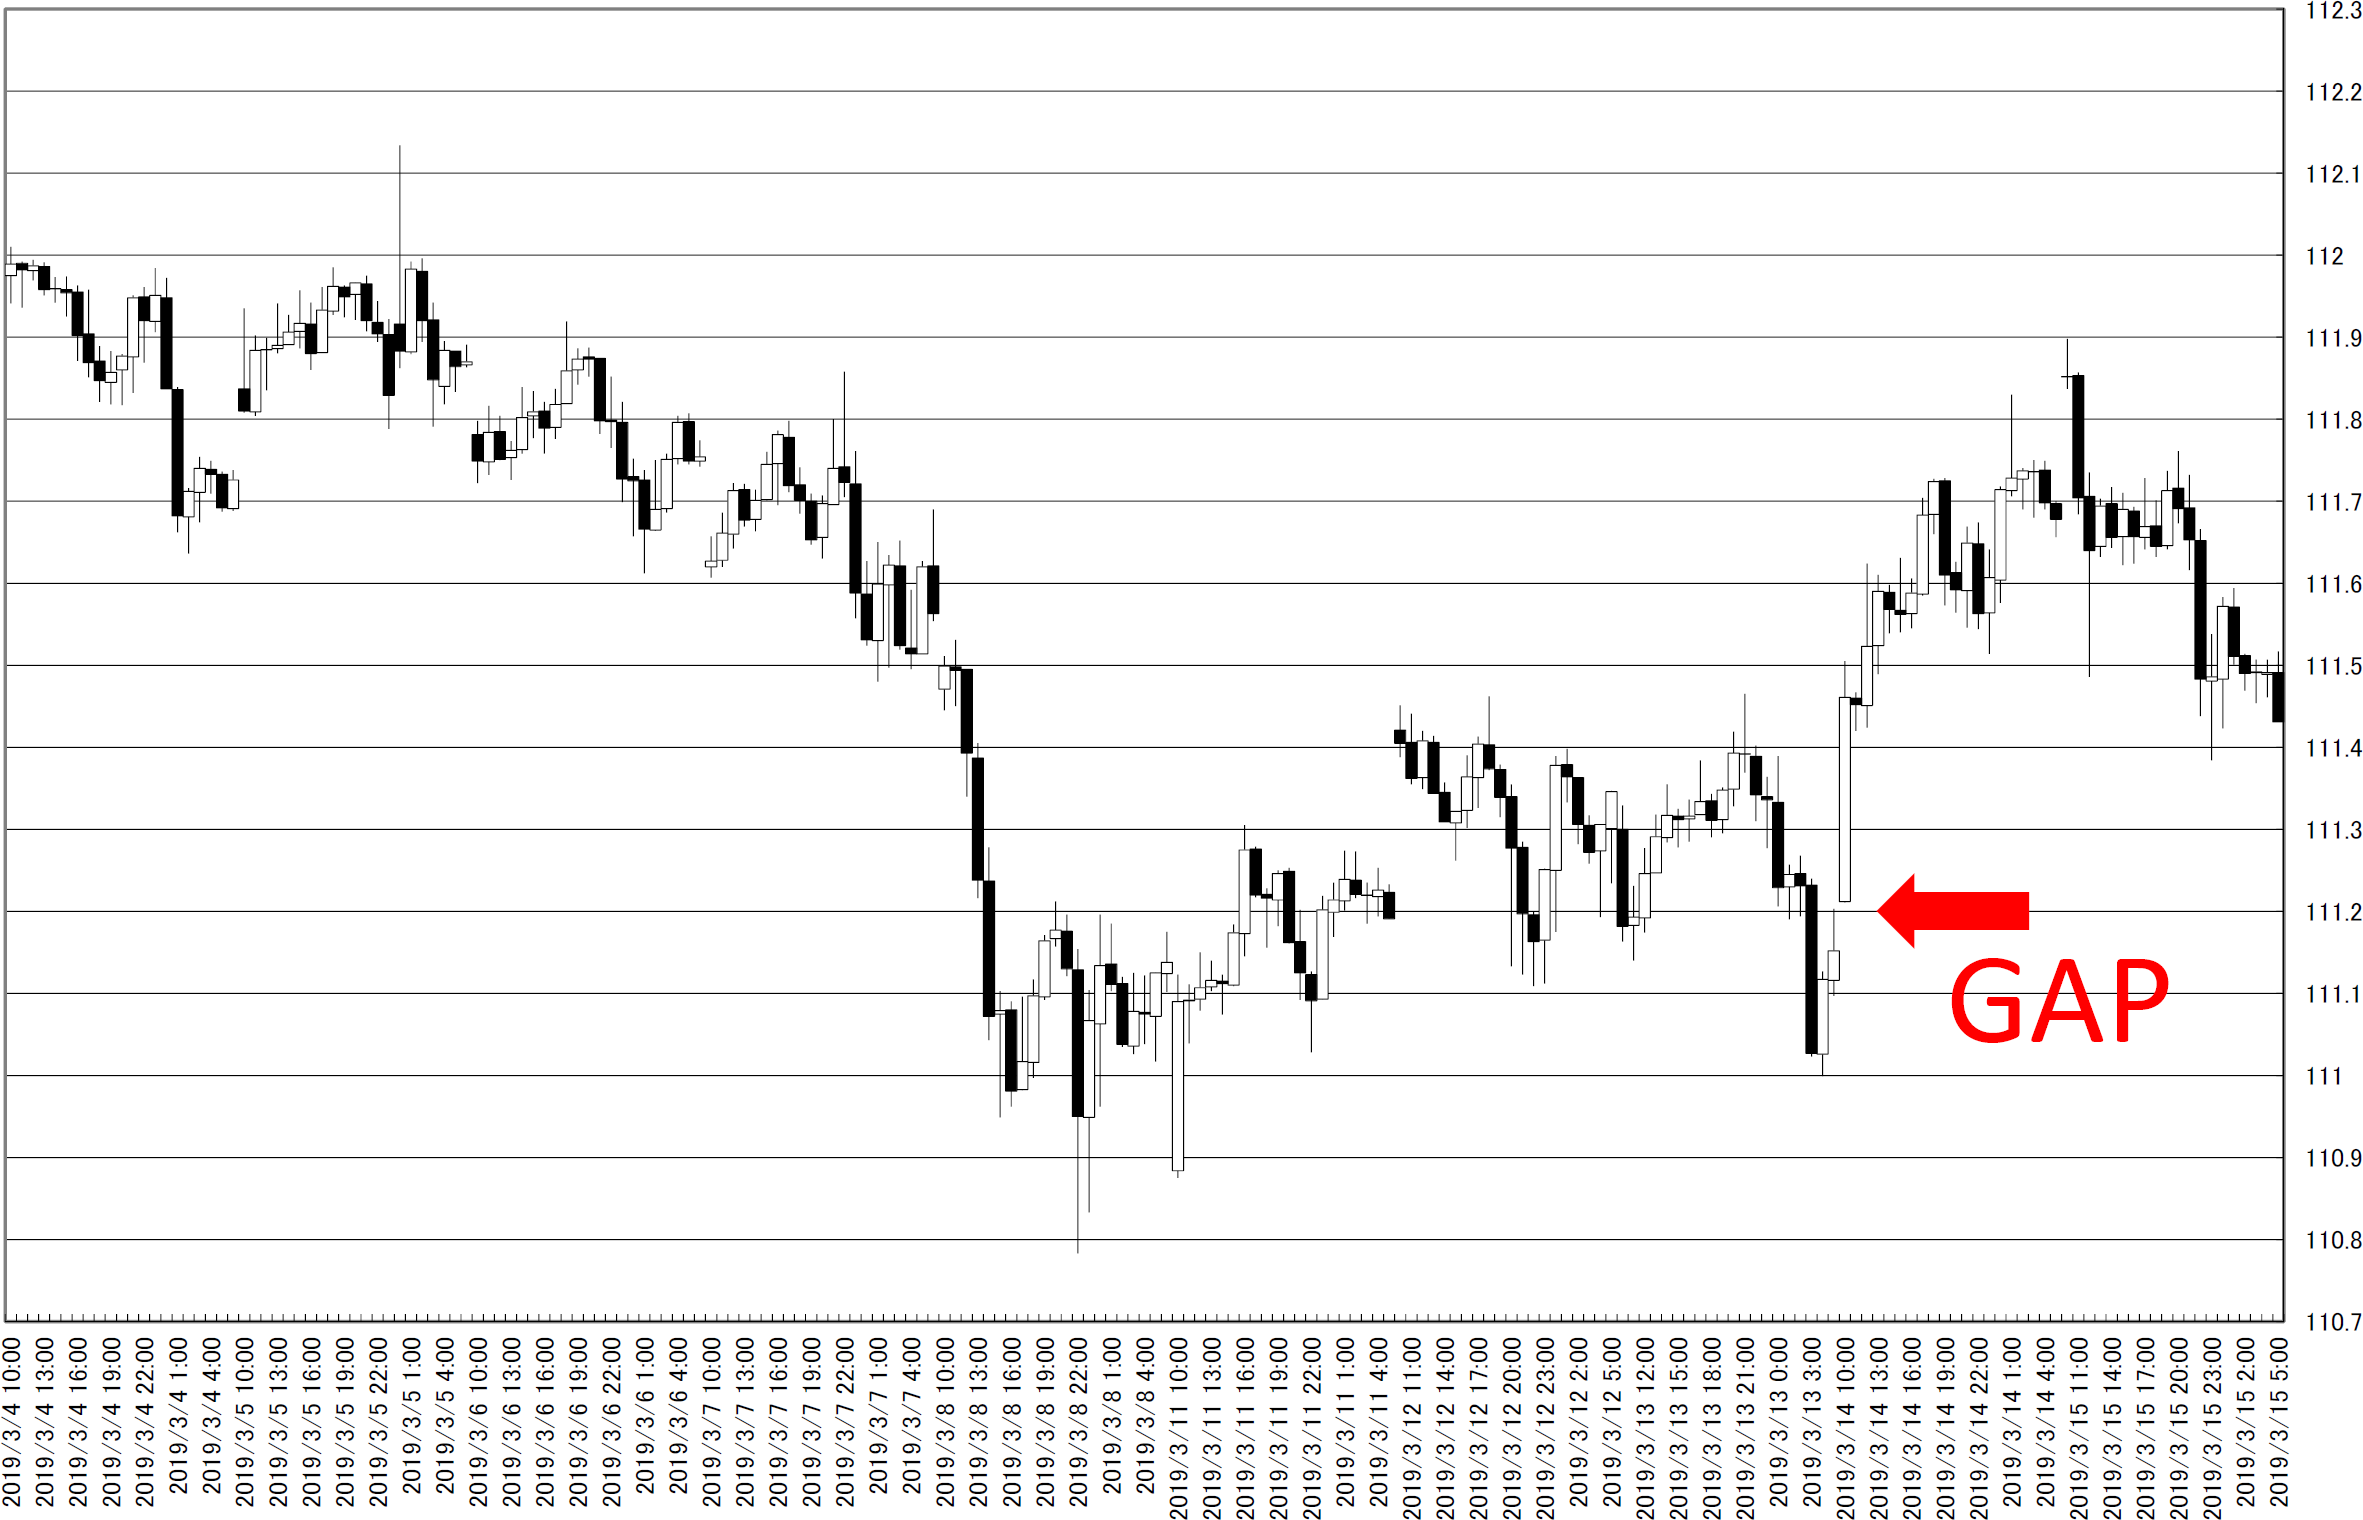
オセアニア時間帯抜きの足です。

111.2円evenの窓は埋まりました。

108.20-30円に窓が残ります。

上に窓がないことがポイントです。

These are latest candle sticks without Oceania time.

111.2yen gap was buried.

There remained gaps at 108.20.-30yen.

There are no gaps in upper side.
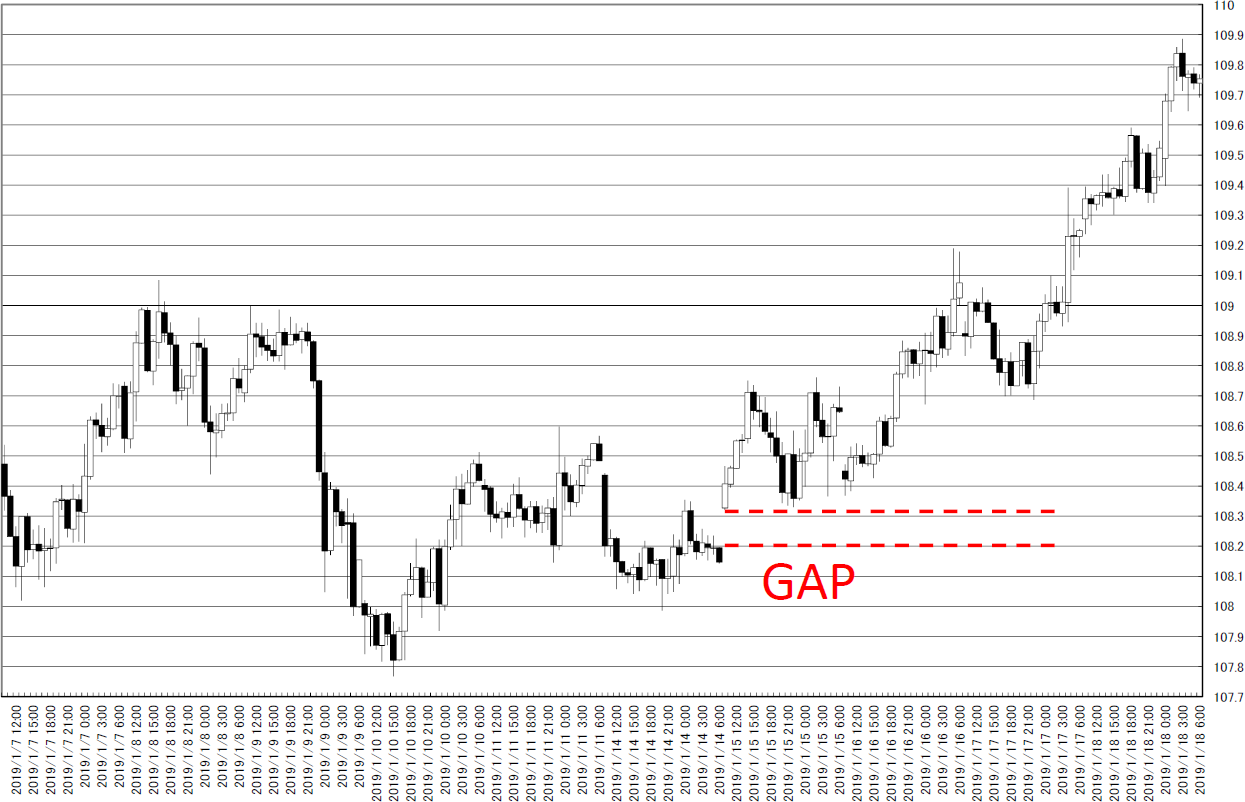
chart4_conv


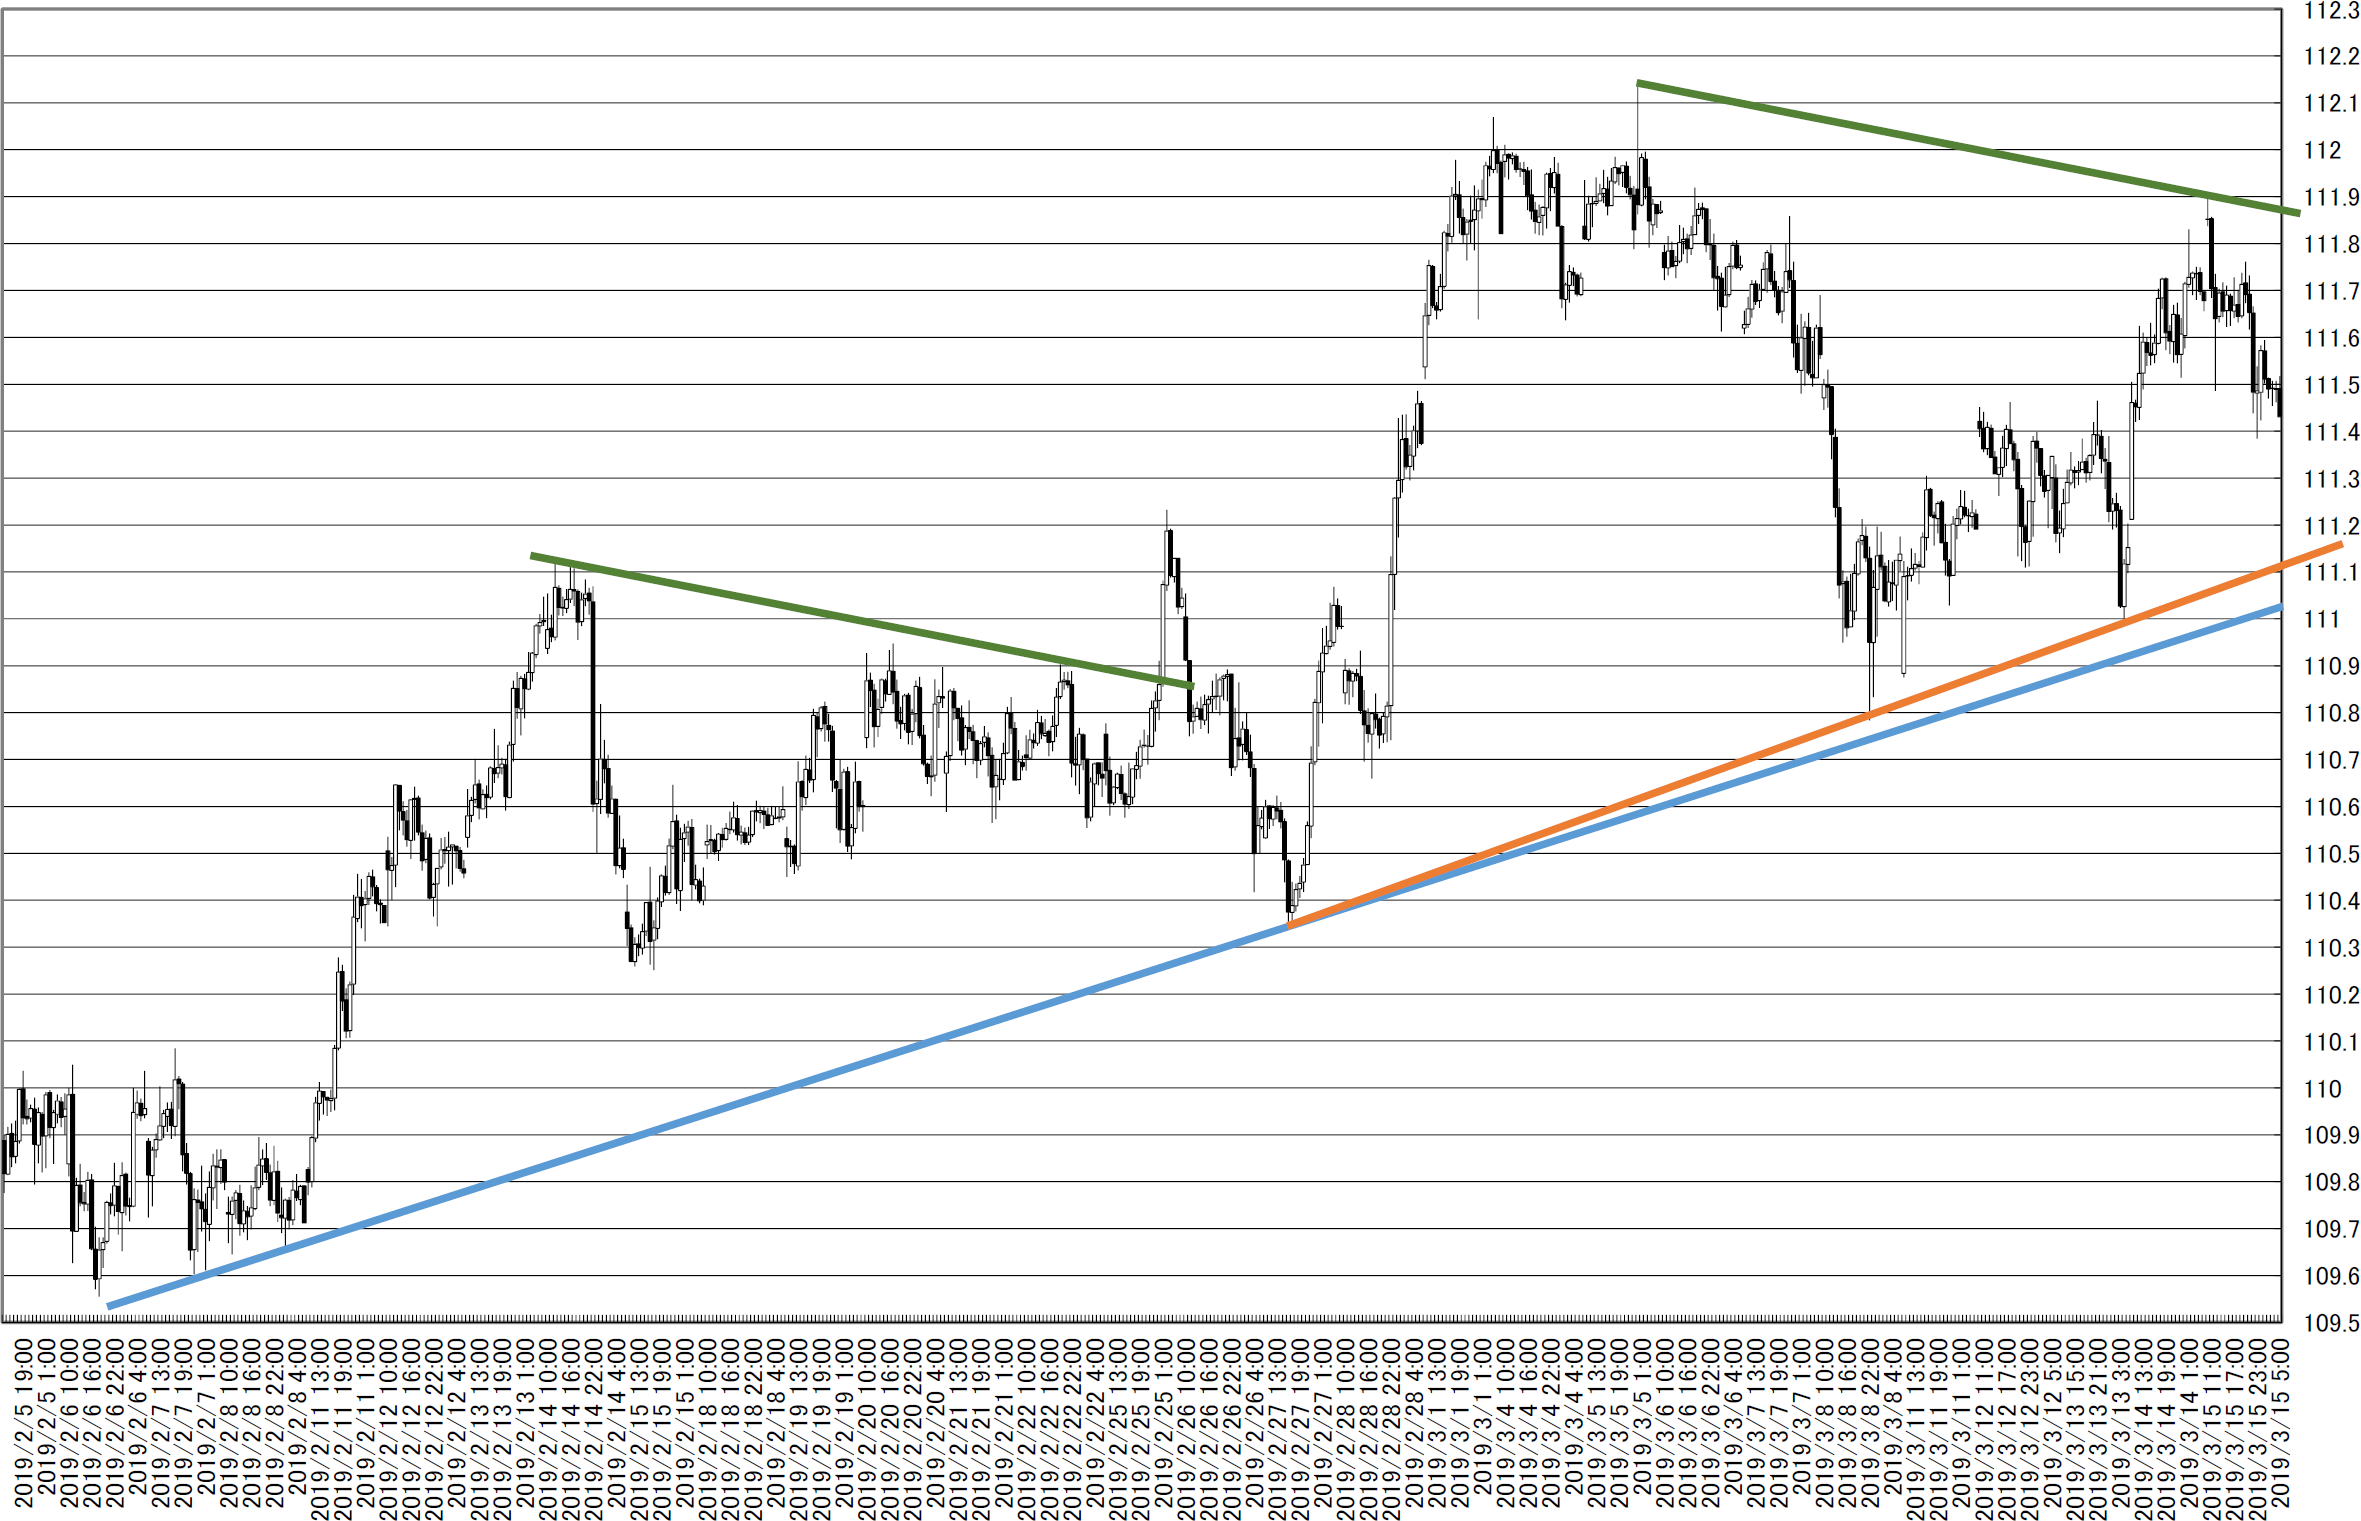
トレンドラインです。

オレンジを切ったので下でしょう。

111円台まで戻るのも怪しさ満点ですが、いずれにせよ上がったら売り戻しです。

This is trend line analysis.

The price cut orange line and bear market was started.

111yen even will be resistance and in any way, “Sell on High” will be profitable.
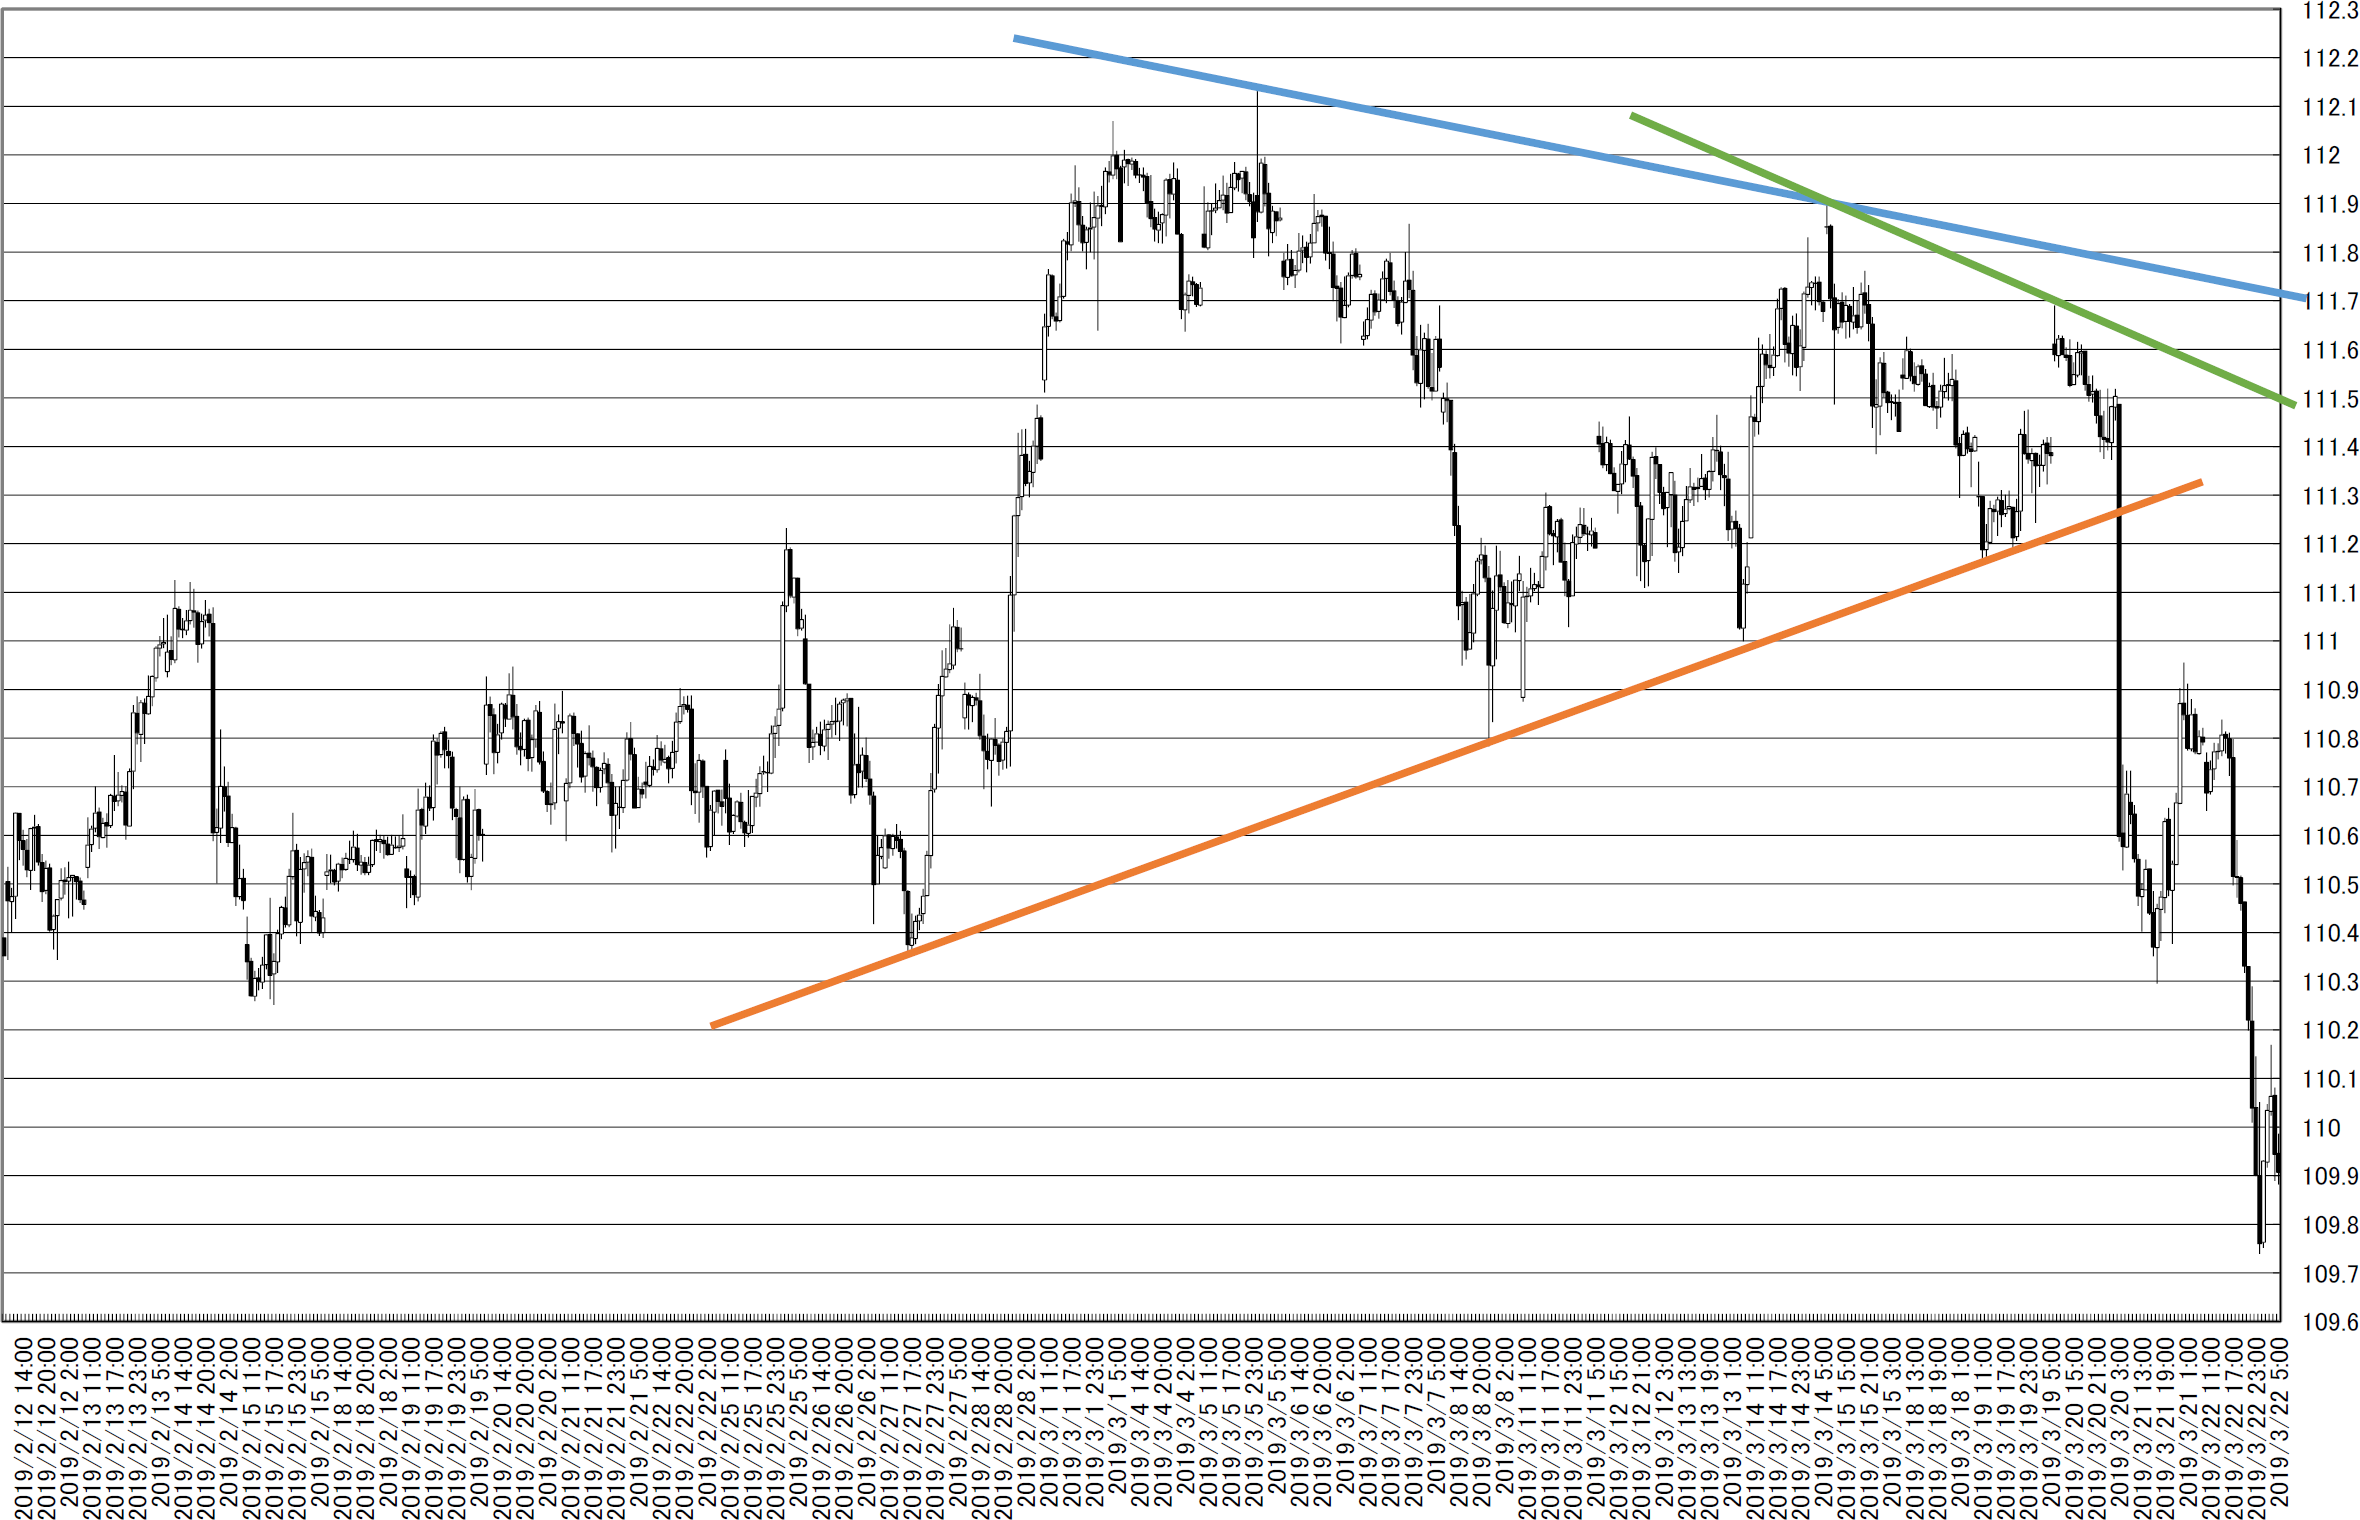
chart5_conv


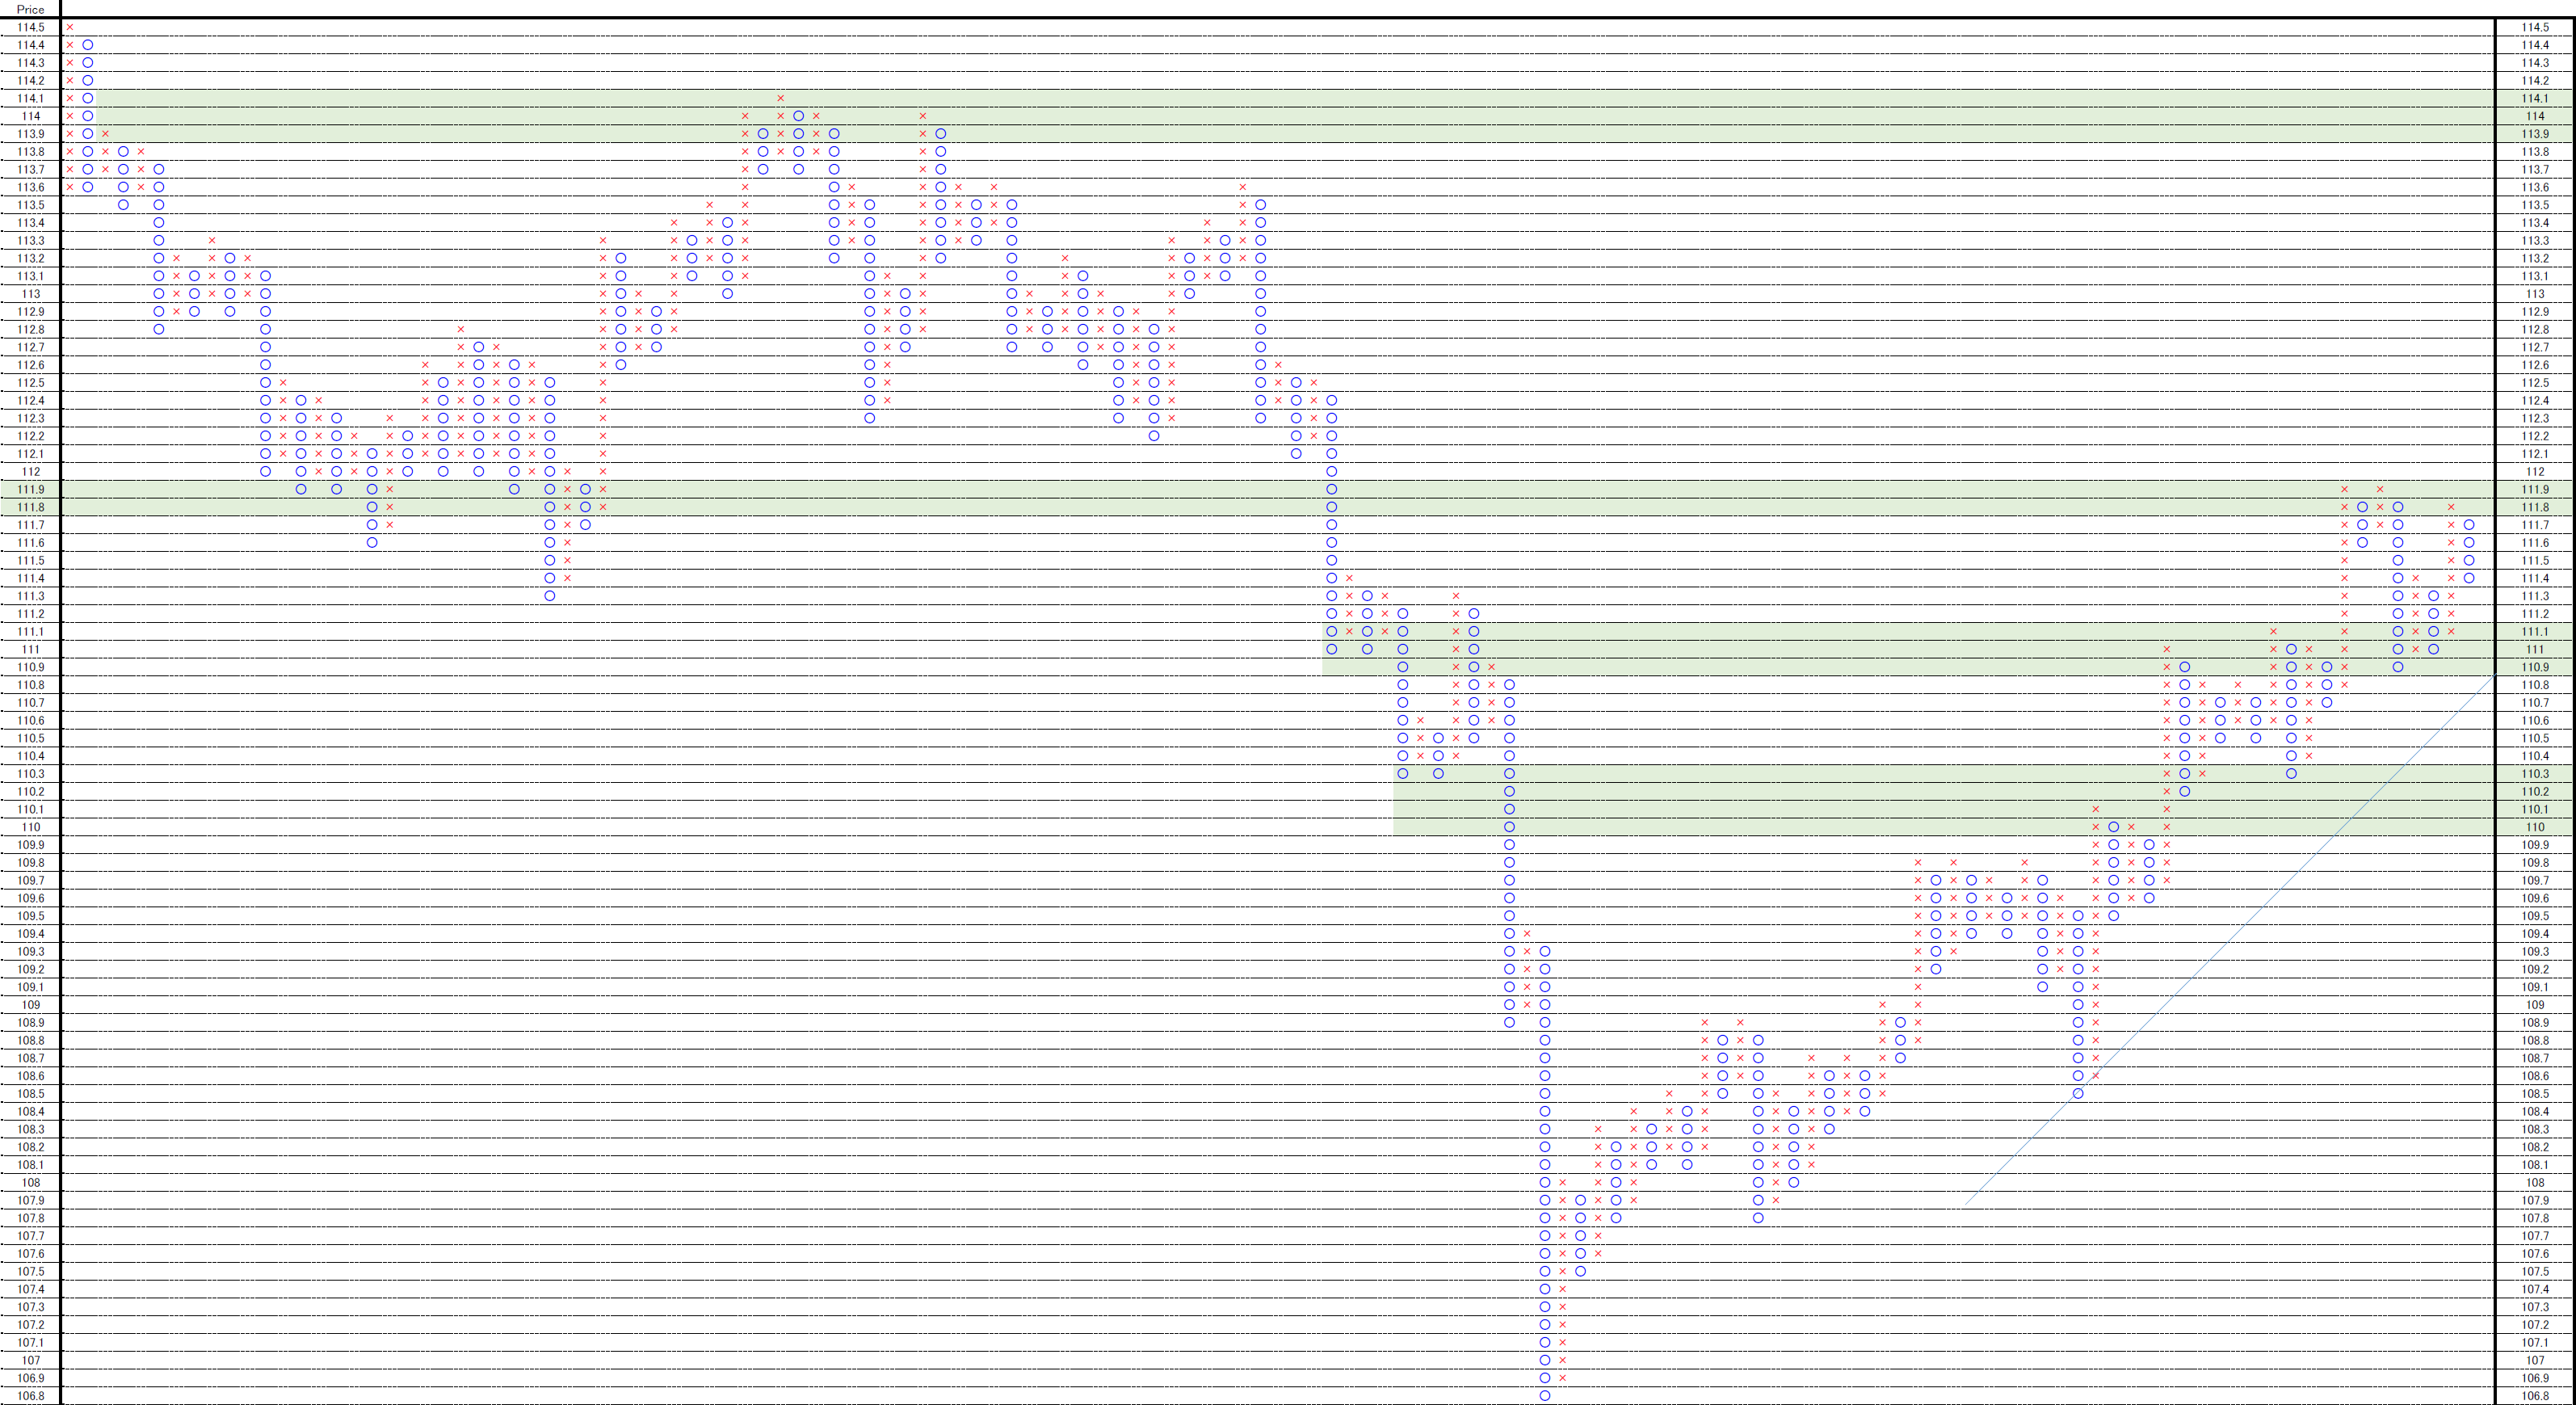
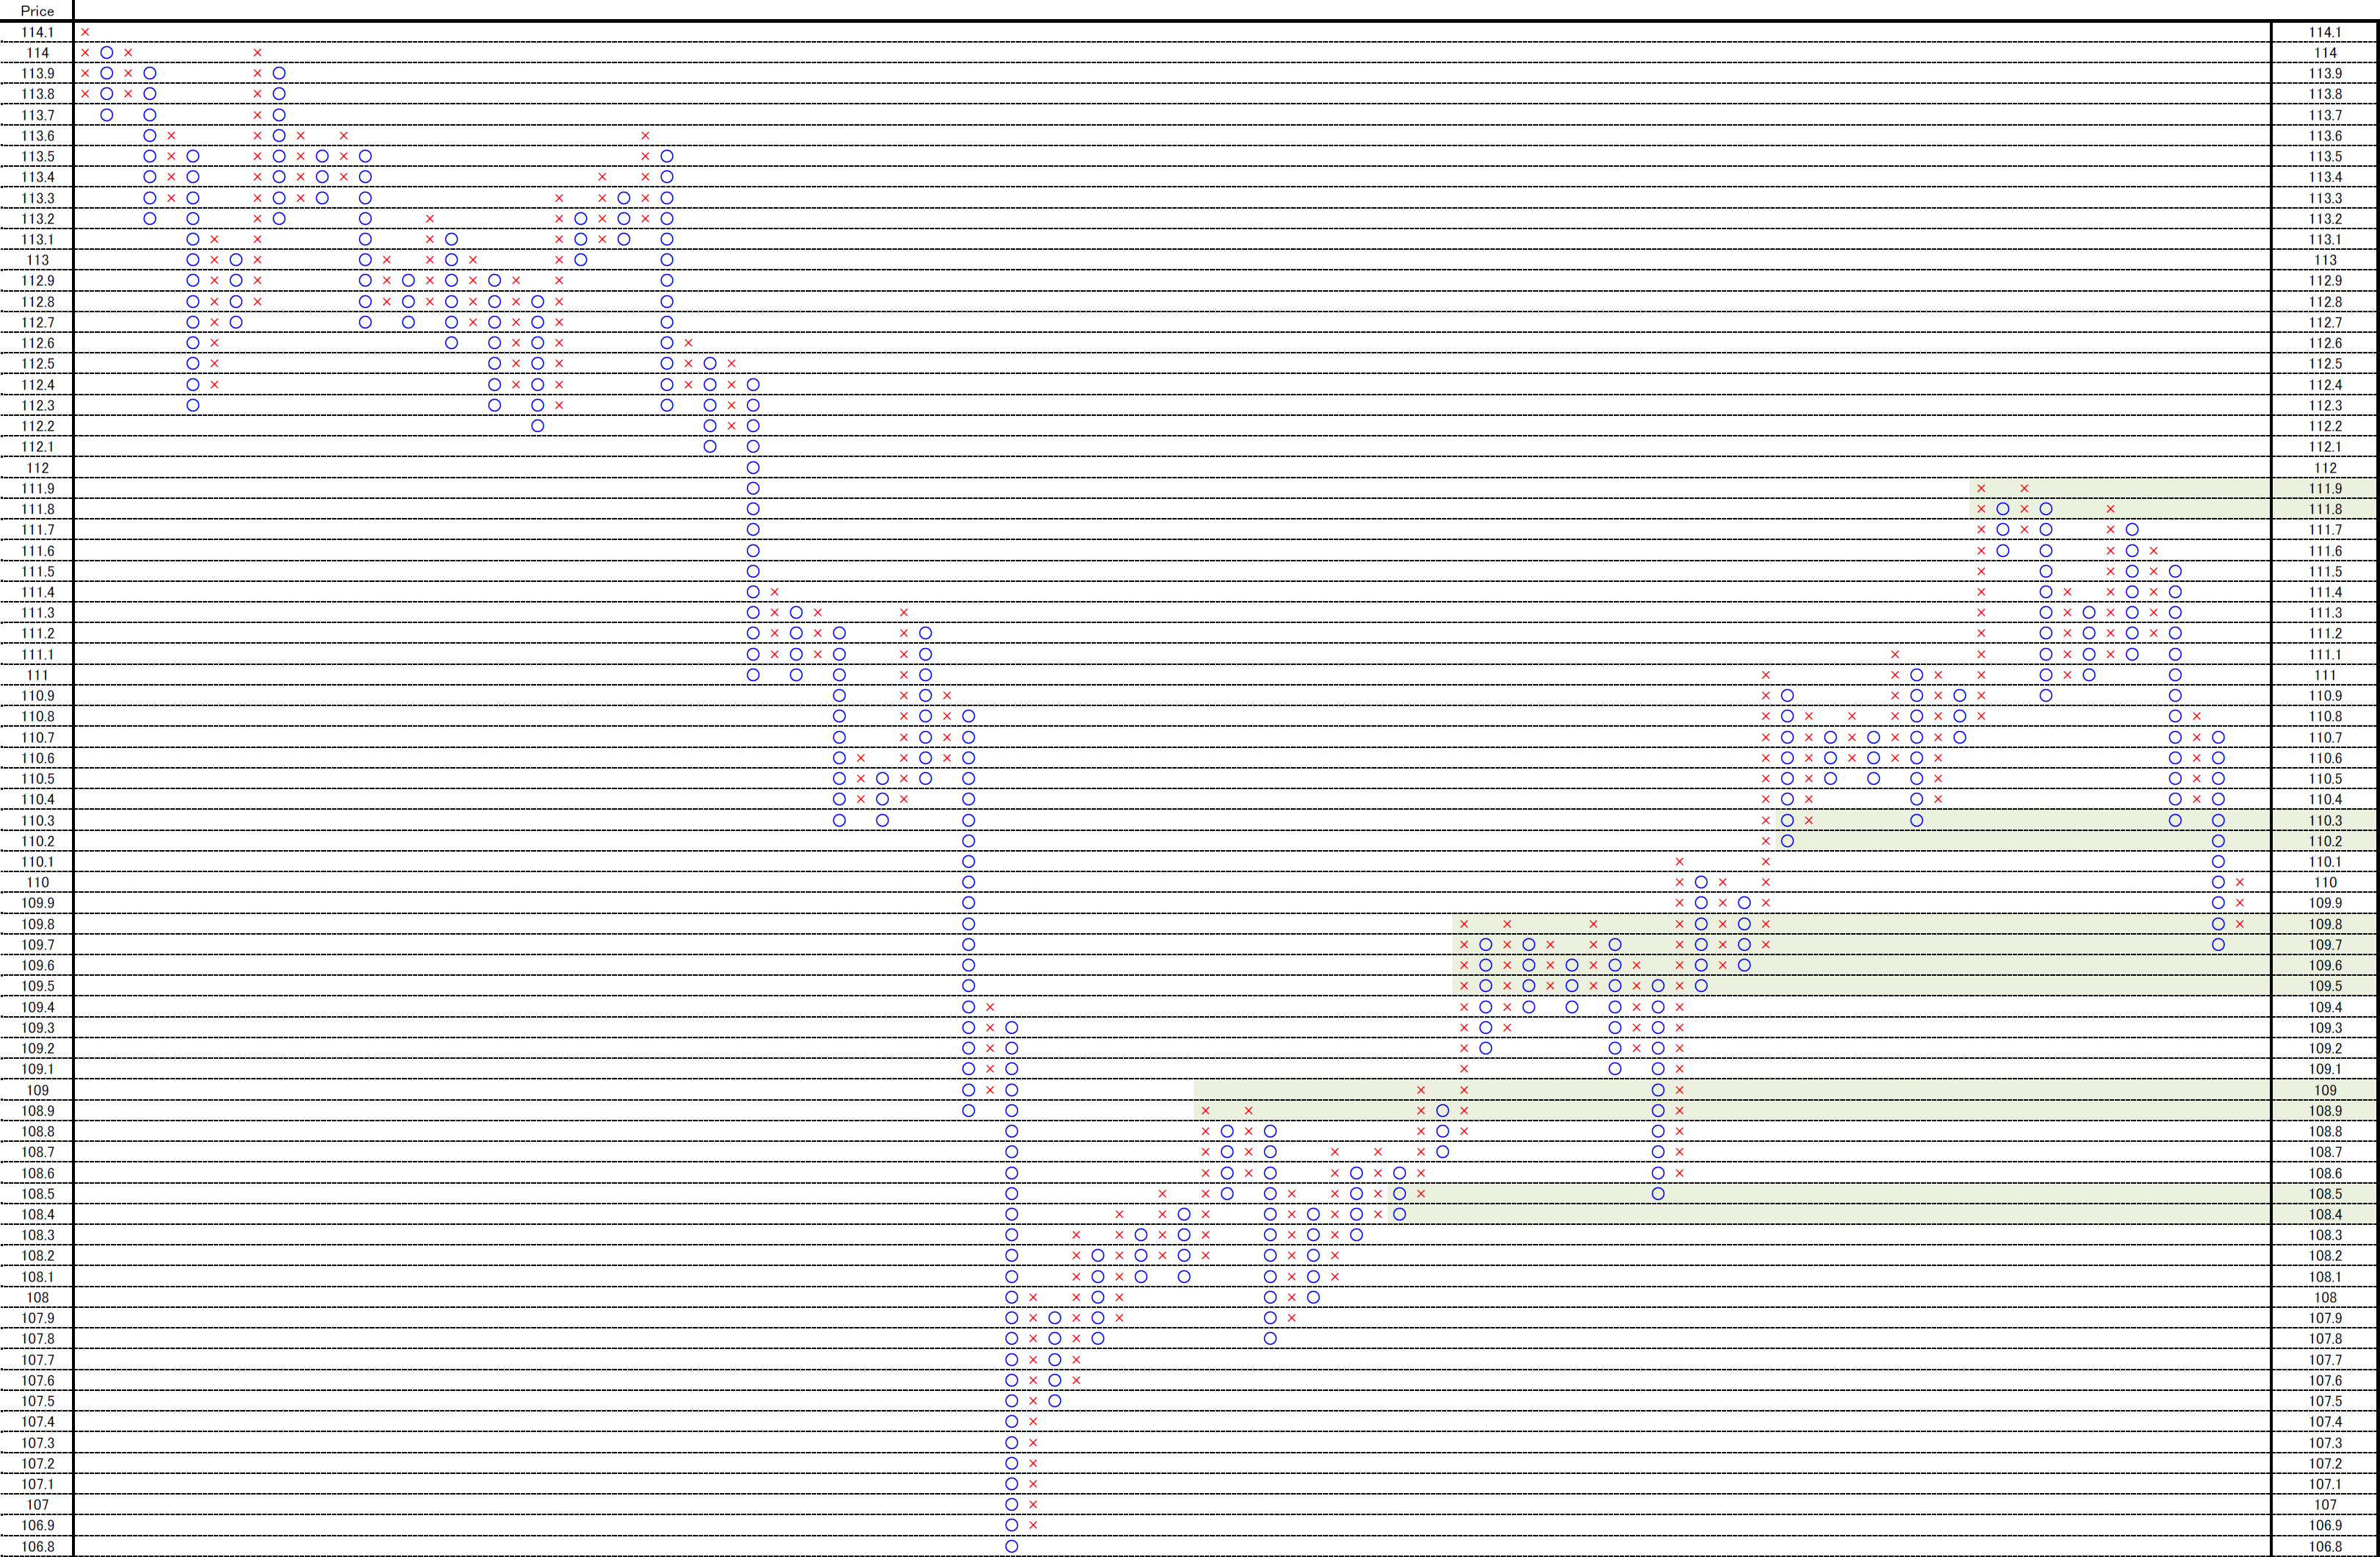
時間足を使用しオセアニア時間帯を省いたP&Fです。

110.20-30円あたりにレジスタンスがあります。

109円台ミドルも強いサポートだとわかります。

本気の下がりなら踏み台運動になるはずです。

ドル円では「スルッと言って美味しいよ」はないので、まあ、チマチマやりましょう。

This is 0.1 price change and 3 box reversal close price’s Point and Figure chart.

110.20-30yen around will be resistance.

We can know 109yen middle will be strong support.
PF_conv


★★レポート作成時データのダウンロード★★

ブログで使用したデータをダウンロードしていただけます。

内容により非提供の場合があります。


相場分析のリクエストがありましたら“Contact Us”からお知らせください。ご要望にお応えできるように努力いたします。

このブログはあくまでも個人的な見解であり、投資判断は各自でお願い致します。当ブログは一切の投資損益に対する責任を負いません。

ブログに来て下さってありがとうございます。明日もよろしくお願いいたします。

If you have some request to analyze, please write to “Contact Us”.

We do best effort for your request.

These are only personal opinions on this blog, and you need the investment judgment in each one. This blog doesn’t assume the responsibility to all the investment profit and loss.

Thank for watching our contents. My best regards next day.

如果您需要行情分析,请点击“Contact Us”联系我们。我们将尽力满足您的要求。

本博客仅为个人意见,请各自做出投资判断。本博客概不对任何投资盈亏负责。

感谢您访问本博客。欢迎再次使用。

ドル円1時間足・ハラミからの抜けに注目

2019/03/18

ドル円1時間足・ハラミからの抜けに注目

USDJPY hourly; the price is “Inside” and we need to watch the cutting direction.

美元/日元。现在是稳定性。我们需要看的切割方向。


今週の結論は、結構重症の持ち合いです。

ダマシも多くなりやすく、ハラミからの抜けに注目です。

多分112円台をもう一回舐める方に1票ですが、予想しても仕方がありません。

予想は大抵外すのでよろしくです。

Our conclusion is now is dull steadiness.

In these occasions, the price often fake us and cutting direction will be a true one.


「ドル円1時間足・上値は重そうだが、110.30円から112.20-30円のレンジ相場」(2019/3/11)

先週は方針を提示できませんでした。結局「持ち合いハラミ」。

We reported “USDJPY hourly; rally will be difficult and the range will be from 112.30-20yen to 110.30yen” in 3/11/2019.

The price gets “Inside”.

chart0_conv


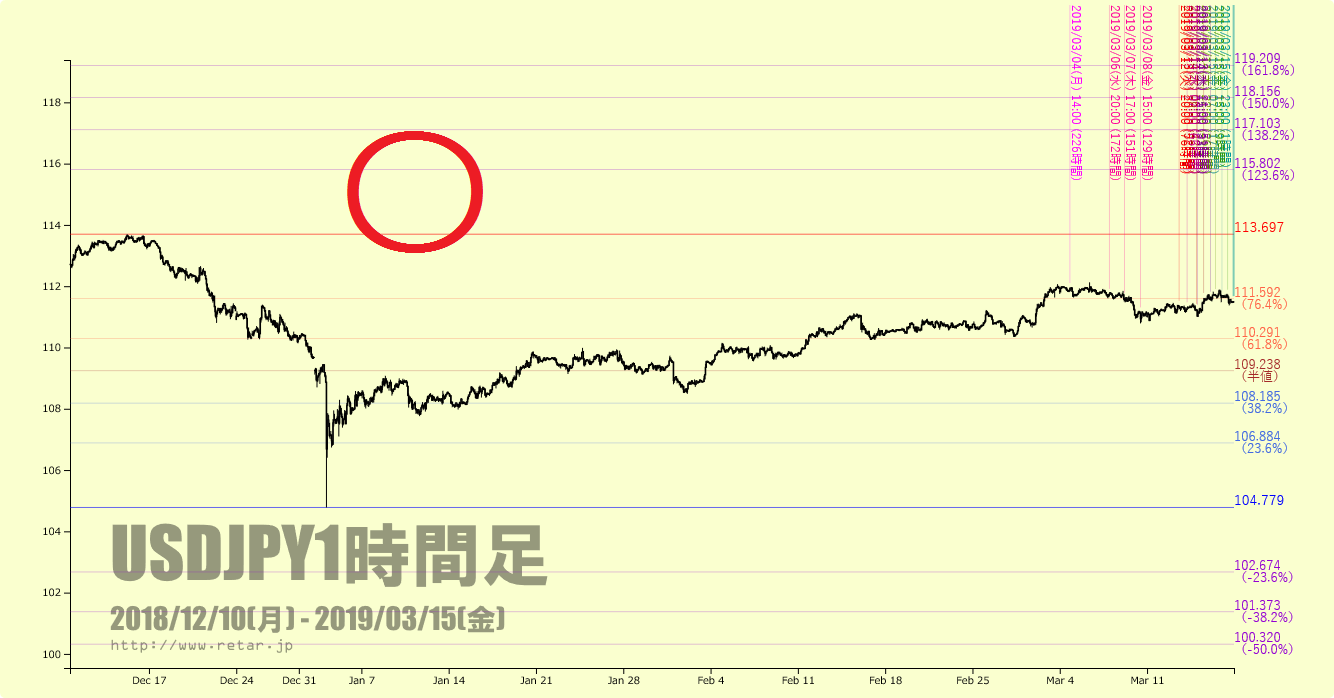
直近のフィボナッチと大枠のフィボナッチです。

適切なフィボナッチに「〇」、不適切なものには「×」をつけています。

注目は一番下。

上の方がチョット伸びているので、多分上を舐めにくるのかな?

These are four types of Fibonacci.

Proper Fibonacci are “〇”.

And inadequate Fibonacci are “×”.

The notable chart is lowest one.

The price will seem to get higher.

chart1_convchart2_convchart3_conv


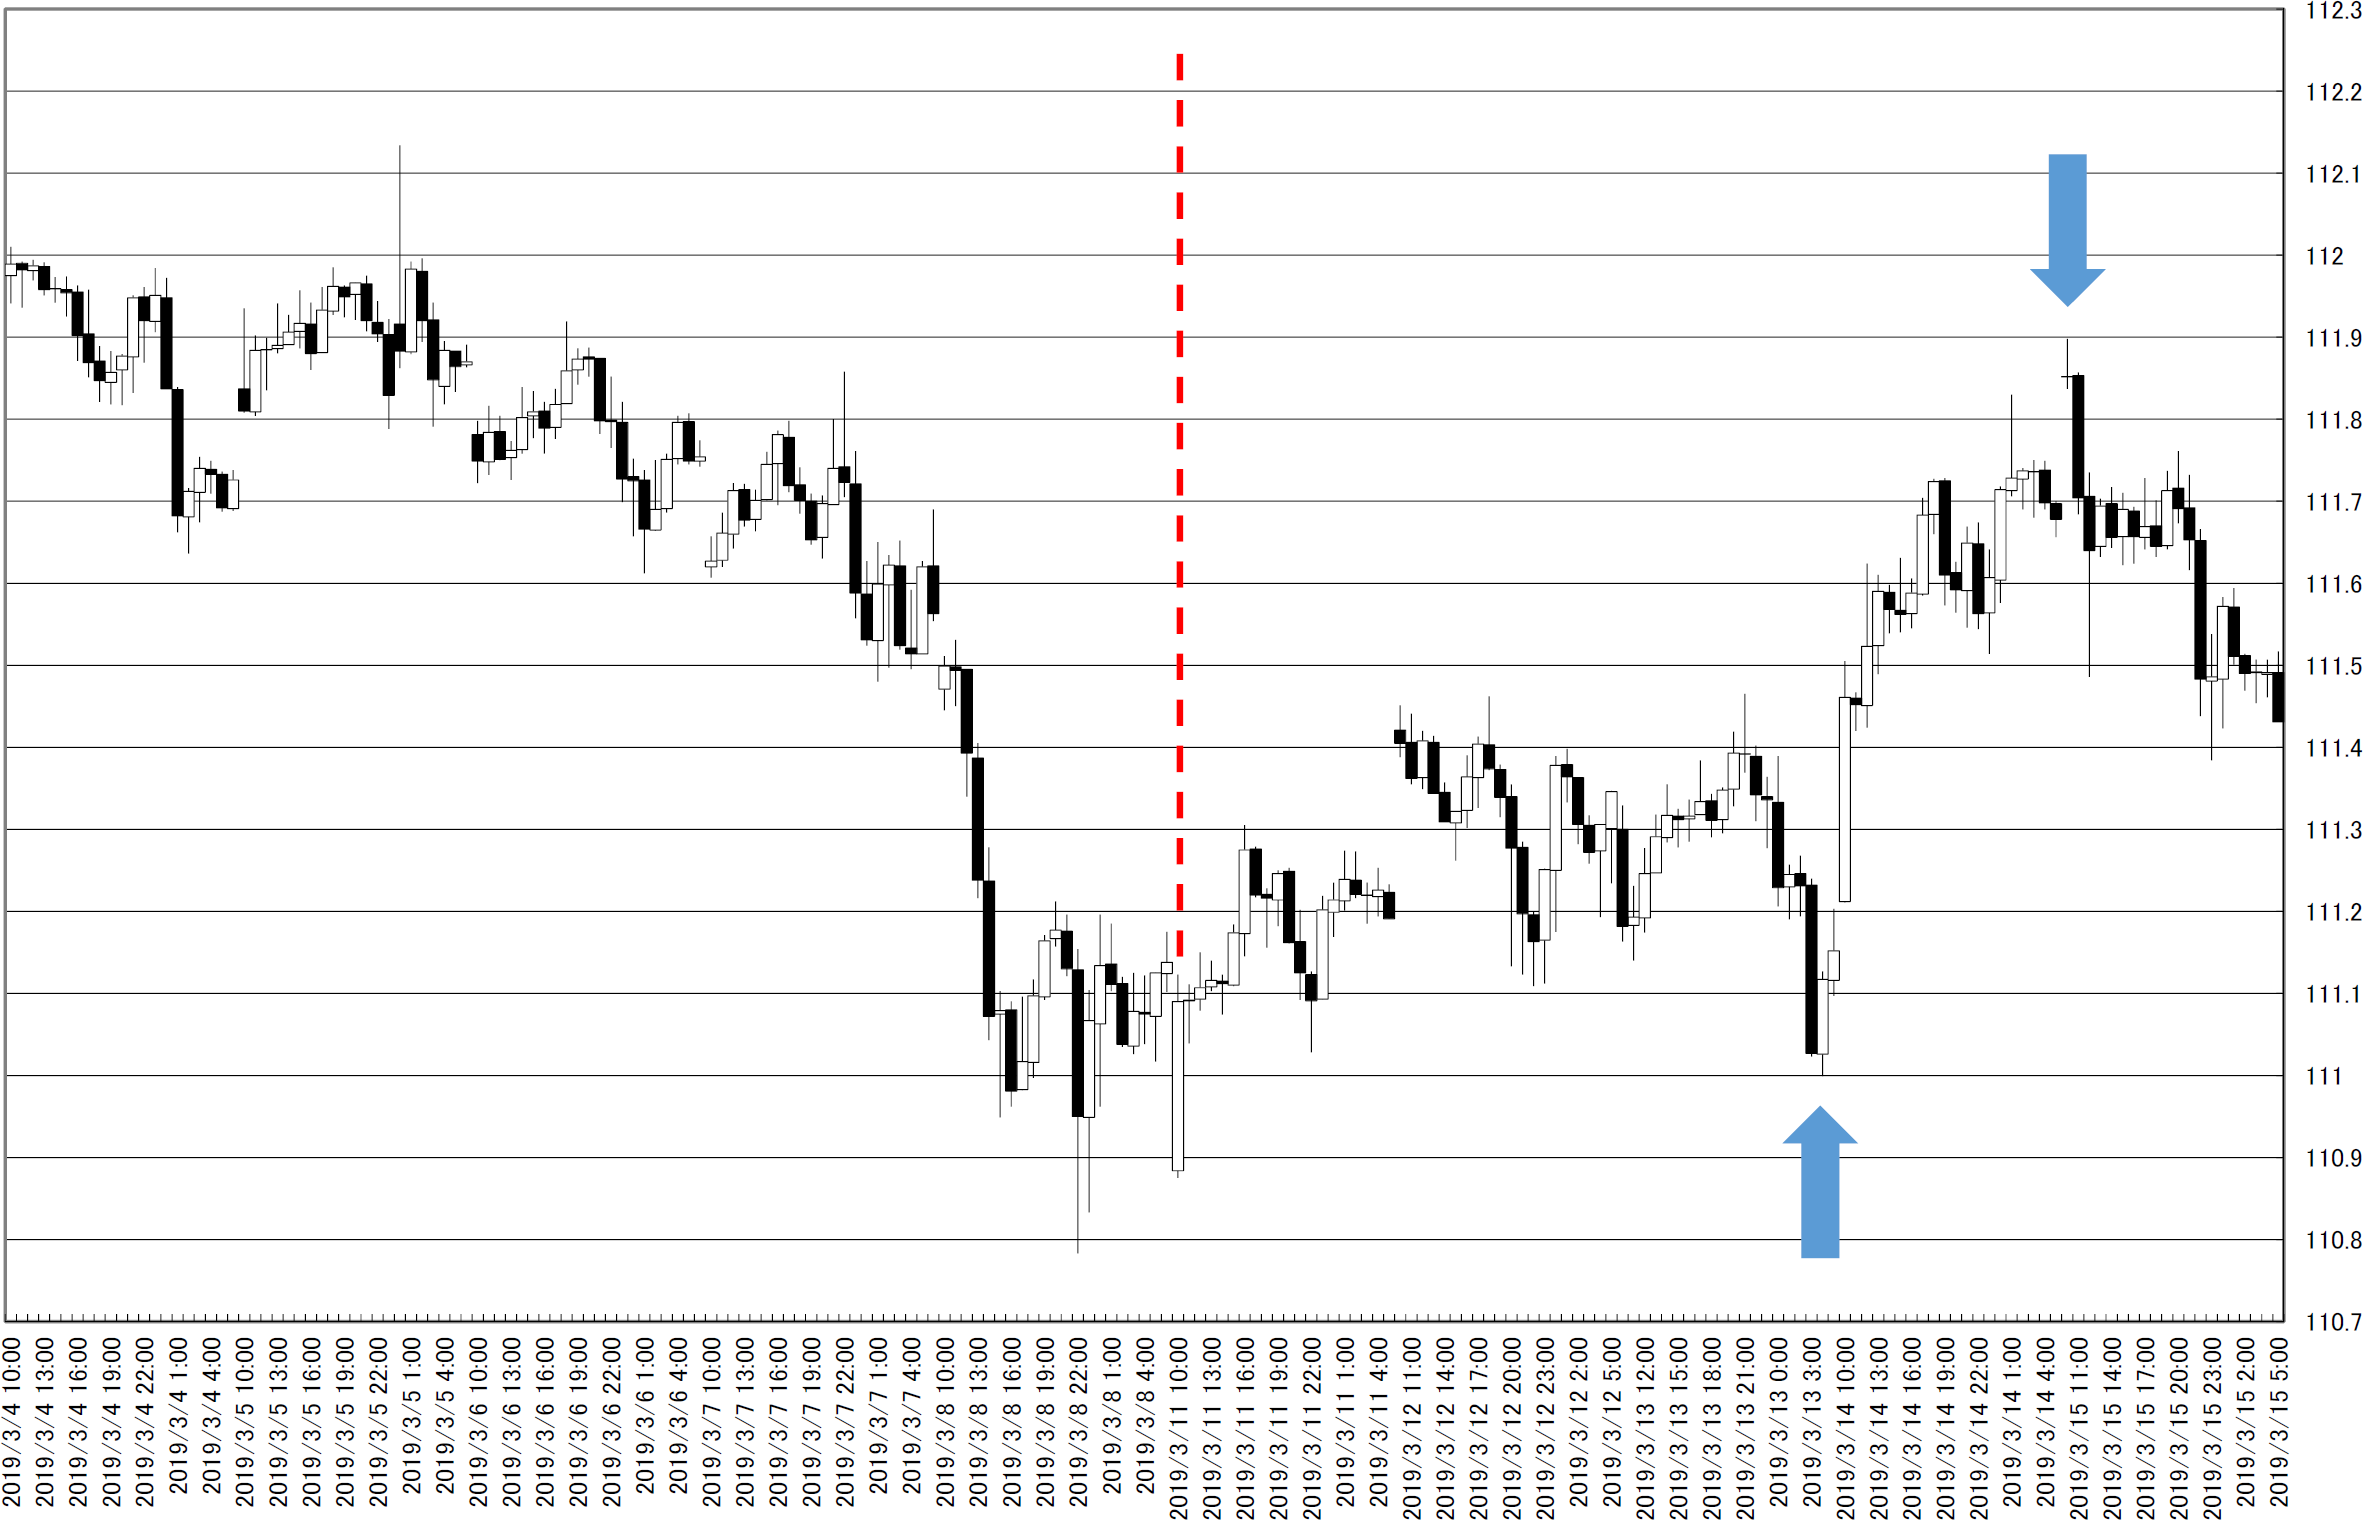
オセアニア時間帯抜きの足です。

111.5円evenの窓は埋まり、111.2円に別の新たな窓です。

108.20-30円に窓が残ります。

上に窓がないことがポイントです。

These are latest candle sticks without Oceania time.

111.5yen gap was buried.

Another new gap appeared 111.2yen around.

There remained gaps at 108.20.-30yen.

There are no gaps in upper side.

chart4_convchart5_conv


トレンドラインです。

オレンジや青を切っていくと下、緑を超えると上ということでしょう。

上は決定的な線という訳ではないと思います。

ならば下も?となります。

「どうせハラミだし~」です。

This is trend line analysis.

We can suggest some lines.

And these line may be fake.

chart6_conv


時間足を使用しオセアニア時間帯を省いたP&Fです。

45度線を割った訳ではありません。

「やっぱり上なのかな」とは思っています。

P&Fは嘘をつきません。柔軟にいきたいと思います。

This is 0.1 price change and 3 box reversal close price’s Point and Figure chart.

The price does not cut 45 degree support.

Now seems to be rally.

P&F does not lie and we can easily change our mind.

PF_conv


★★レポート作成時データのダウンロード★★

ブログで使用したデータをダウンロードしていただけます。

内容により非提供の場合があります。


相場分析のリクエストがありましたら“Contact Us”からお知らせください。ご要望にお応えできるように努力いたします。

このブログはあくまでも個人的な見解であり、投資判断は各自でお願い致します。当ブログは一切の投資損益に対する責任を負いません。

ブログに来て下さってありがとうございます。明日もよろしくお願いいたします。

If you have some request to analyze, please write to “Contact Us”.

We do best effort for your request.

These are only personal opinions on this blog, and you need the investment judgment in each one. This blog doesn’t assume the responsibility to all the investment profit and loss.

Thank for watching our contents. My best regards next day.

如果您需要行情分析,请点击“Contact Us”联系我们。我们将尽力满足您的要求。

本博客仅为个人意见,请各自做出投资判断。本博客概不对任何投资盈亏负责。

感谢您访问本博客。欢迎再次使用。

© 2026 Retar