ドル円 : 美元/日元 : USD/JPY

ドル円1時間足・上値は重そうだが、110.30円から112.20-30円のレンジ相場

2019/03/11

ドル円1時間足・上値は重そうだが、110.30円から112.20-30円のレンジ相場

USDJPY hourly; rally will be difficult and the range will be from 112.30-20yen to 110.30yen.

美元/日元。反弹将是困难的。范围将从112.30-20日元到110.30日元。


今週の結論は、112.20-30円から110.3円までのレンジ。

もう一度、上下を舐めてから、離れになるとはみています。

Our conclusion is the range will be from 112.30-20yen to 110.30yen.

The price will take higher or lower and will launch.


「ドル円1時間足・買方優位・持ち合いからの上方ブレーク・111.30-40円をサポートに112.3円まで伸びそう」(2019/3/4)

上に届かず下にサポートを切ったため、上値の重さが出るはずです。

We reported “USDJPY hourly; now is upside break; 111.30-40 yen will be support and the target will be 112.3yen around” in 3/4/2019.

The price did not reach the target and cut the support. This occasion will mean “Rally will be difficult”.
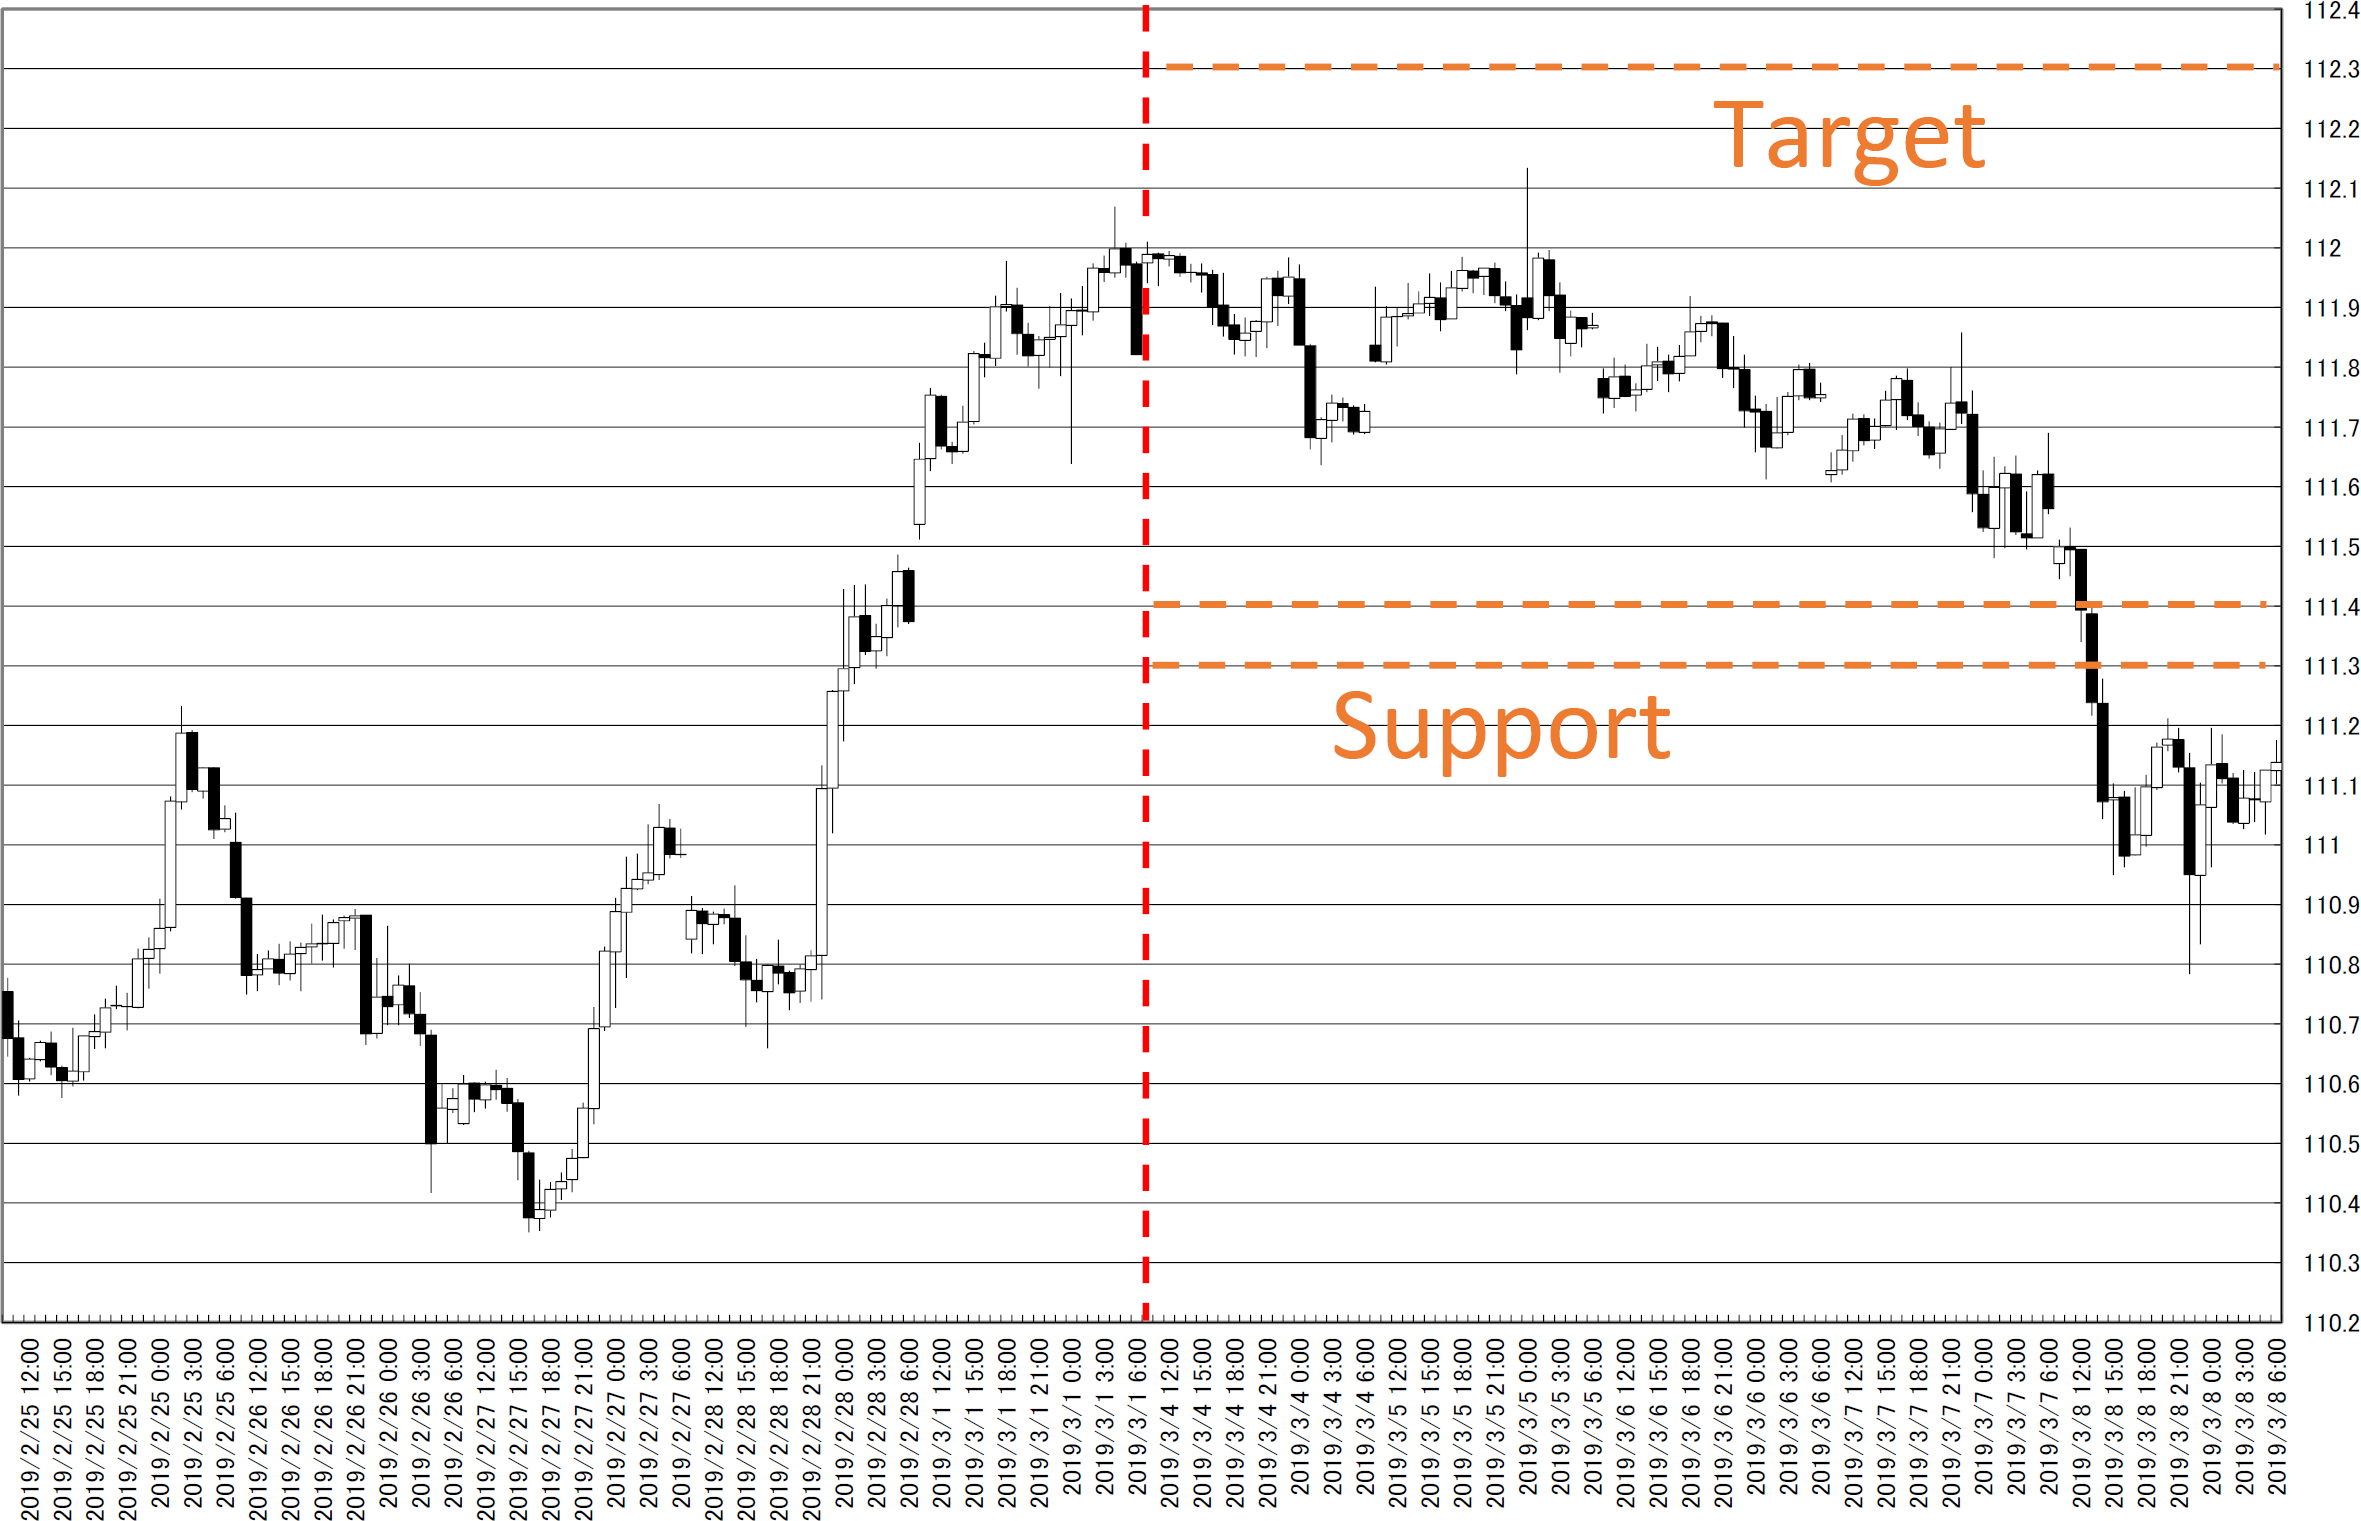
chart0_conv


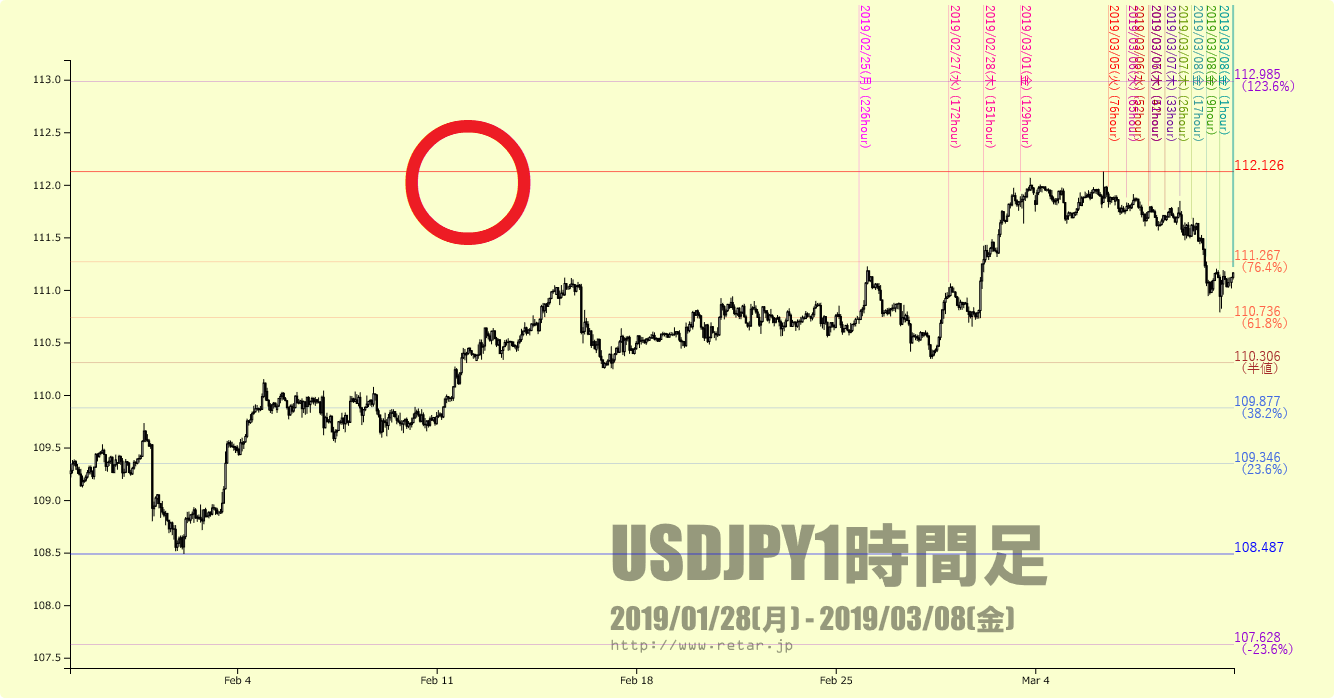
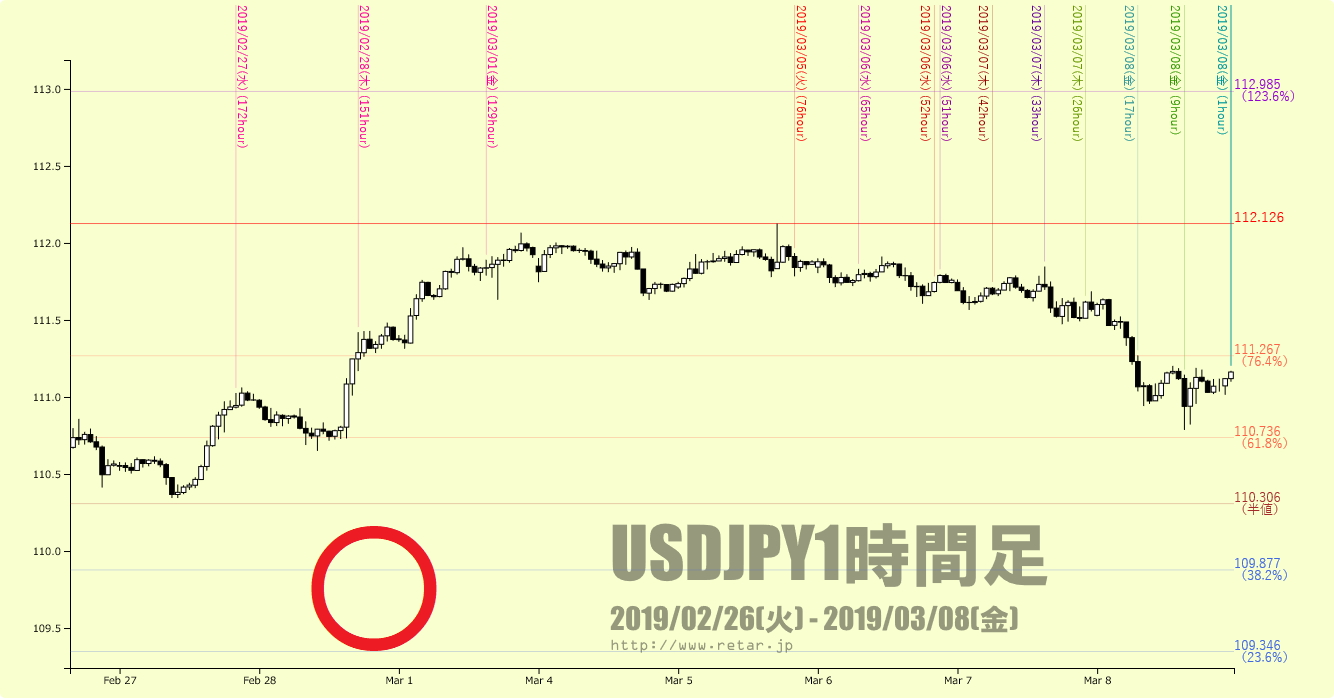
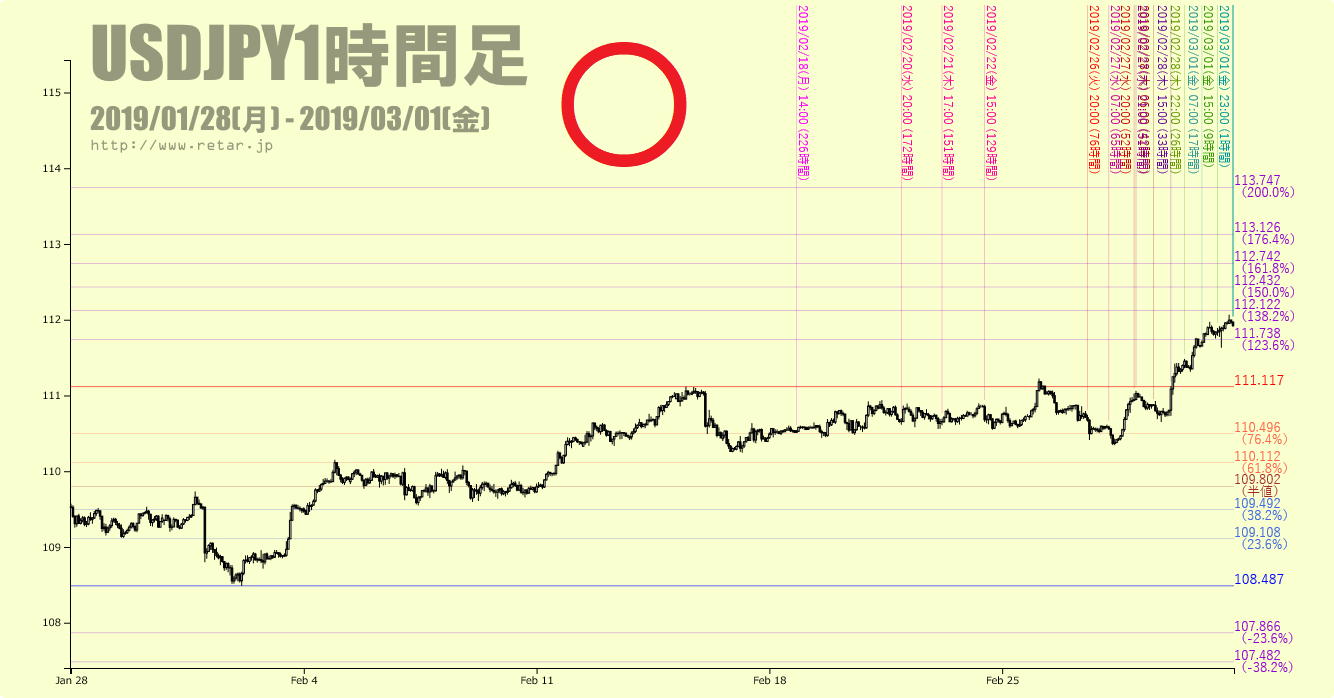
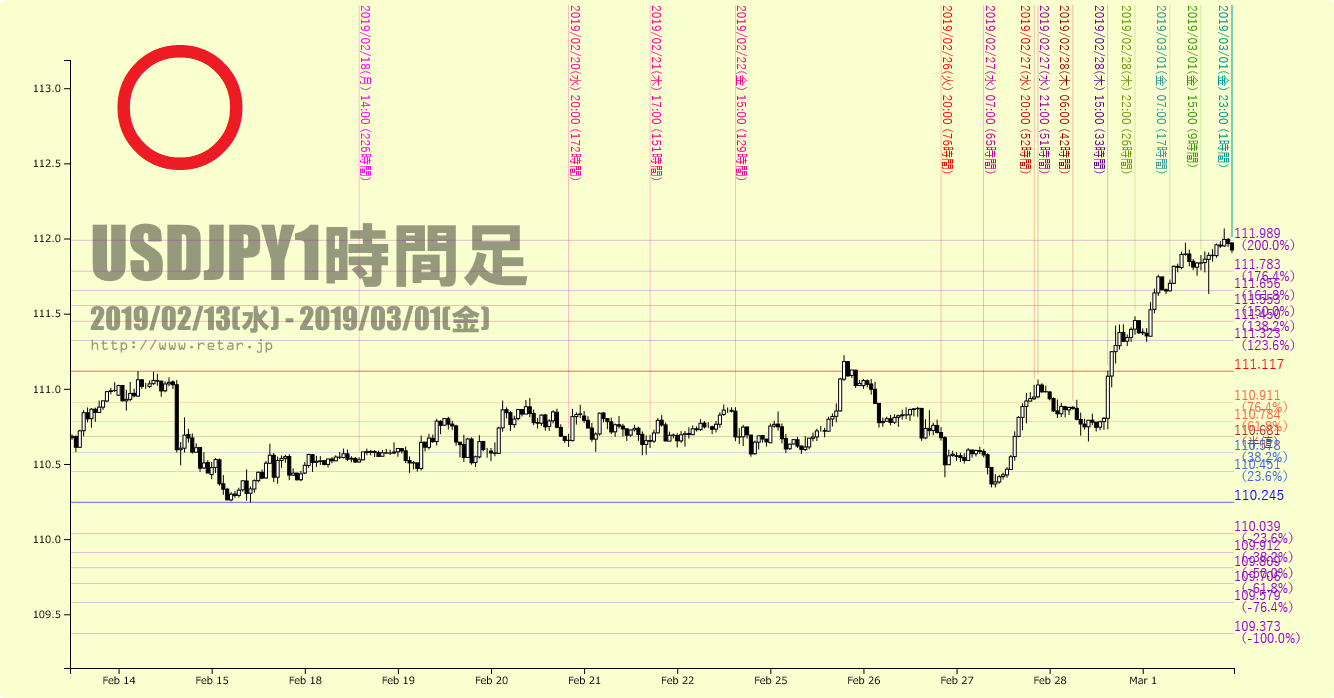
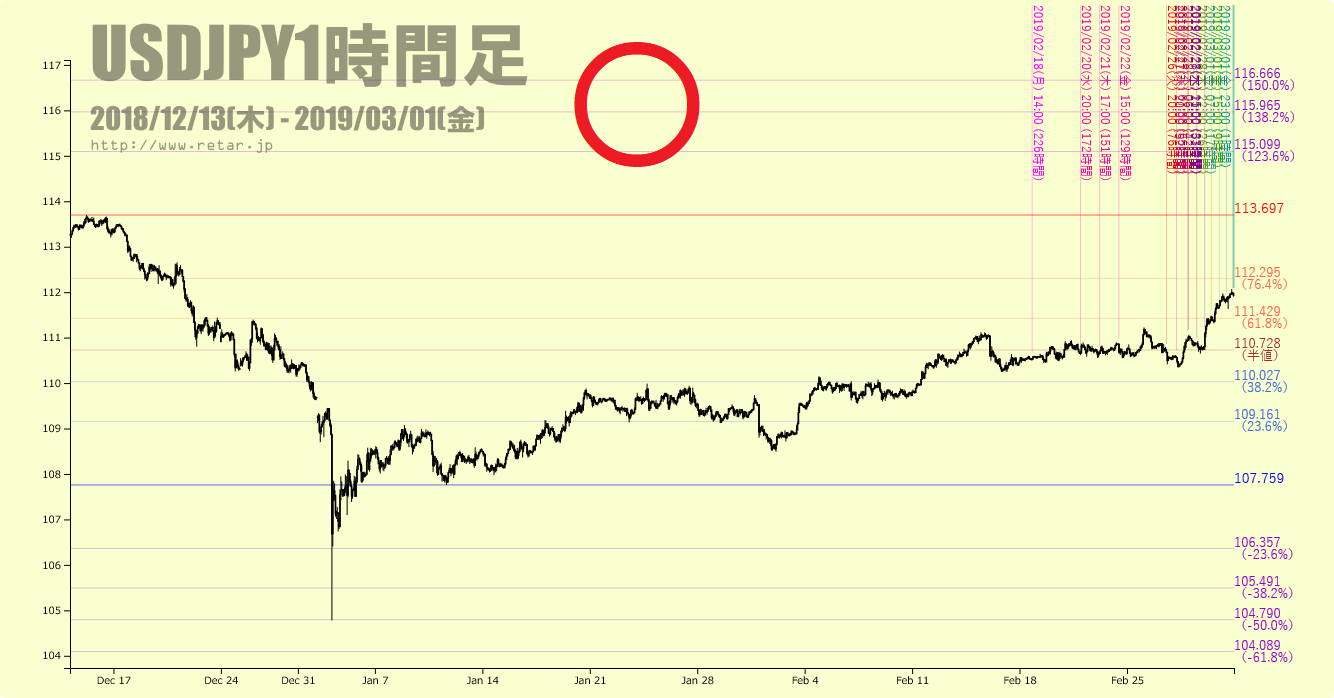
直近のフィボナッチと大枠のフィボナッチです。

適切なフィボナッチに「〇」、不適切なものには「×」をつけています。

一番大枠のチャートの61.8%が110.30円です。

この地点がサポートでしょう。

These are four types of Fibonacci.

Proper Fibonacci are “〇”.

And inadequate Fibonacci are “×”.

The major chart’s 61.8% support is 110.30yen.

This zone will work well.
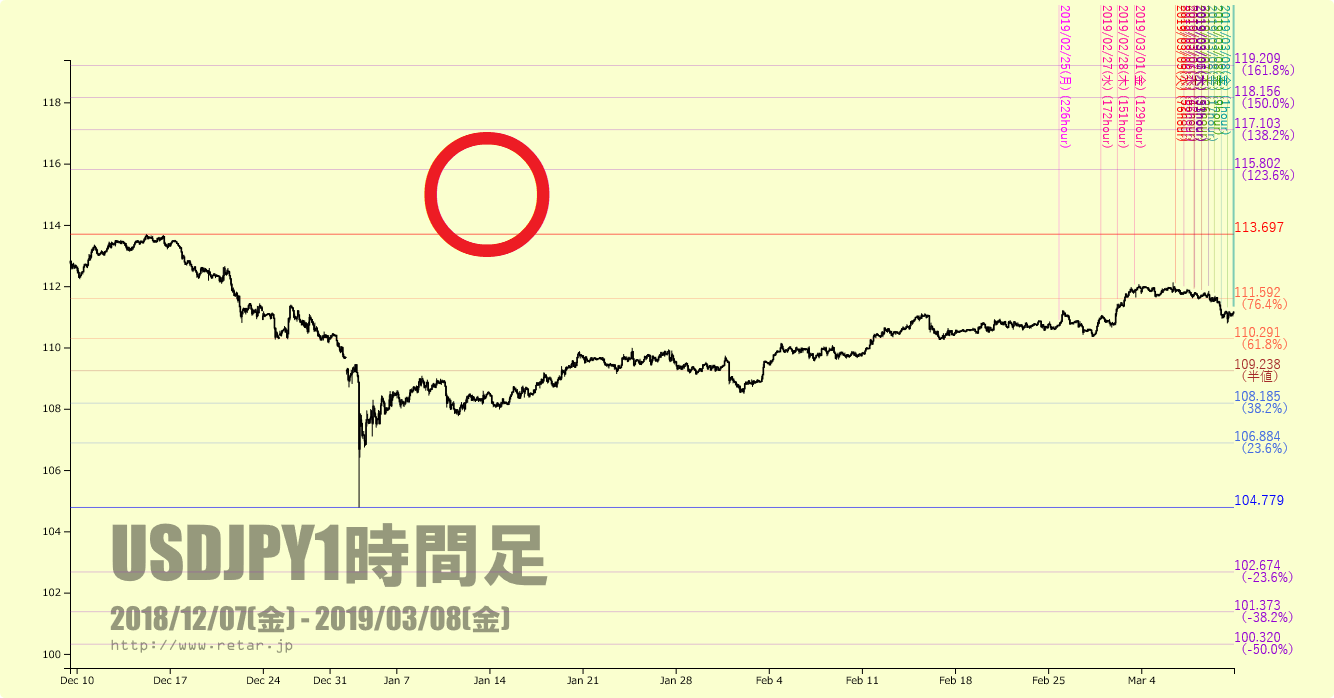
chart1_convchart2_convchart3_conv


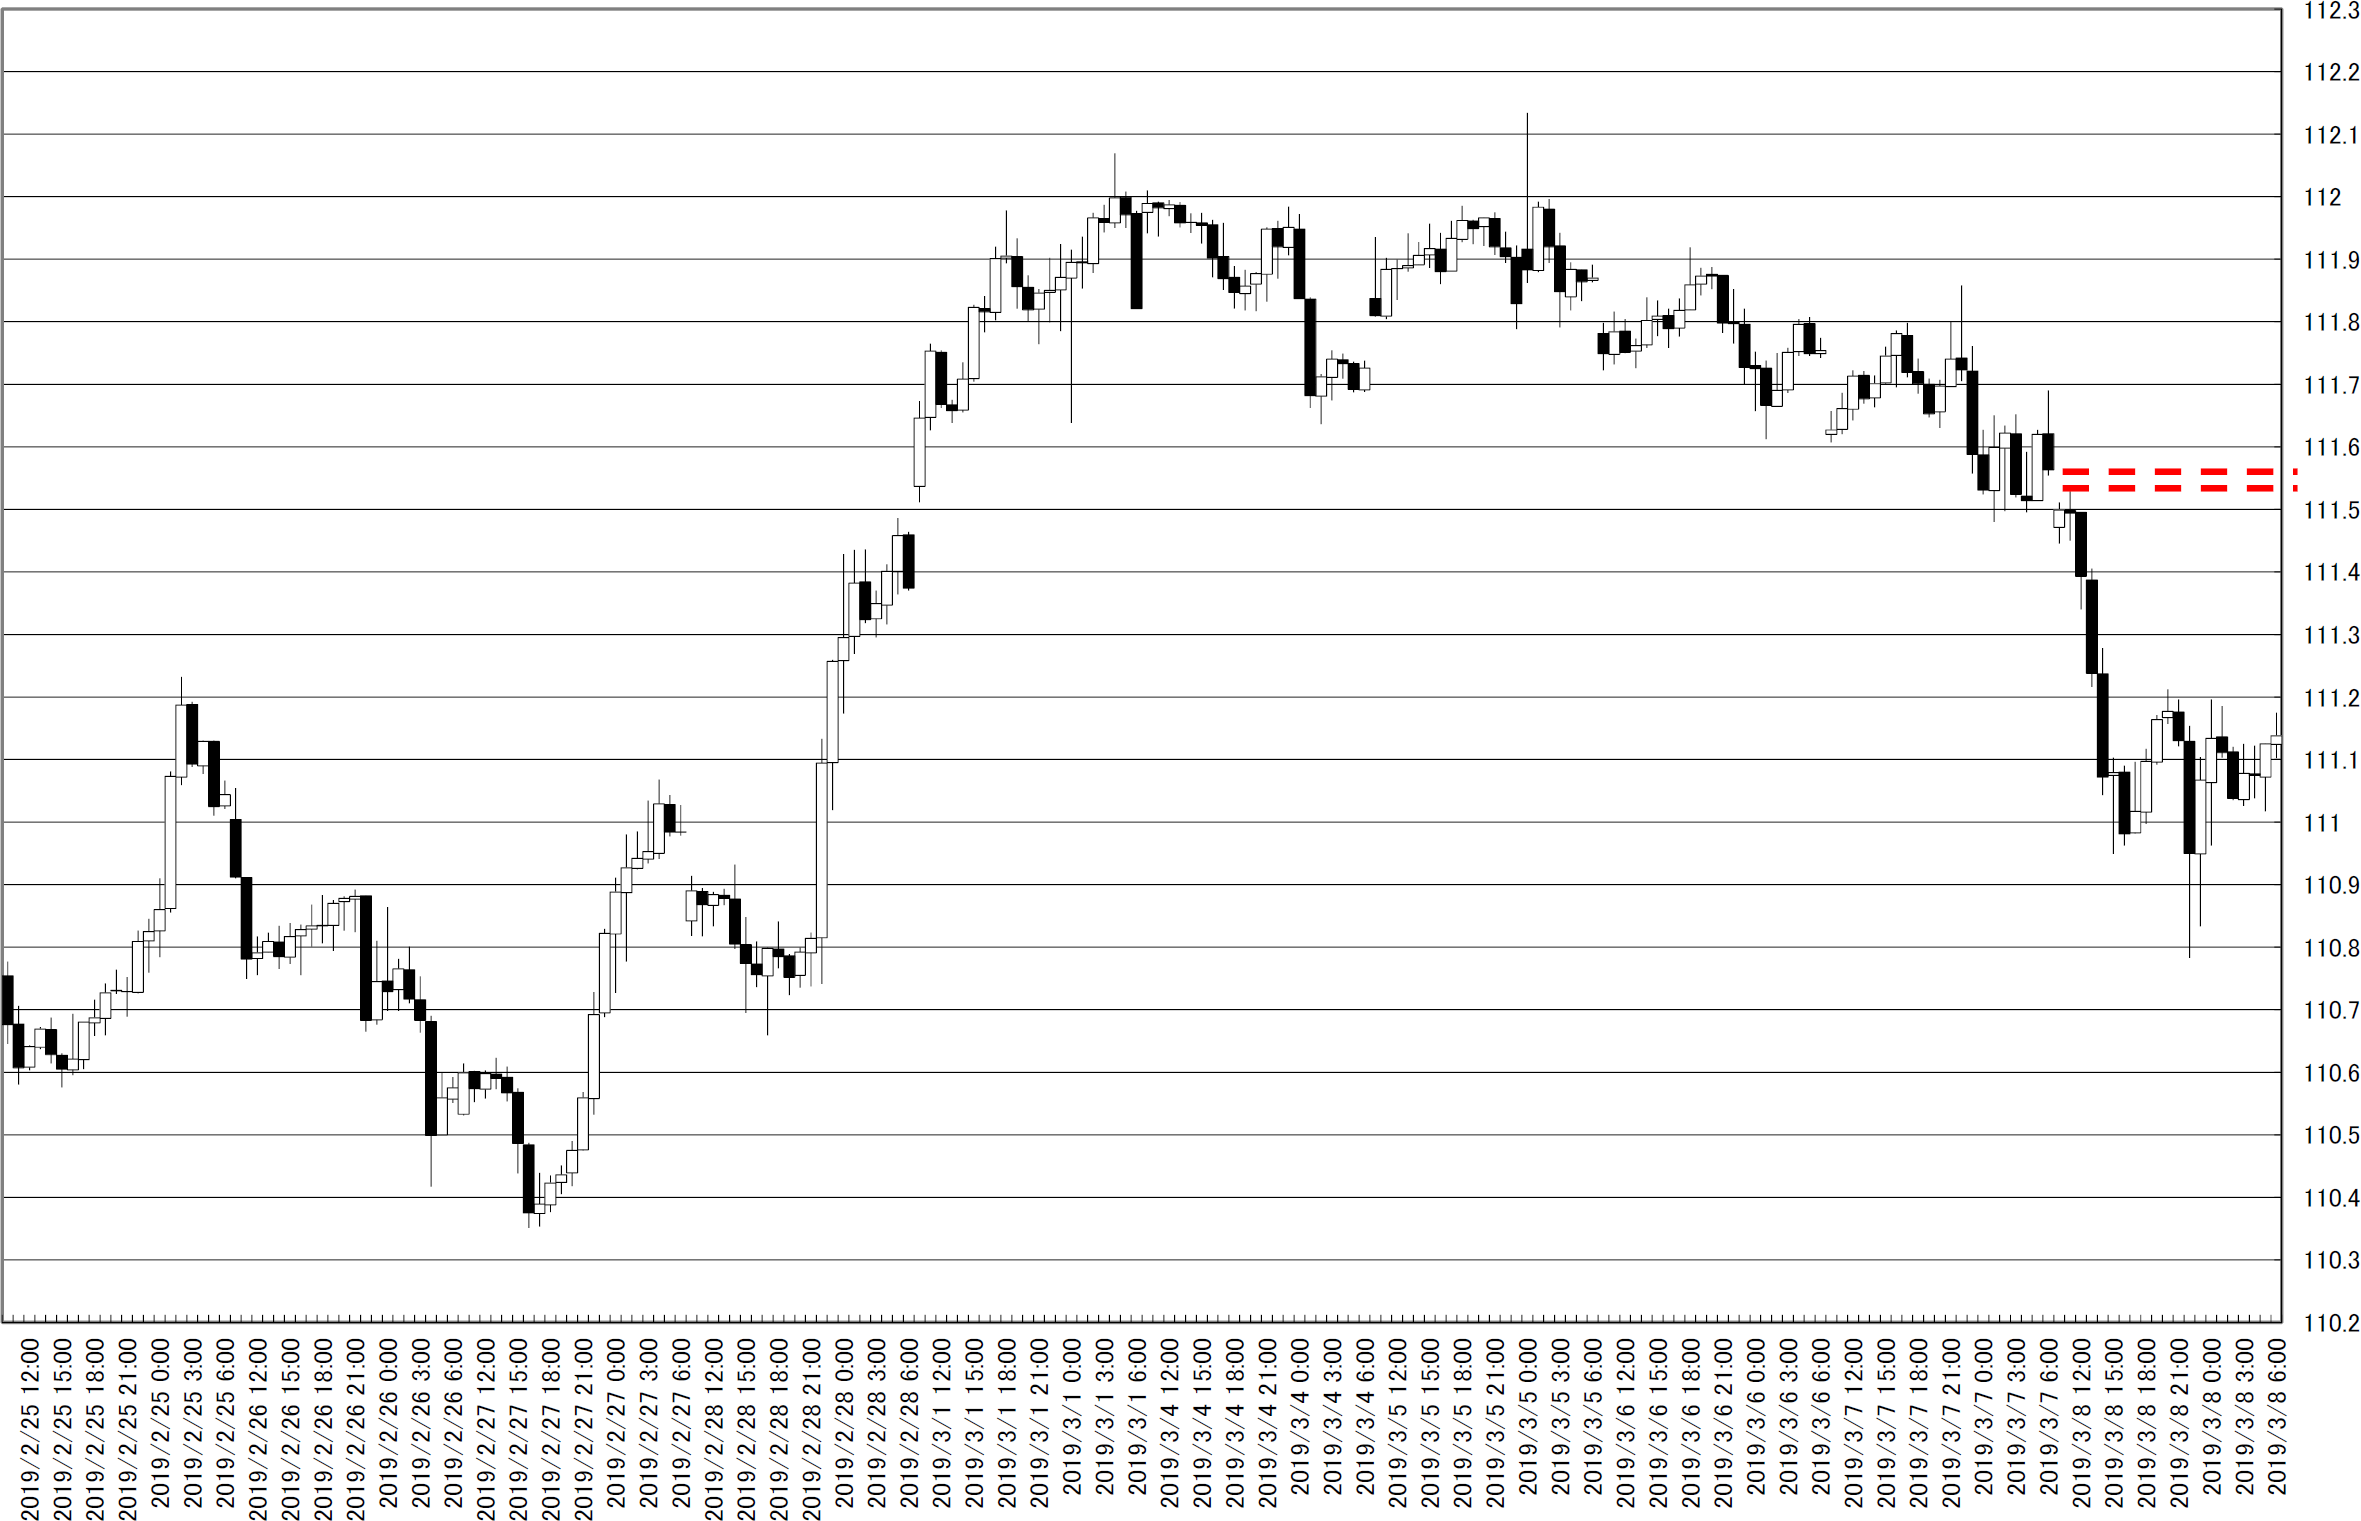
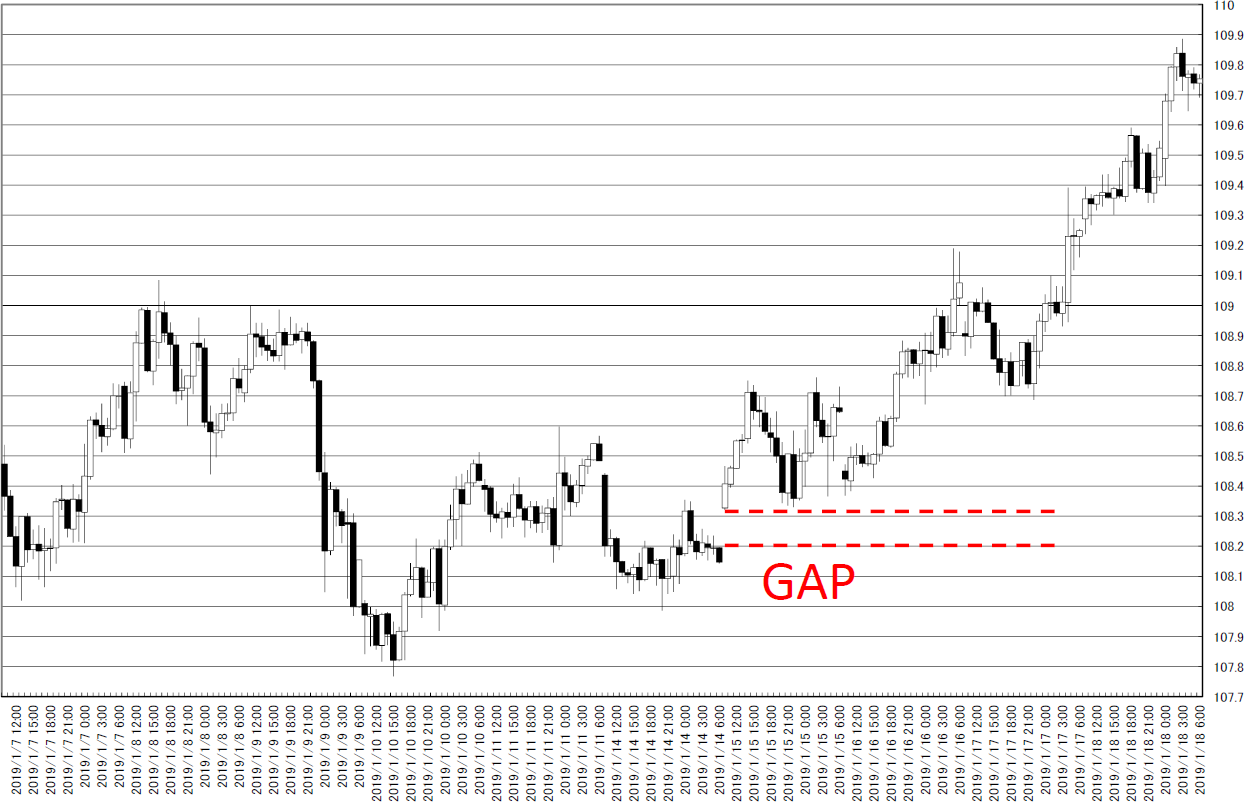
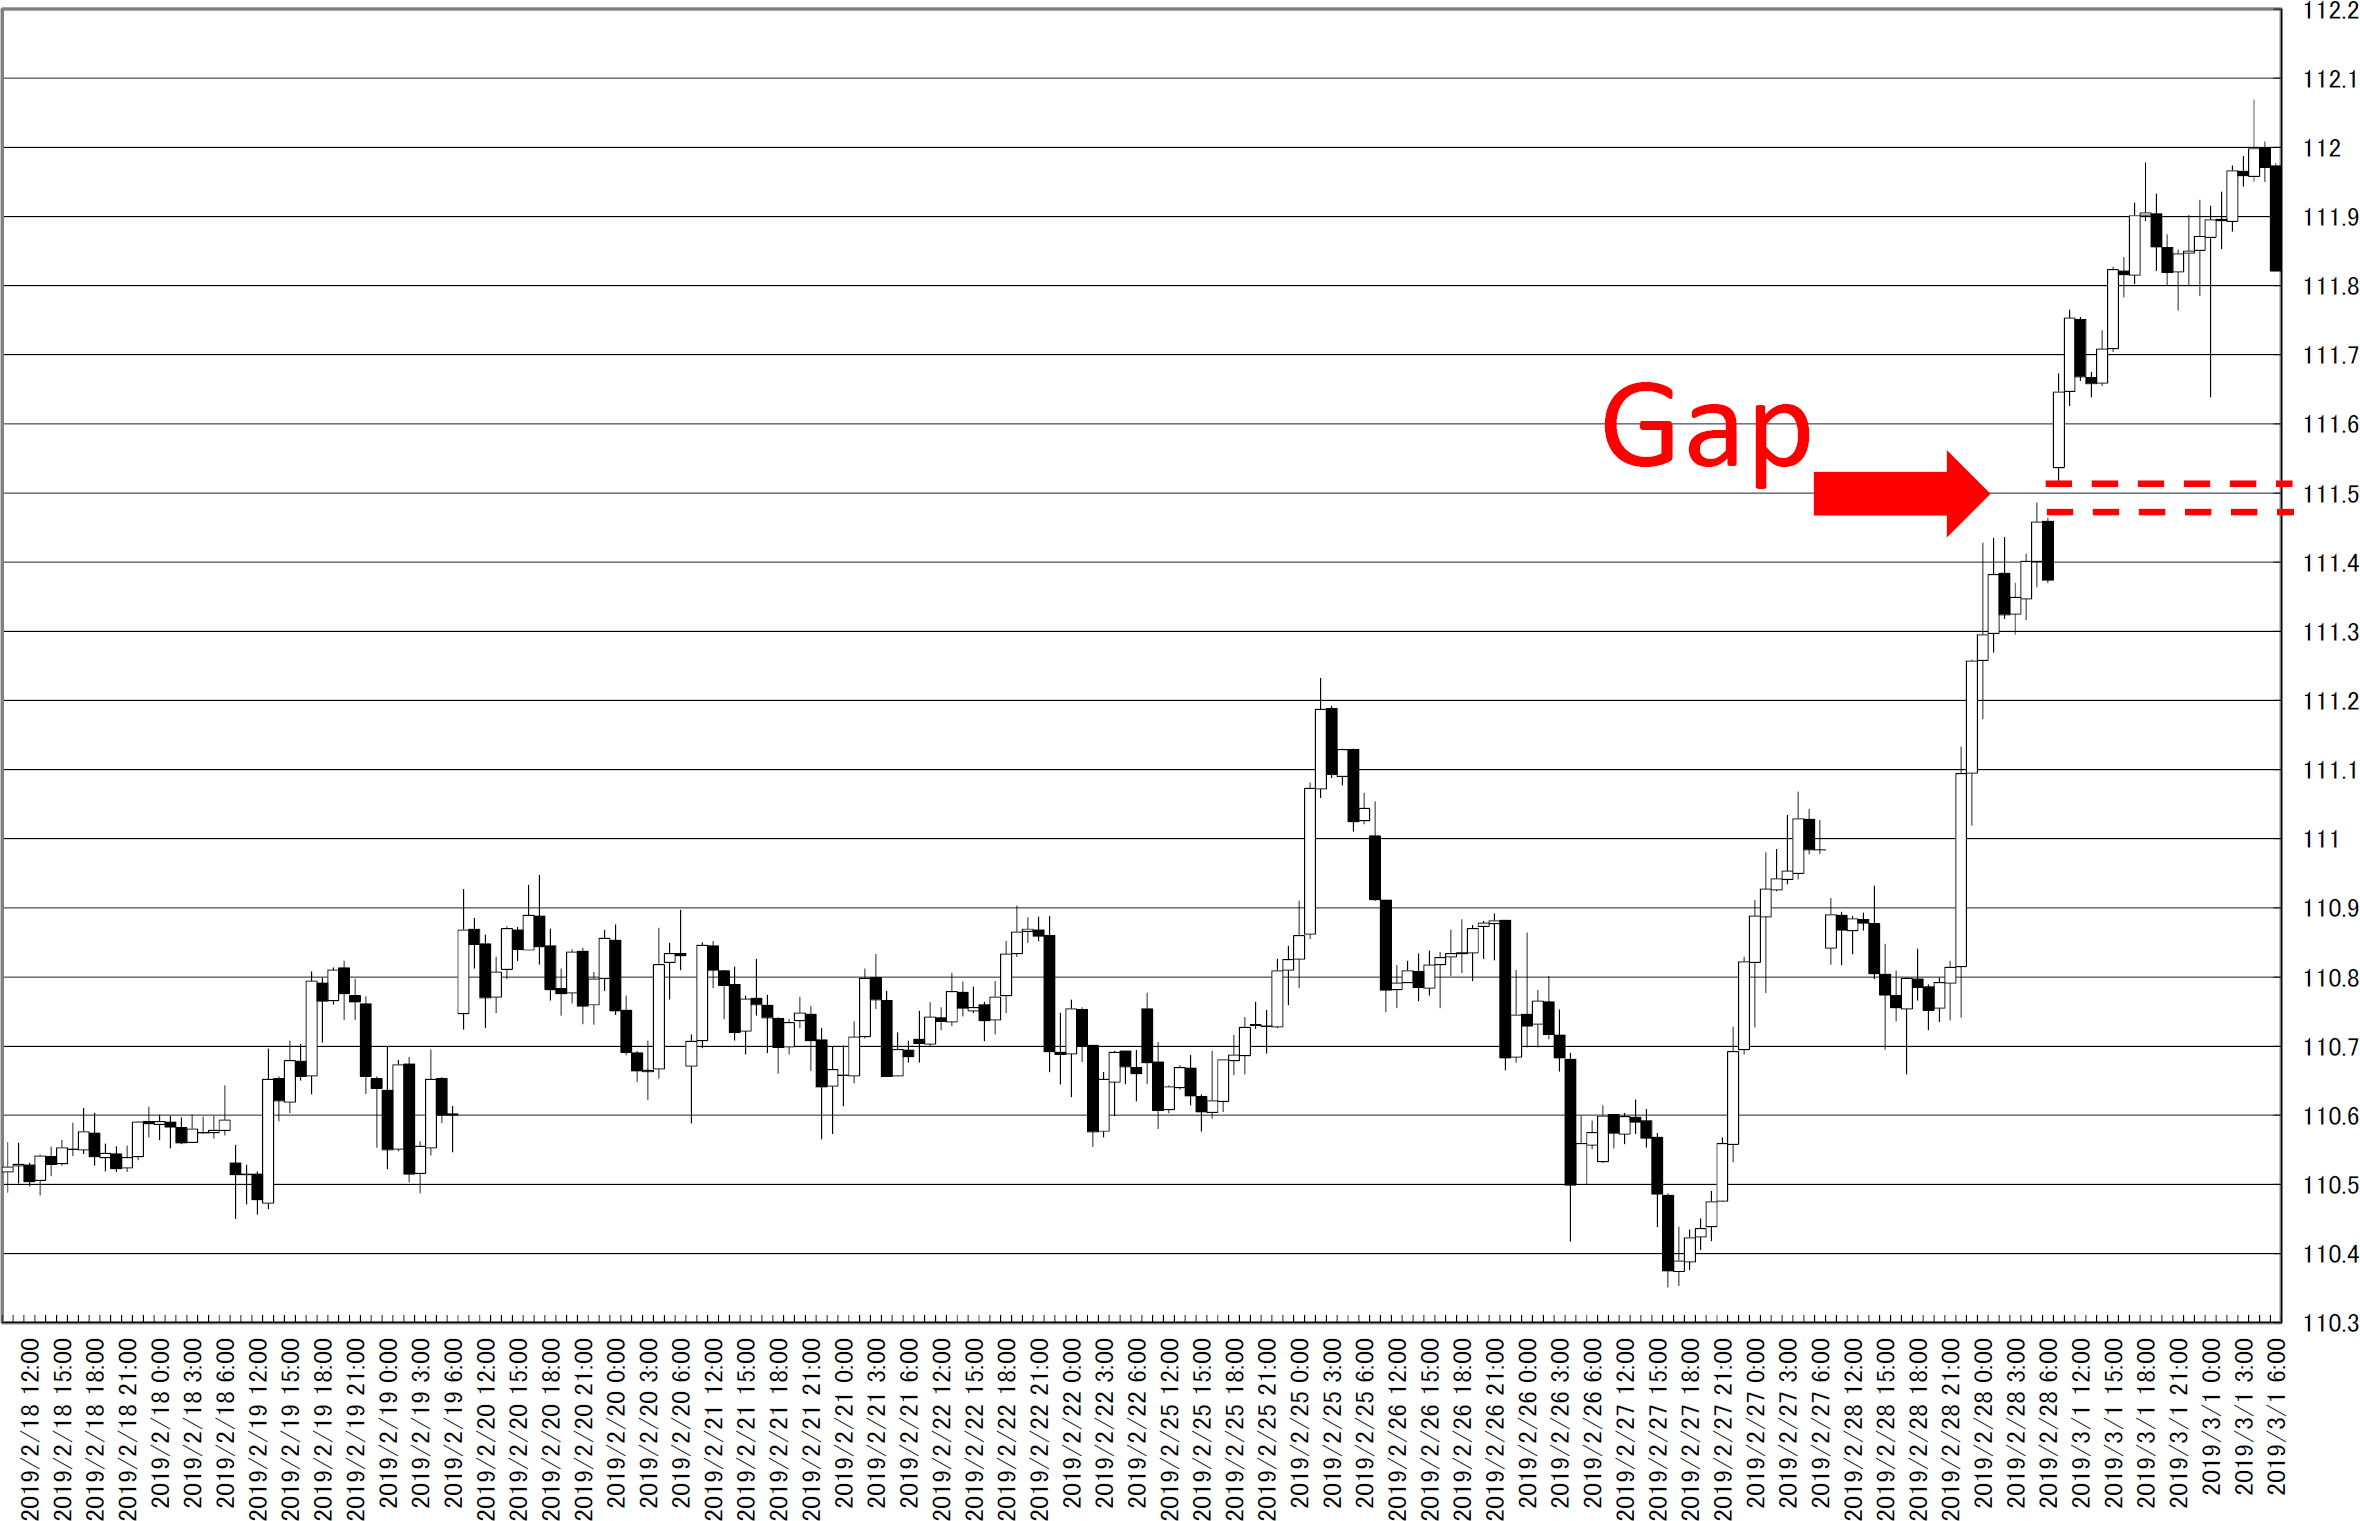
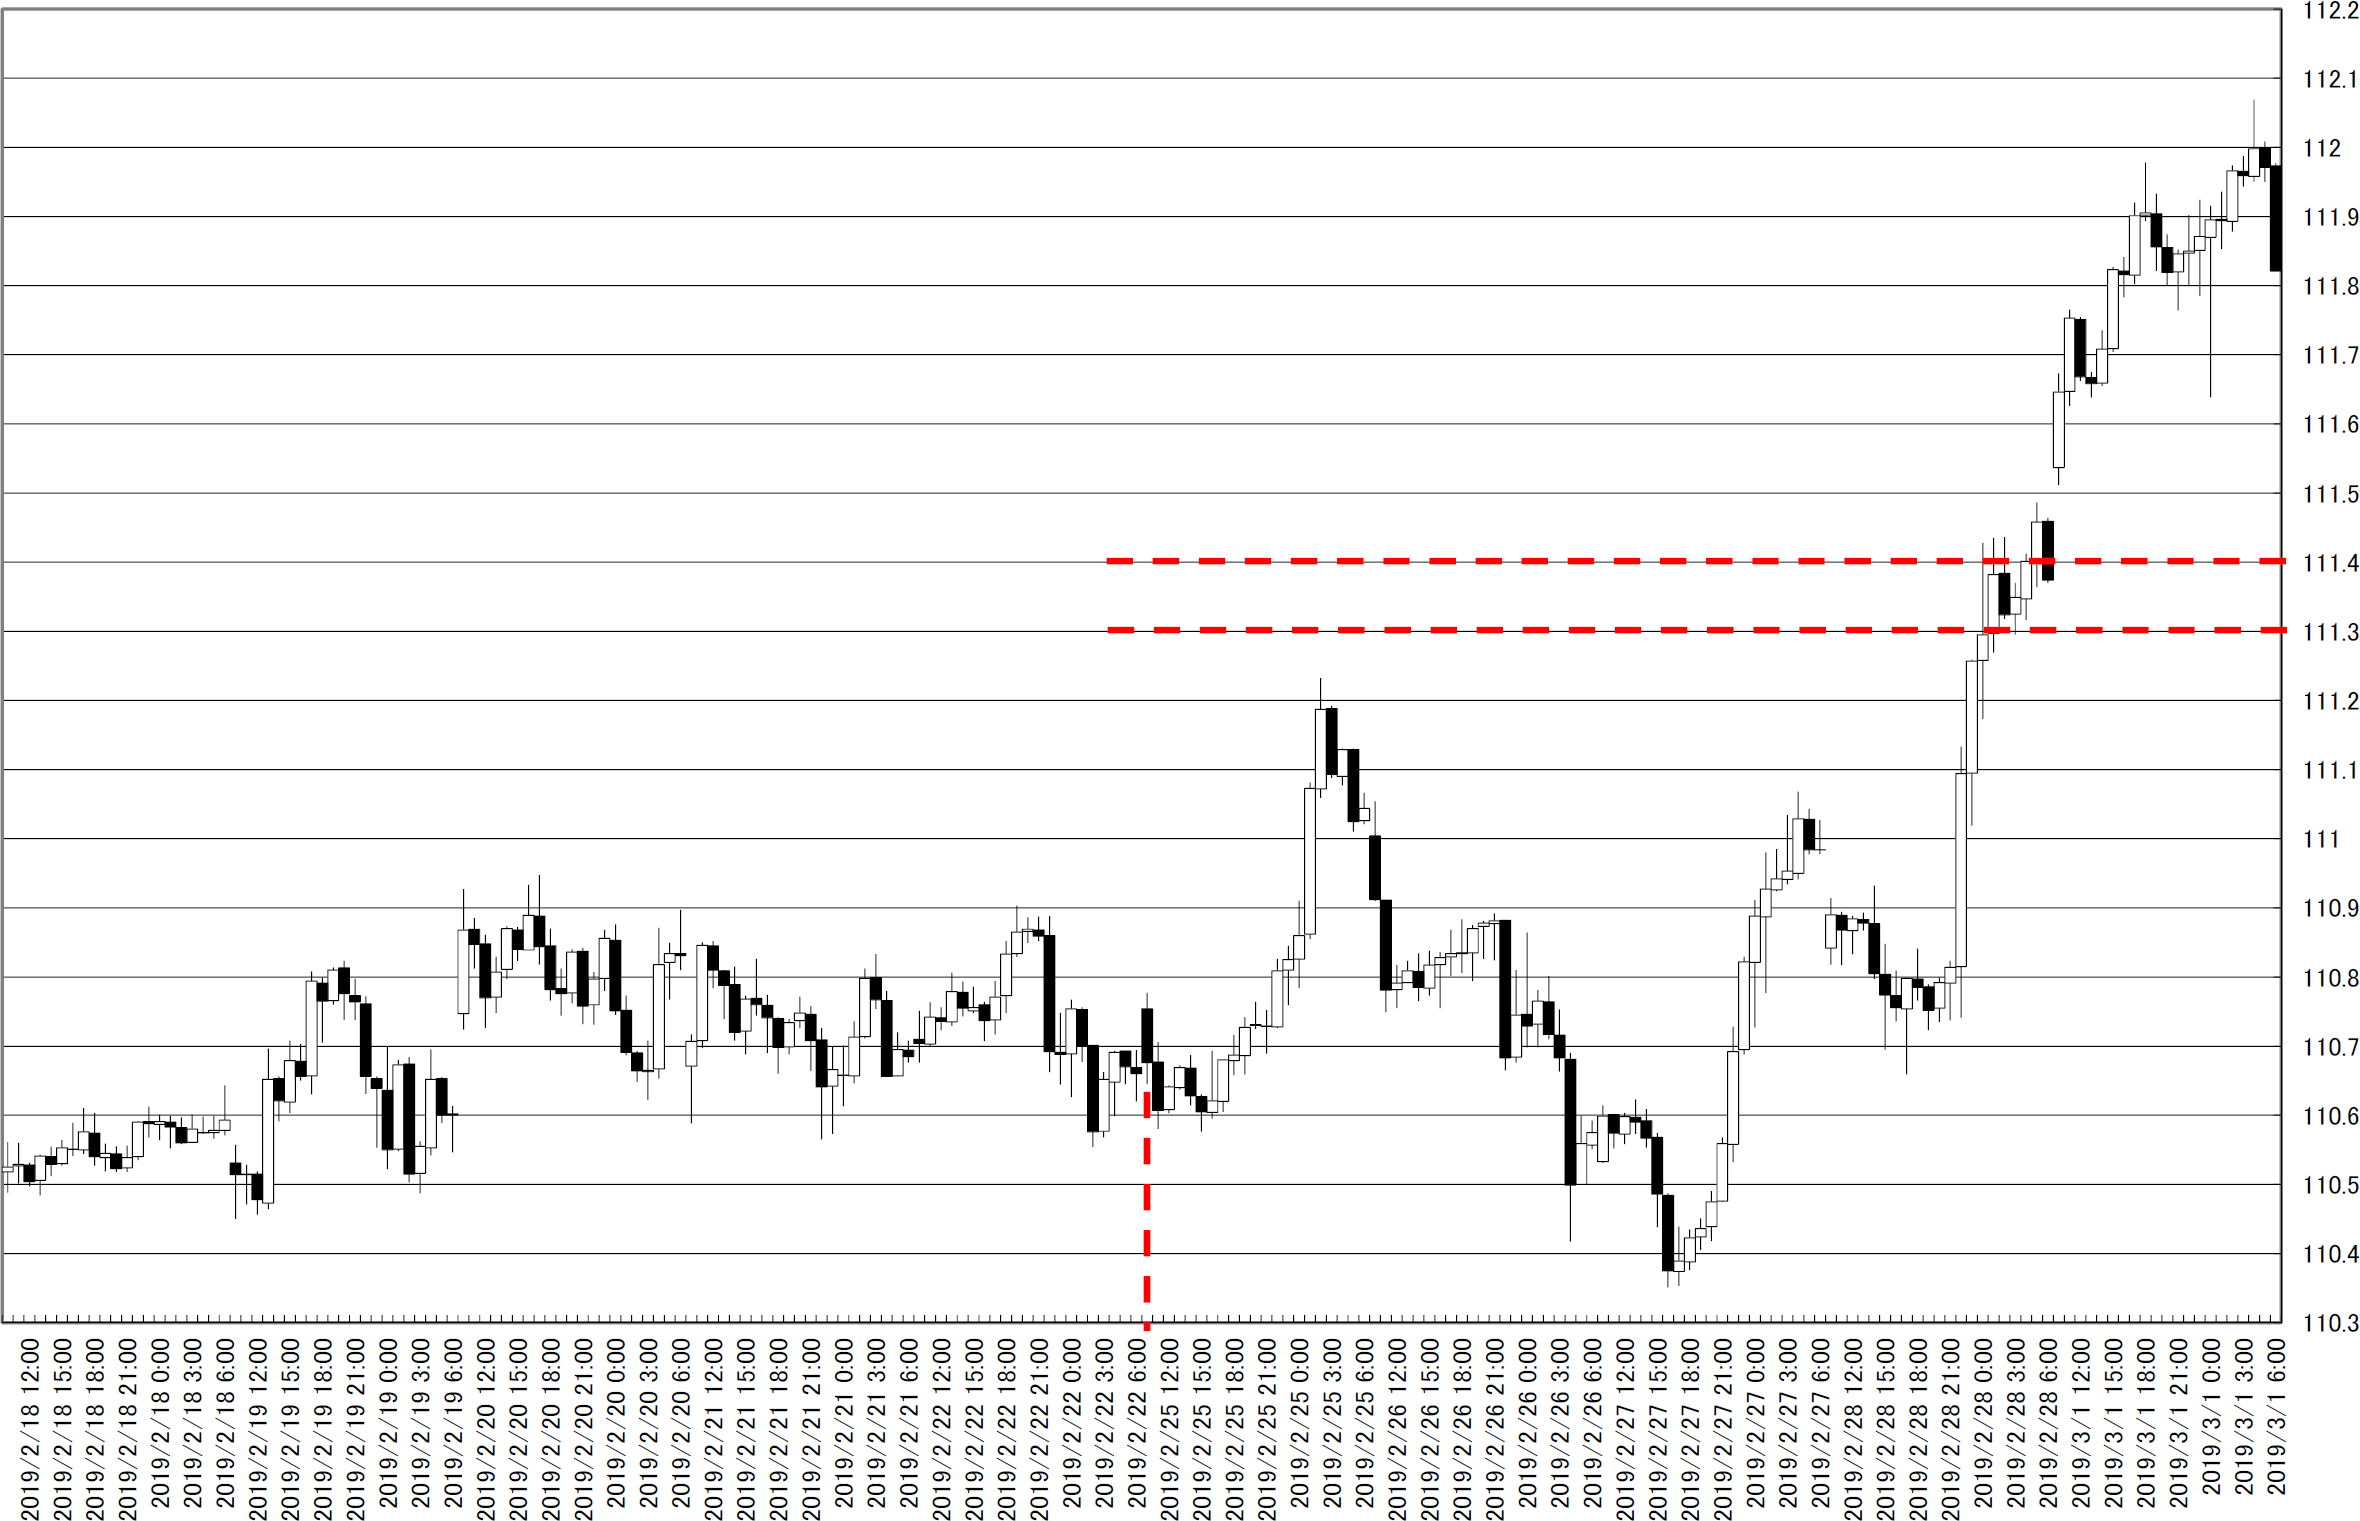
オセアニア時間帯抜きの足です。

111.5円evenの窓は埋まり、111.5円に別の新たな窓です。

108.20-30円に窓が残ります。

These are latest candle sticks without Oceania time.

111.5yen gap was buried.

Another new gap appeared 111.5yen around.

There remained gaps at 108.20.-30yen.
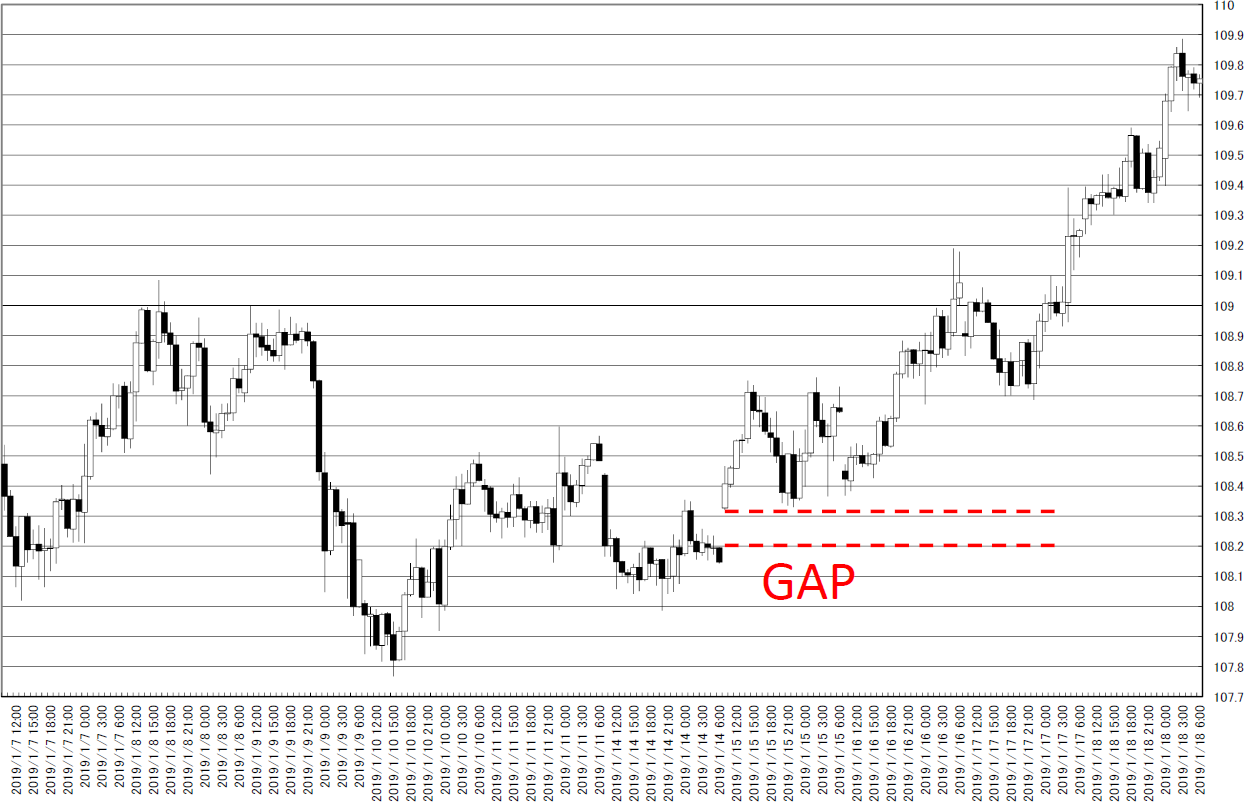
chart4_convchart5_conv


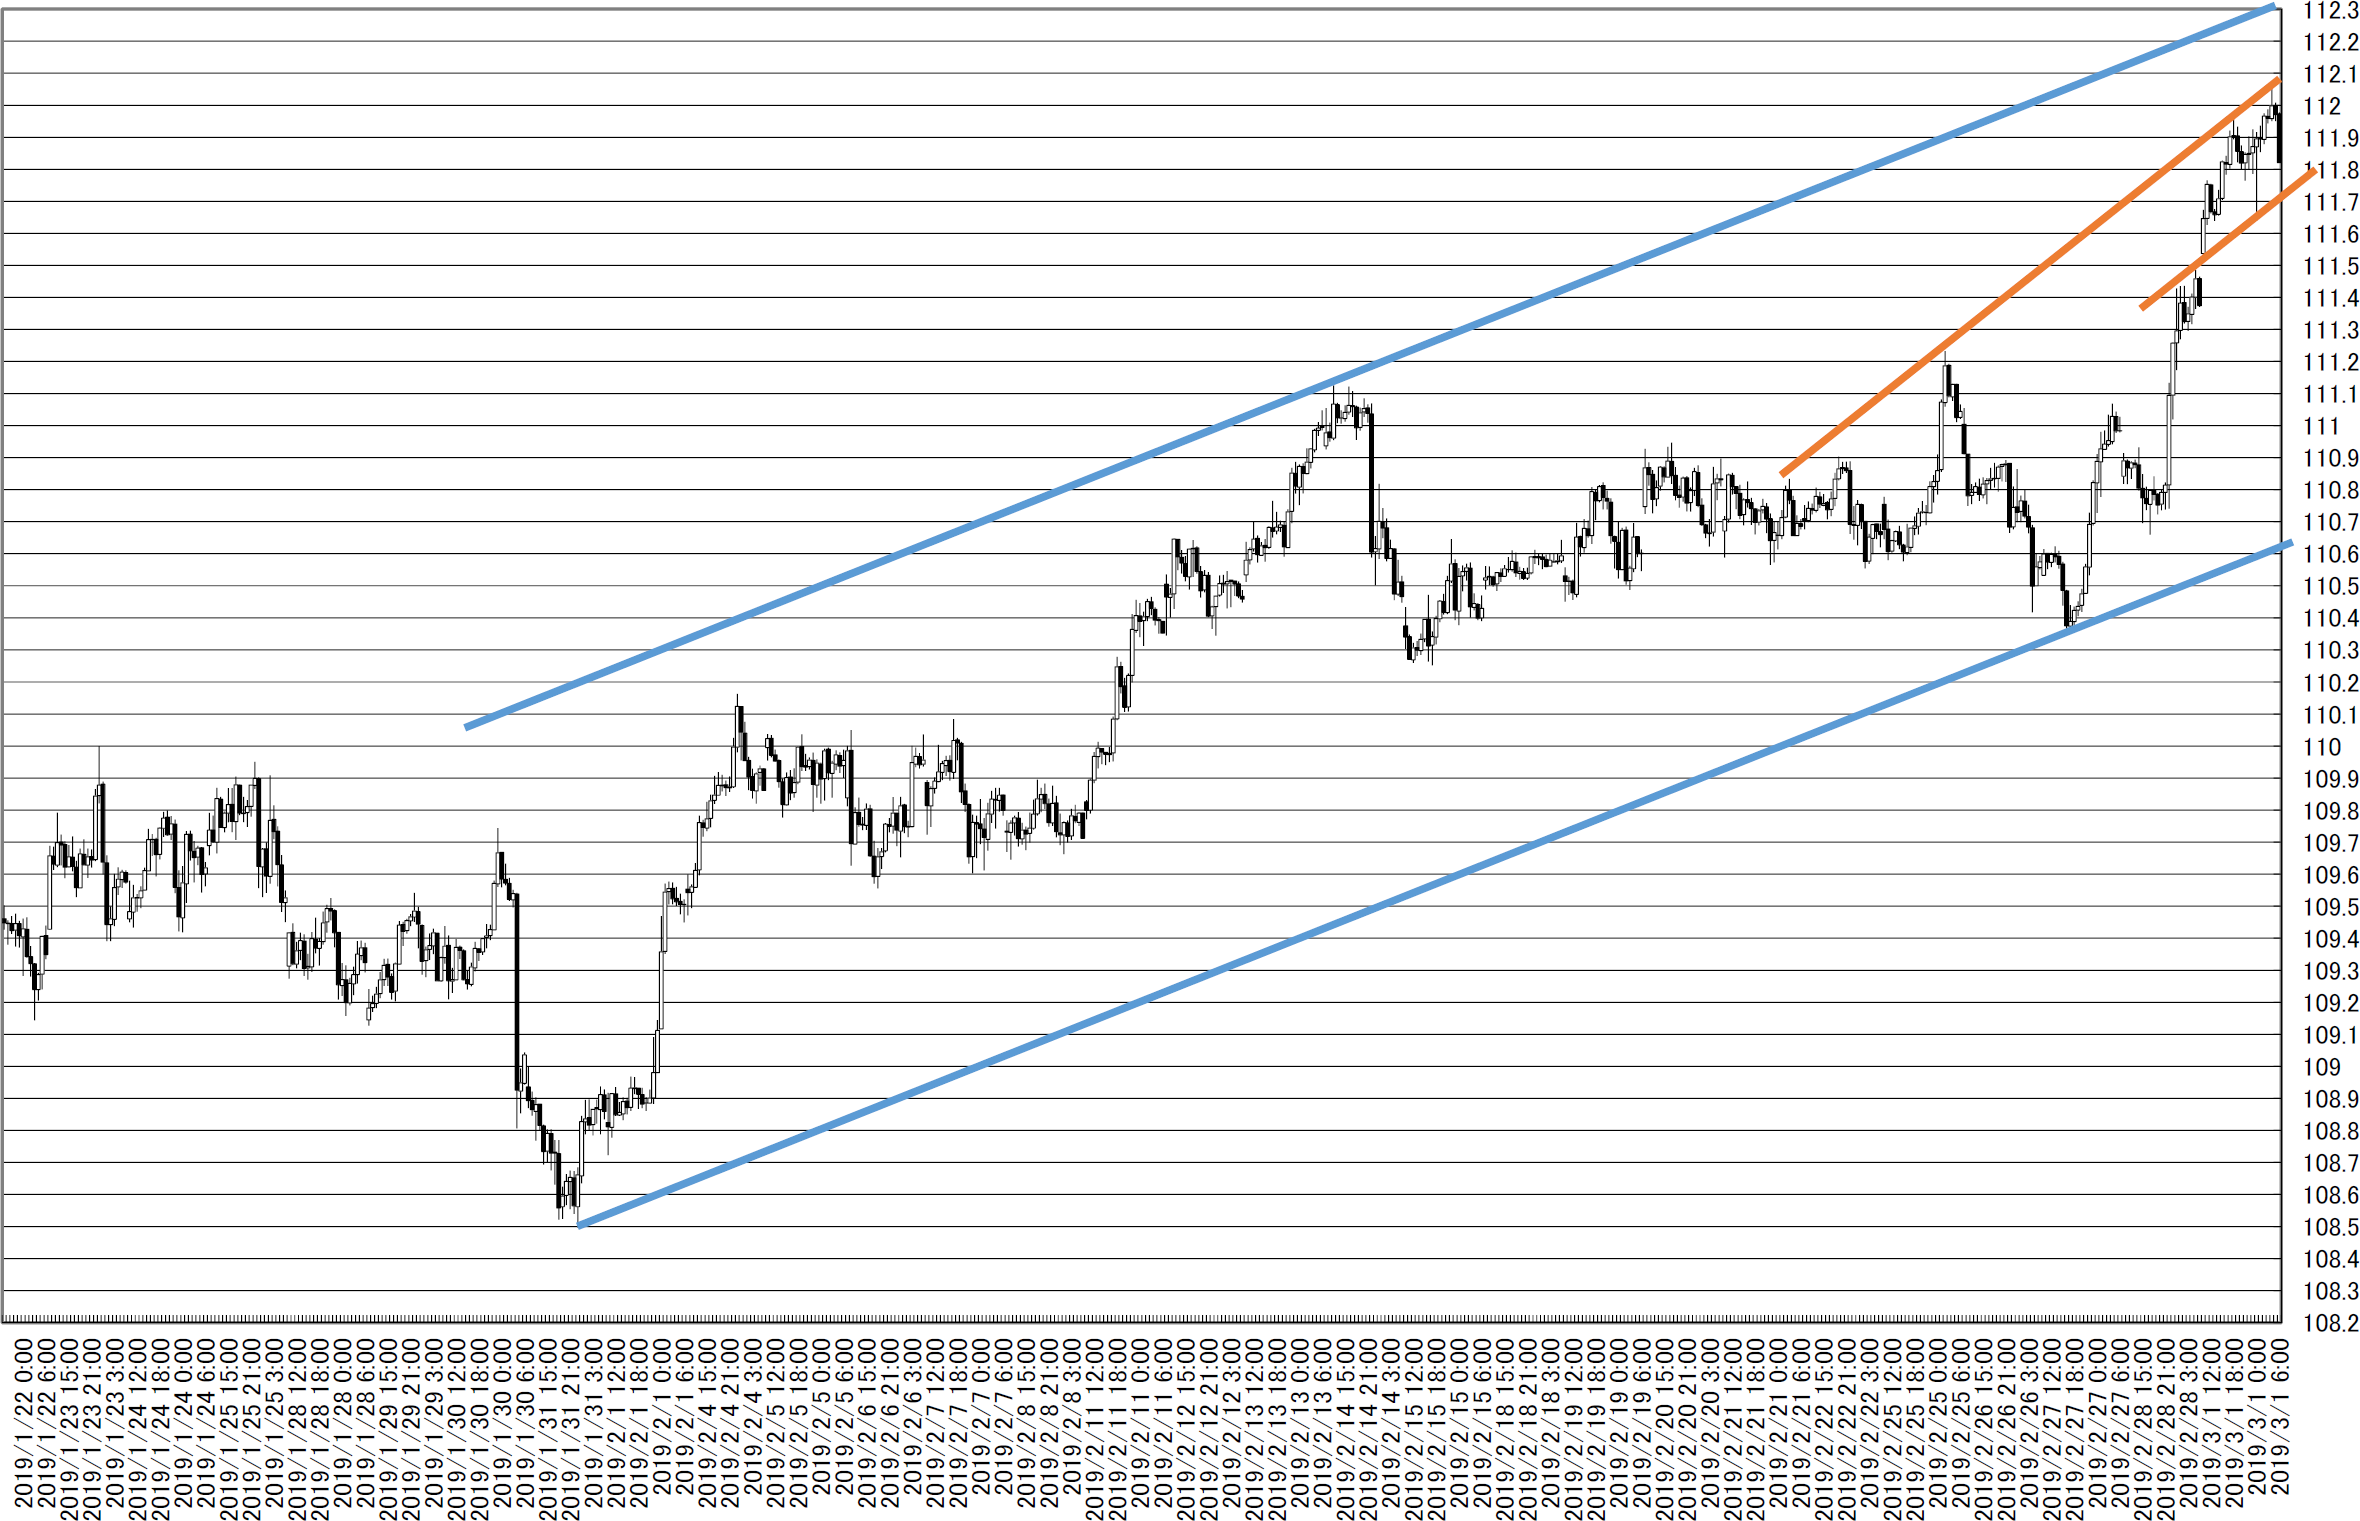
トレンドラインです。

多分、オレンジです。

良い所まで落ちてきているとも言えます。

This is trend line analysis.

Probably, orange line worked well.

Now is proper support.
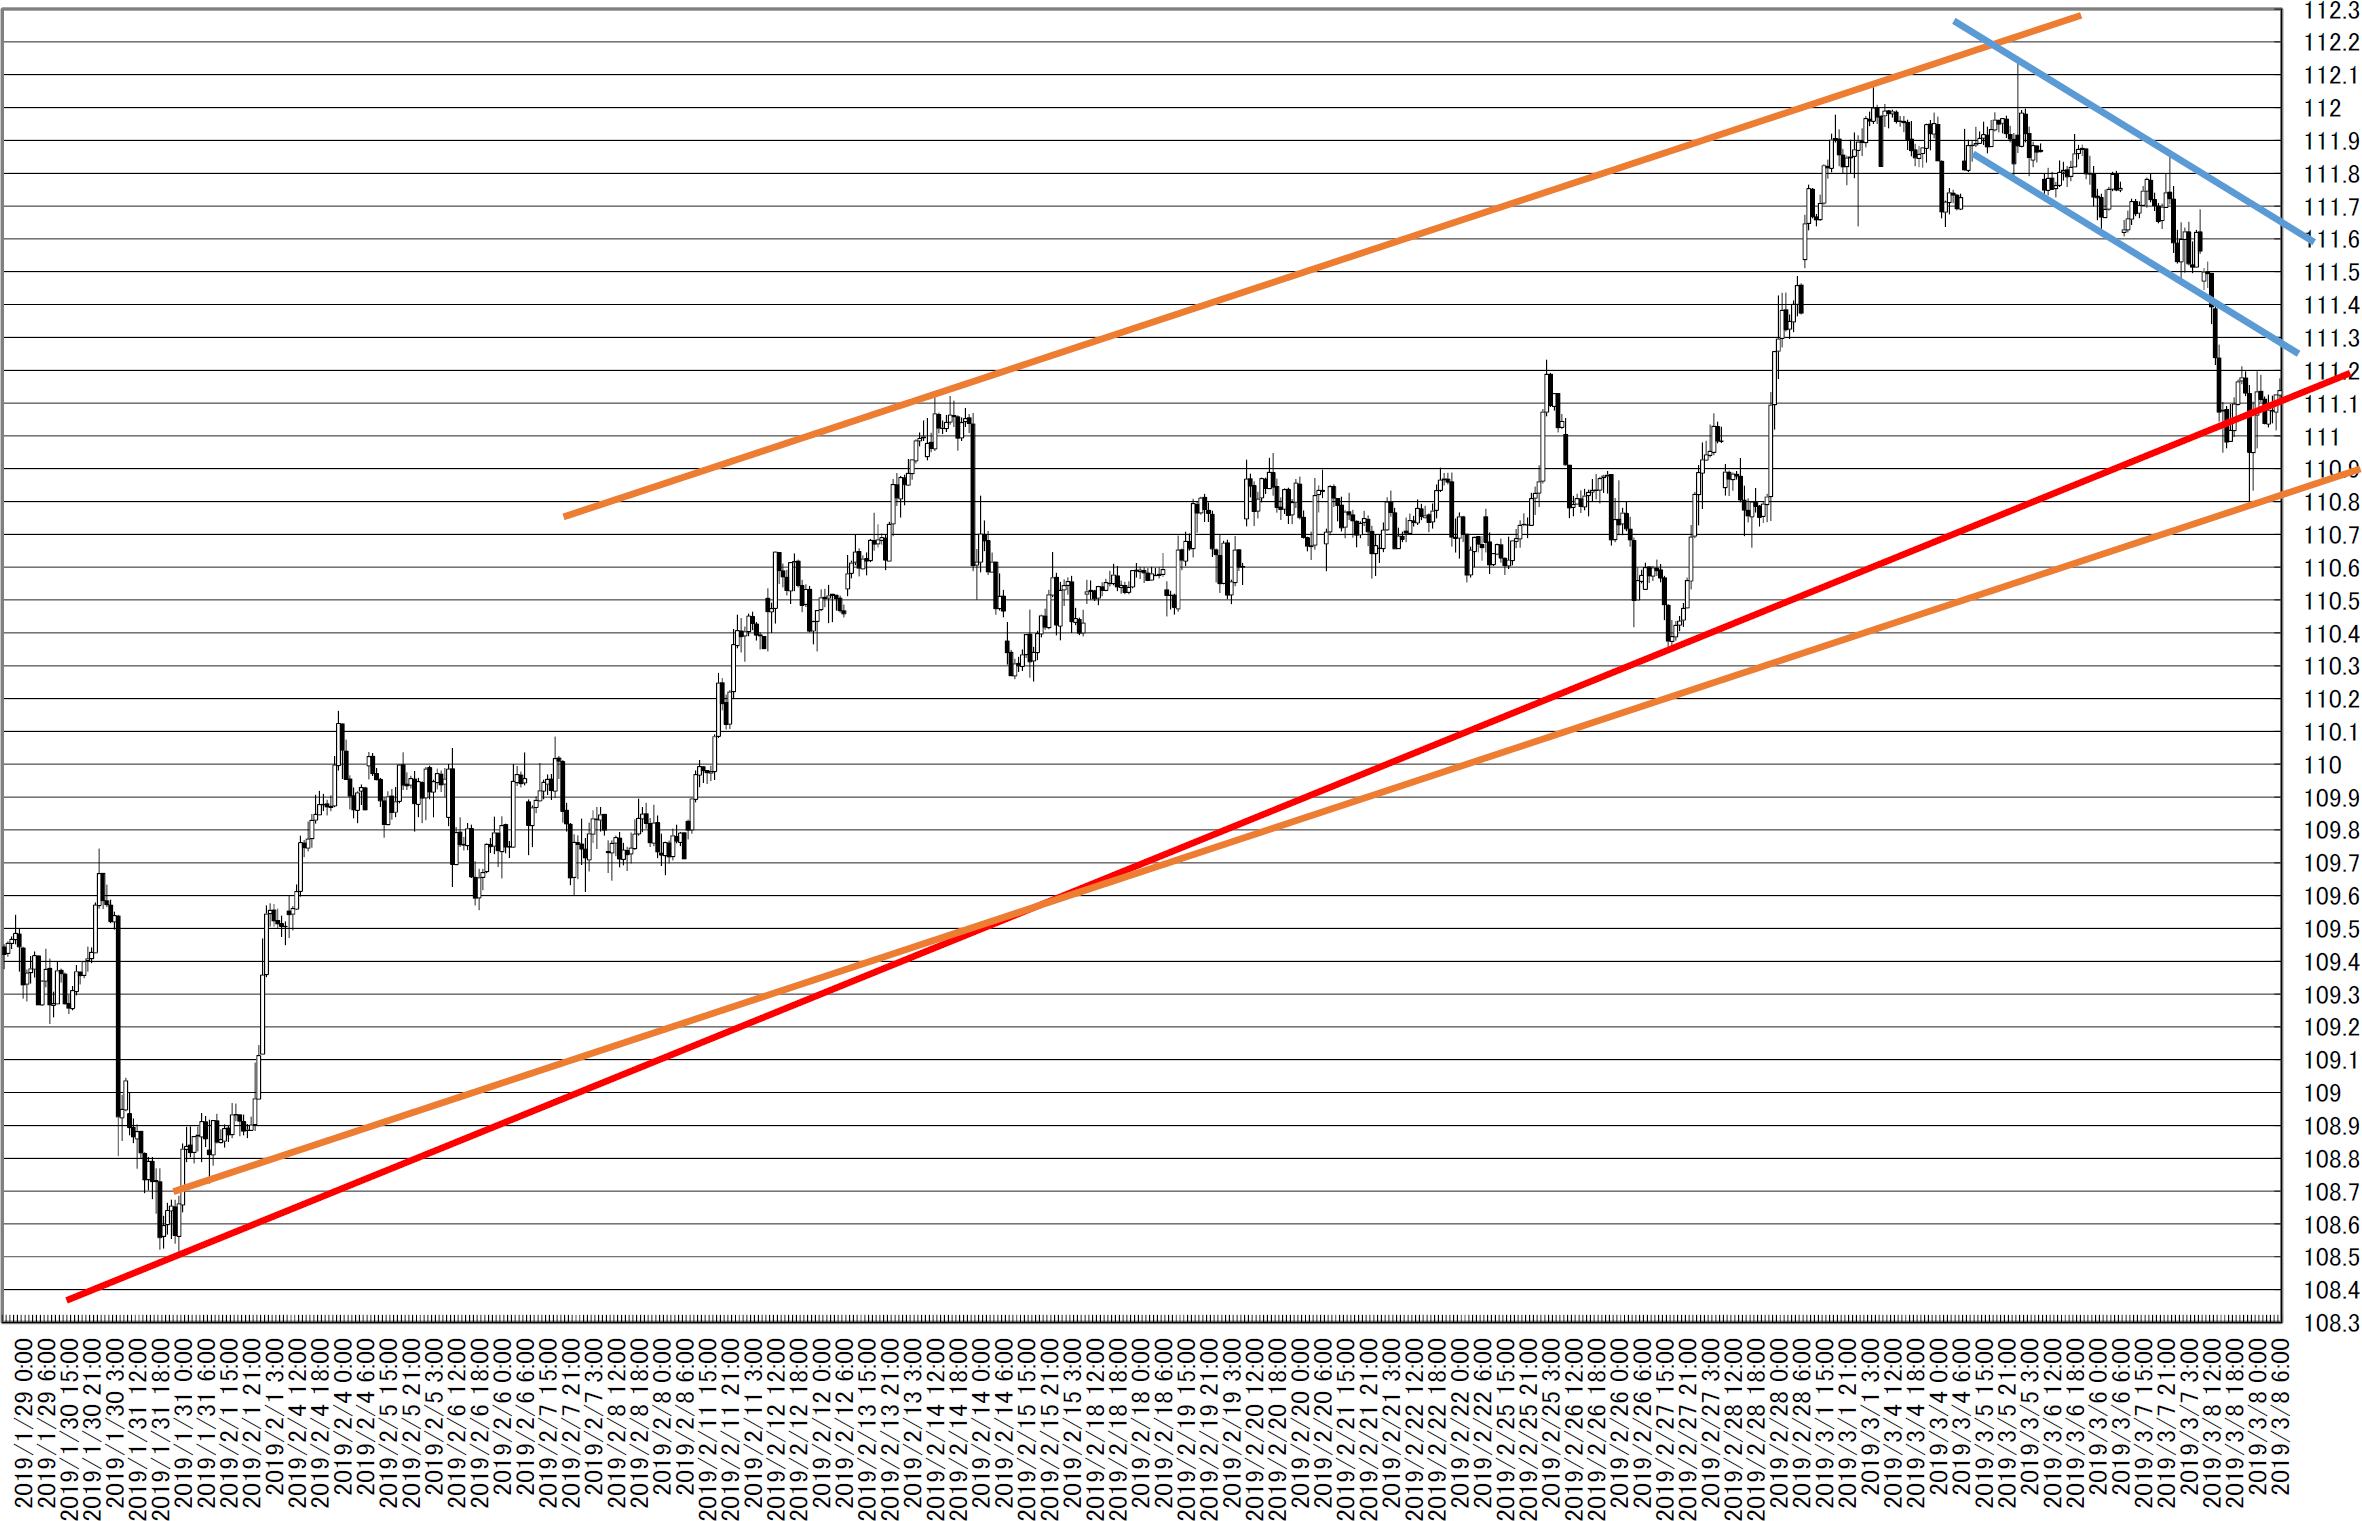
chart6_conv


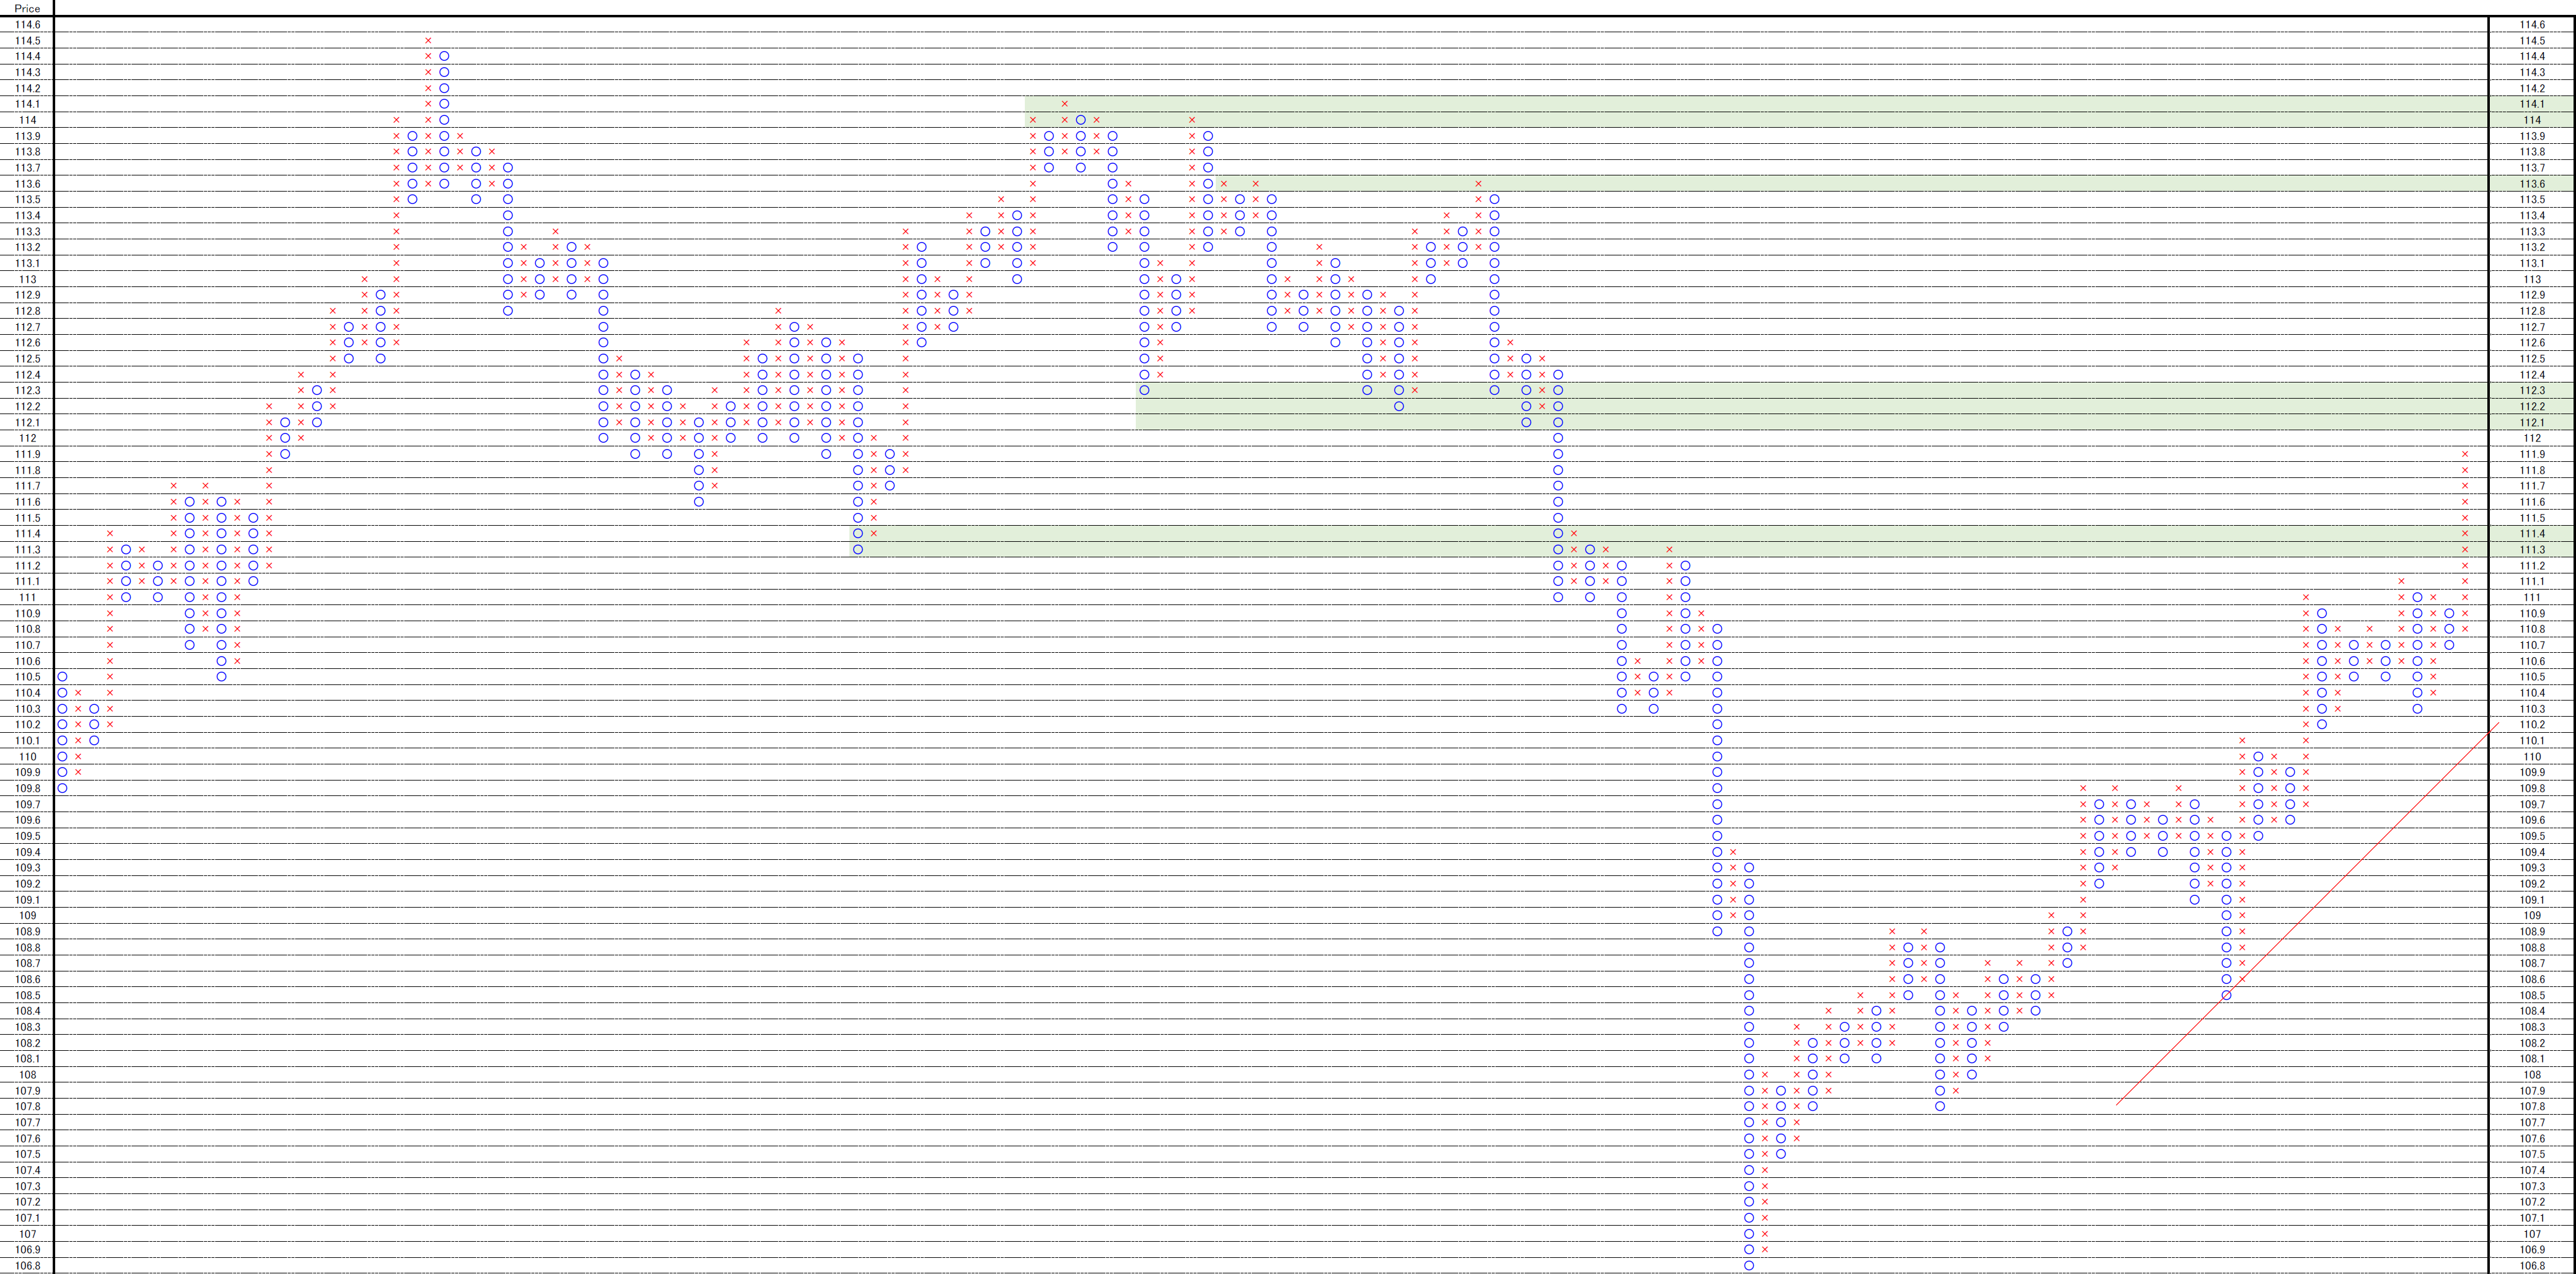
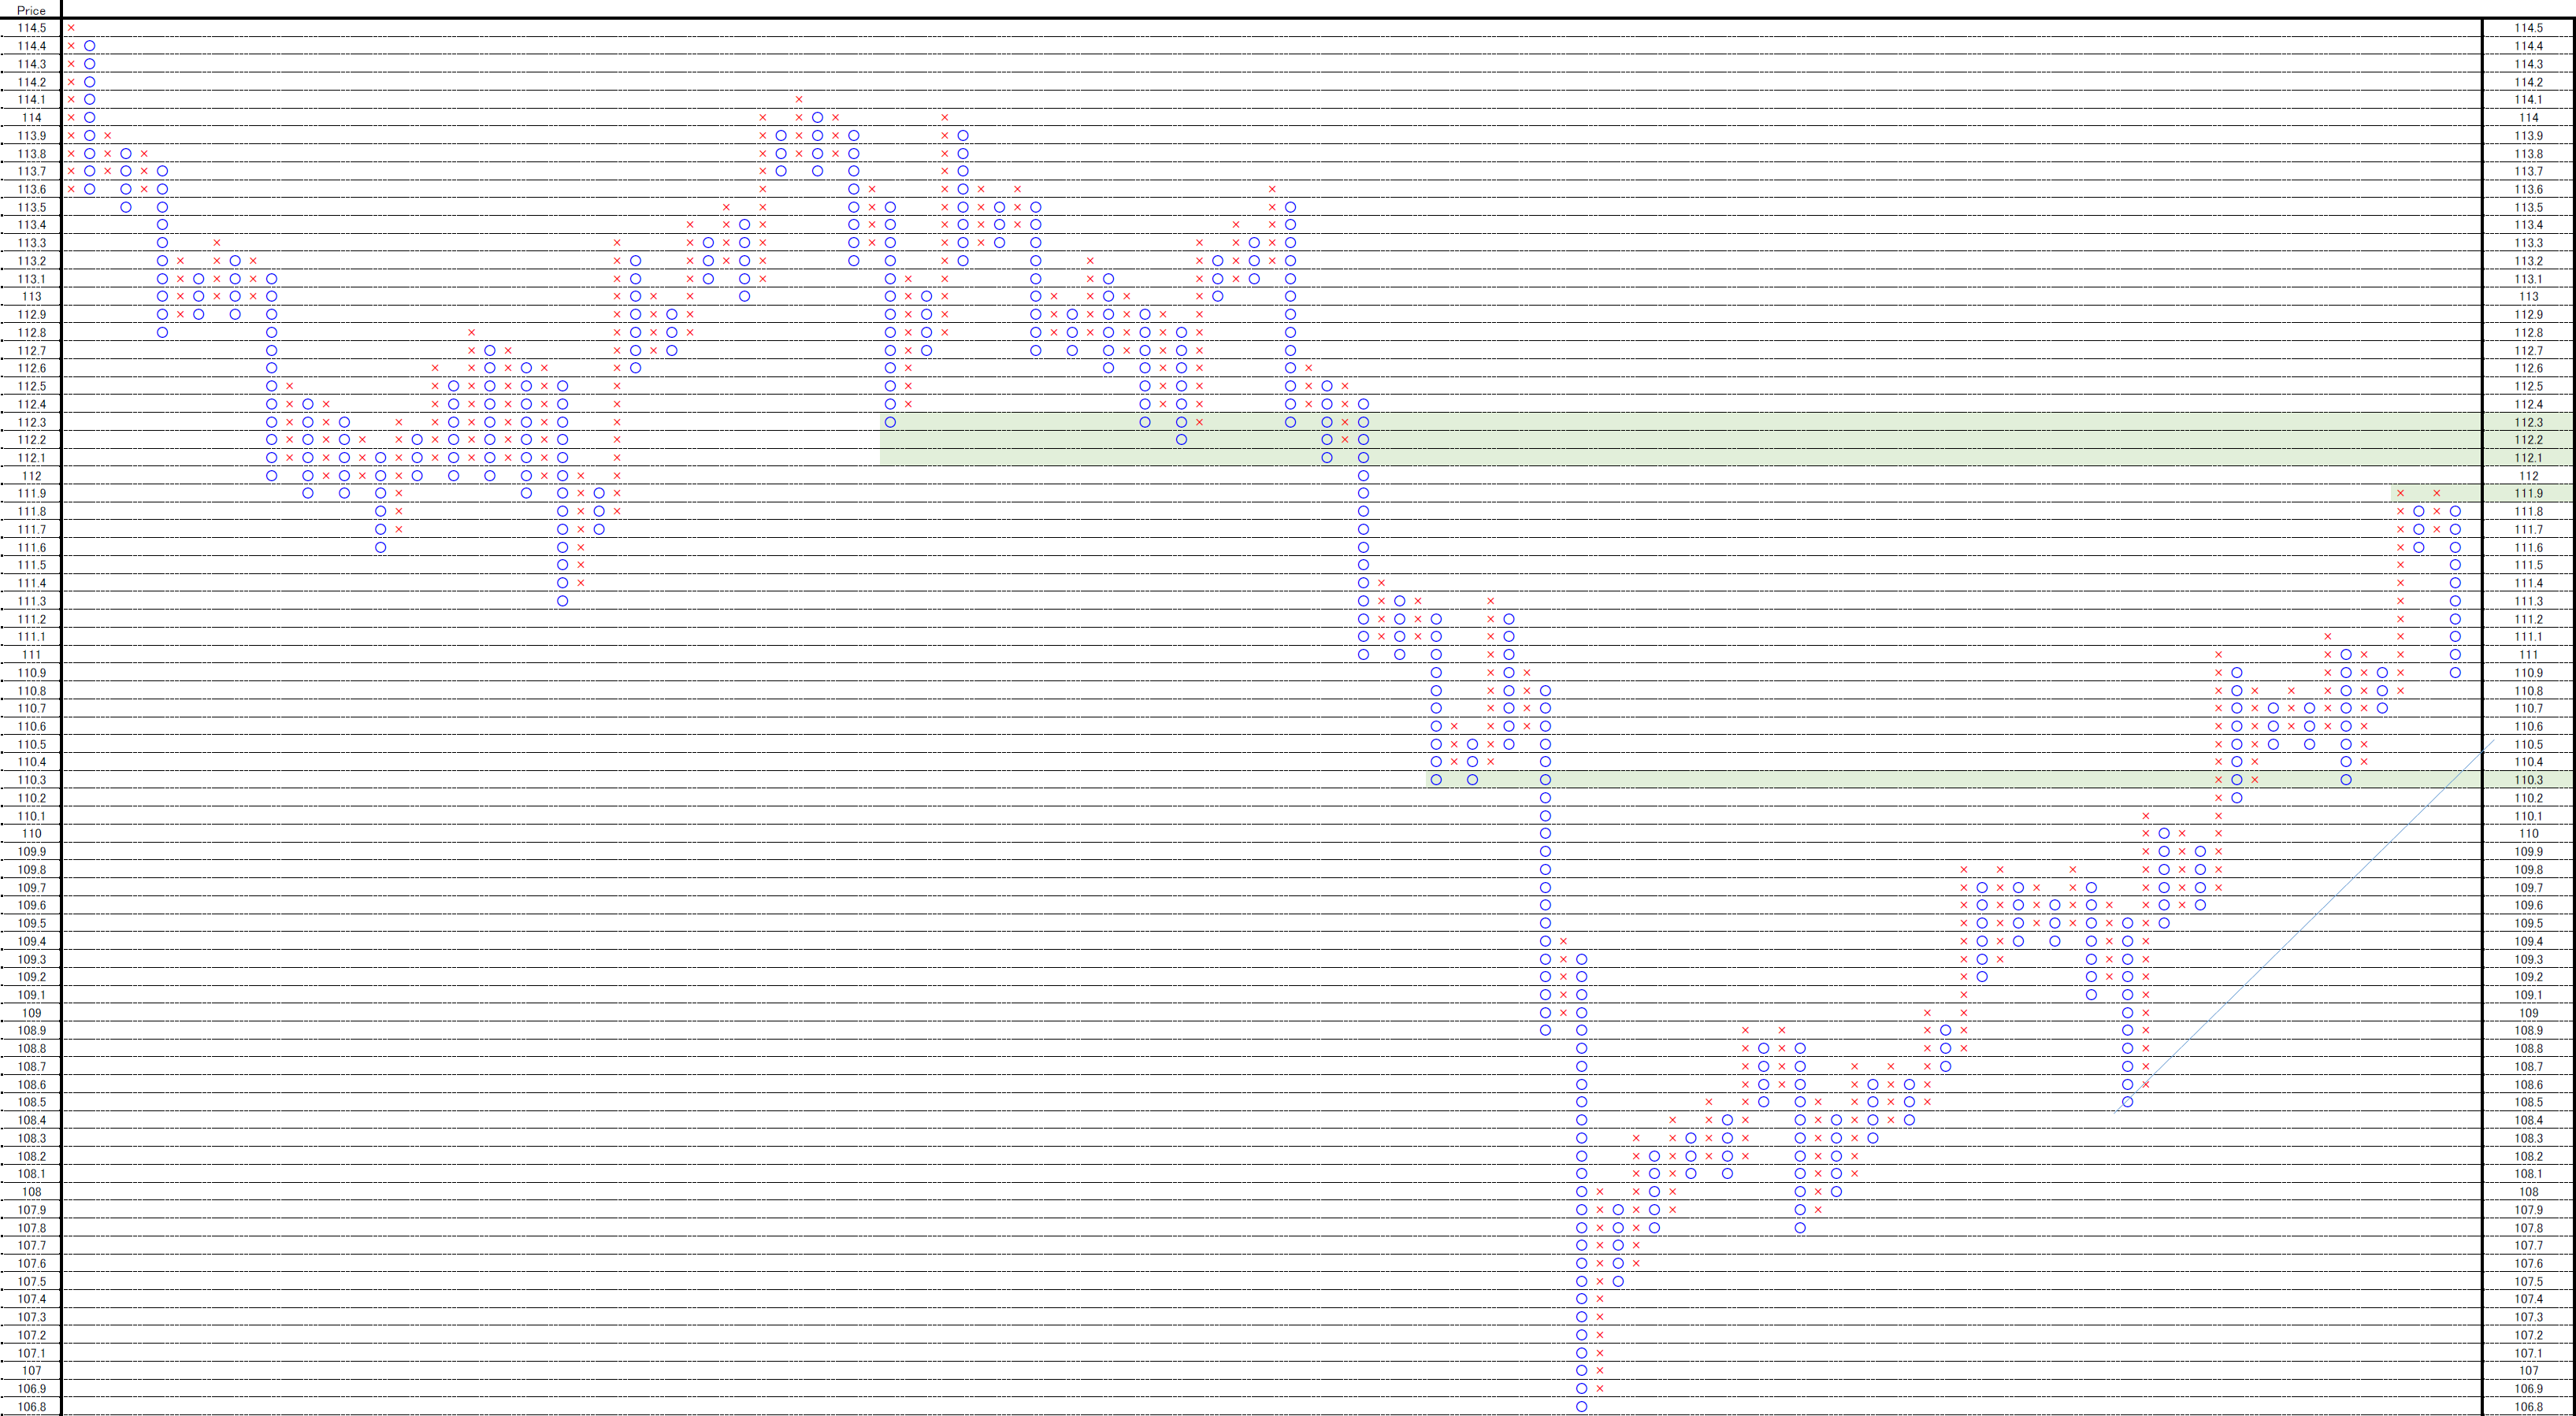
時間足を使用しオセアニア時間帯を省いたP&Fです。

45度線を割った訳ではありません。

まだ、押しの可能性も残っています。

P&Fは嘘をつきません。柔軟にいきたいと思います。

This is 0.1 price change and 3 box reversal close price’s Point and Figure chart.

The price does not cut 45 degree support.

And now may be a dip.

P&F does not lie and we can easily change our mind.
pf_conv


★★レポート作成時データのダウンロード★★

ブログで使用したデータをダウンロードしていただけます。

内容により非提供の場合があります。


相場分析のリクエストがありましたら“Contact Us”からお知らせください。ご要望にお応えできるように努力いたします。

このブログはあくまでも個人的な見解であり、投資判断は各自でお願い致します。当ブログは一切の投資損益に対する責任を負いません。

ブログに来て下さってありがとうございます。明日もよろしくお願いいたします。

If you have some request to analyze, please write to “Contact Us”.

We do best effort for your request.

These are only personal opinions on this blog, and you need the investment judgment in each one. This blog doesn’t assume the responsibility to all the investment profit and loss.

Thank for watching our contents. My best regards next day.

如果您需要行情分析,请点击“Contact Us”联系我们。我们将尽力满足您的要求。

本博客仅为个人意见,请各自做出投资判断。本博客概不对任何投资盈亏负责。

感谢您访问本博客。欢迎再次使用。

ドル円1時間足・買方優位・持ち合いからの上方ブレーク・111.30-40円をサポートに112.3円まで伸びそう

2019/03/04

ドル円1時間足・買方優位・持ち合いからの上方ブレーク・111.30-40円をサポートに112.3円まで伸びそう

USDJPY hourly; now is upside break; 111.30-40 yen will be support and the target will be 112.3yen around.

美元/日元。现在上边突破了。支持是111.30 – 40日元。目标是112.3日元左右。


今週の結論は、買方優位。

111.30-40円をサポートに112.30円程度までの上昇を想定。

Our conclusion is buying will be profitable.

111.30-40yen will be support and rally will reach 112.30yen around.


「ドル円1時間足・110.3円をサポートに、ジワジワ上げとなり、引き続き111.3円を目指す型」(2019/2/25)

111.30-40円のレジスタンスは確認できましたが、上方ブレークです。

今度は111.30-40円がsupportです。

We reported “USDJPY hourly; 110.3yen will be support and rally will be continue and the target will be 111.3yen” in 2/25/2019.

We confirm 111.30-40yen worked as resistance and this occasion means up side break.

And 111.30-40yen will be support.

chart0_conv


直近のフィボナッチと大枠のフィボナッチです。

適切なフィボナッチに「〇」、不適切なものには「×」をつけています。

112.30-40円あたりに色々あります。

These are four types of Fibonacci.

Proper Fibonacci are “〇”.

And inadequate Fibonacci are “×”.

112.3-4yen around will be resistance.

chart1chart2chart3


オセアニア時間帯抜きの足です。

111.20-30円の窓は埋まりました。

111.5円に新たな窓です。

108.20-30円に窓が残ります。

These are latest candle sticks without Oceania time.

The gap at 111.20-30yen was buried.

A new gap appeared 111.5yen around.

There remained gaps at 108.20.-30yen and 111.20-30yen.

chart4_convchart5_conv


トレンドラインです。

良いアイディアはありません。

This is trend line analysis.

We have no idea.

chart6_conv


時間足を使用しオセアニア時間帯を省いたP&Fです。

上方向は色々ですが、底堅いのは間違いないとみています。

This is 0.1 price change and 3 box reversal close price’s Point and Figure chart.

There are many resistance points and lower side will be stable.

pf_conv


★★レポート作成時データのダウンロード★★

ブログで使用したデータをダウンロードしていただけます。

内容により非提供の場合があります。


相場分析のリクエストがありましたら“Contact Us”からお知らせください。ご要望にお応えできるように努力いたします。

このブログはあくまでも個人的な見解であり、投資判断は各自でお願い致します。当ブログは一切の投資損益に対する責任を負いません。

ブログに来て下さってありがとうございます。明日もよろしくお願いいたします。

If you have some request to analyze, please write to “Contact Us”.

We do best effort for your request.

These are only personal opinions on this blog, and you need the investment judgment in each one. This blog doesn’t assume the responsibility to all the investment profit and loss.

Thank for watching our contents. My best regards next day.

如果您需要行情分析,请点击“Contact Us”联系我们。我们将尽力满足您的要求。

本博客仅为个人意见,请各自做出投资判断。本博客概不对任何投资盈亏负责。

感谢您访问本博客。欢迎再次使用。

© 2026 Retar