日経225 : 日经225 : NIKKEI 225

日経平均日足・2008年~2017年、毎日買い(売り)続け大納会で手仕舞うどうなるか・当たり前だが「安く買い高く売る」「高く売り安く買い戻す」を狙うべき

2018/08/16

日経平均日足・2008年~2017年、毎日買い(売り)続け大納会で手仕舞うどうなるか・当たり前だが「安く買い高く売る」「高く売り安く買い戻す」を狙うべき

NIKKEI 225 daily; From 2008 to 2017, when we buy(sell) N225 every day and close in yearly end, what was happened?

日经225。从2008年到2017年,如果我们每天都在不断买(卖)后它在今年年底全部卖(买),就发生了什么事?


本日は日経225を「毎日買って(売って)大納会で手仕舞いする」シミュレーションを行いました。

結論は当たり前ですが「安く買い高く売る」「高く売りやすく買い戻す」に徹するべきだと言えます。

Today, we survey when we buy (sell) N225 every day and close in “DAINOUKAI”, what will happen?

Our conclusion is we need to aim “Buy on low and Sell on high” or “Sell on high and Buy on low”.


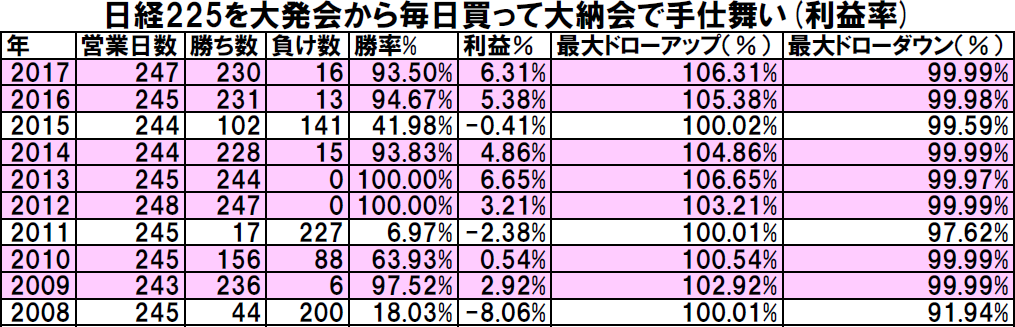
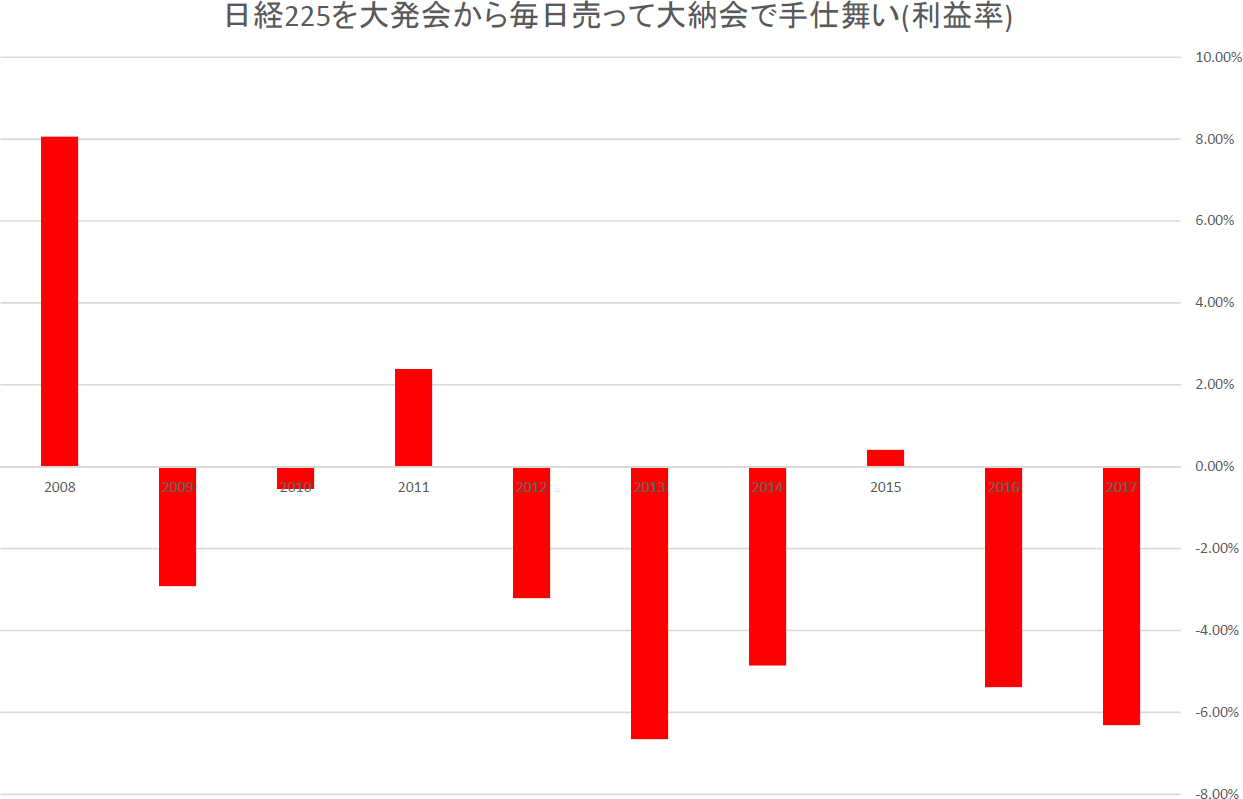
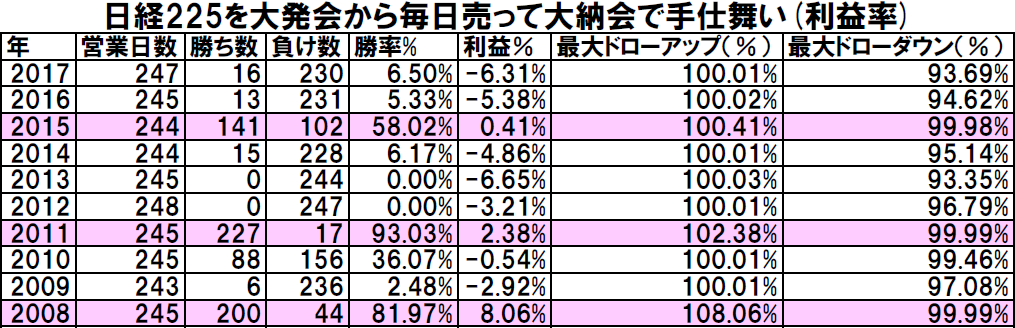
買い建て(売り建て)の条件は、日経225を1株と見立て、大発会から毎日の終値で買い(売り)、大納会で手仕舞った時の年ごとのパフォーマンスです。

高値引けする方が買い方には有利であり、売り方にとっては反対です。

この10年は、買い方の7勝3敗であり、買い方の有利な10年だったと言えます。

しかし、パフォーマンスは一定していない特徴も併せてみられます。

つまり、適切なところで「買い」(売り)が必要です。

We treat as N225 as one unit of stock and buy from the beginning of the year to the end of the year in close price.

When yearly close gets higher, buying is profitable and selling is opposite.

In these 10 years, buying won 7 times and selling was unfavorable.

And profit is not stable by this method.

We need to buy (sell) on proper phase.
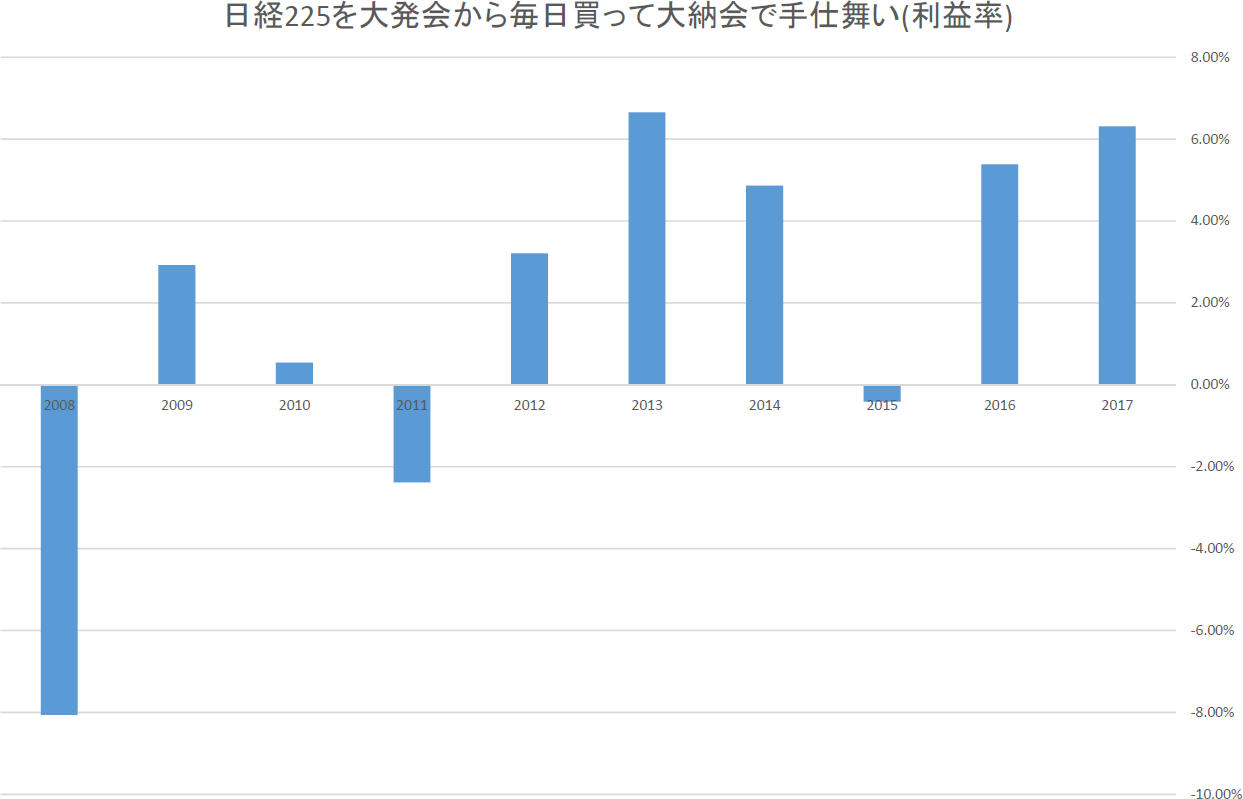
chart1_convtable1_conv


chart2_convtable2_conv


ろうそく足の色と売り買いパフォーマンスも一致しません。

年足で上がったから買い方(売り方)がみんなHAPPYになれる訳ではありません。

色々な投資家がいるということなのでしょう。

And of course, the color of candle stick and the performance of this tactics does not fit.

This means candle stick color does not make everyone’s happiness.

We can know there are many types of investors.
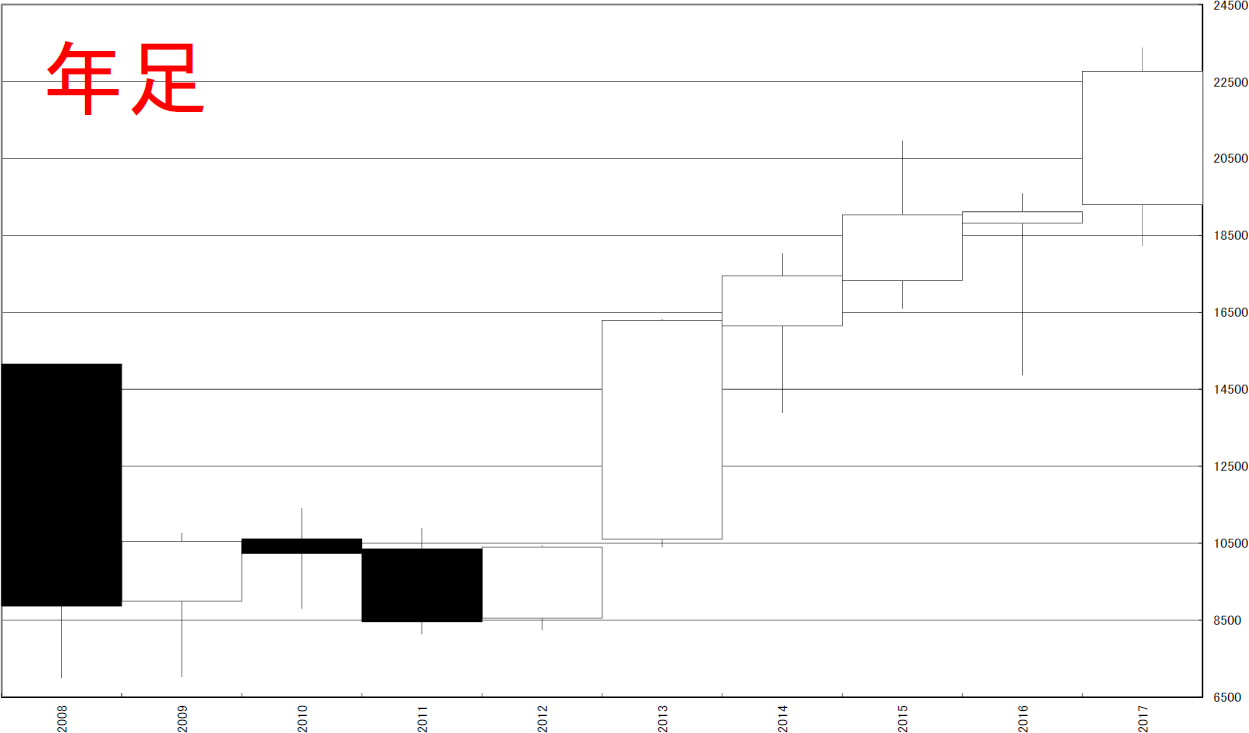
chart3_conv


★★レポート作成時データのダウンロード★★

ブログで使用したデータをダウンロードしていただけます。

内容により非提供の場合があります。


相場分析のリクエストがありましたら“Contact Us”からお知らせください。ご要望にお応えできるように努力いたします。

このブログはあくまでも個人的な見解であり、投資判断は各自でお願い致します。当ブログは一切の投資損益に対する責任を負いません。

ブログに来て下さってありがとうございます。明日もよろしくお願いいたします。

If you have some request to analyze, please write to “Contact Us”.

We do best effort for your request.

These are only personal opinions on this blog, and you need the investment judgment in each one. This blog doesn’t assume the responsibility to all the investment profit and loss.

Thank for watching our contents. My best regards next day.

如果您需要行情分析,请点击“Contact Us”联系我们。我们将尽力满足您的要求。

本博客仅为个人意见,请各自做出投资判断。本博客概不对任何投资盈亏负责。

感谢您访问本博客。欢迎再次使用。

日経平均日足・25日、200日移動平均のGCとDCについて・せめて200日移動平均(22400円)を超えていかなければ下落の可能性も

2018/08/14

日経平均日足・25日、200日移動平均のGCとDCについて・せめて200日移動平均(22400円)を超えていかなければ下落の可能性も

NIKKEI 225 daily; the relation between 25SMA and 200SMA; if the price will not go about 22400yen over, bear market may start.

日经225。25SMA和200SMA之间的关系。如果价格不会超过22400日元,就熊市可能会开始。


Retar.jpで移動平均について解説するのは、はじめてかもしれません。

移動平均に対する見解はいろいろありますが、私たちなりのお勧めのやり方を紹介したいと思います。

Today, we introduce how to use SMA method.

This is our recommend method.


本日は日経225日足についてです。

結論はせめて200日移動平均(22400円程度)を超えていかなければ下落の可能性も。

Today is about N225 daily.

Our conclusion is if the price will not go about 22400yen over, bear market may start.


本日は25日移動平均と200日移動平均を使い調査します。

移動平均のチャートは、長短と終値の3本線がお勧めです。

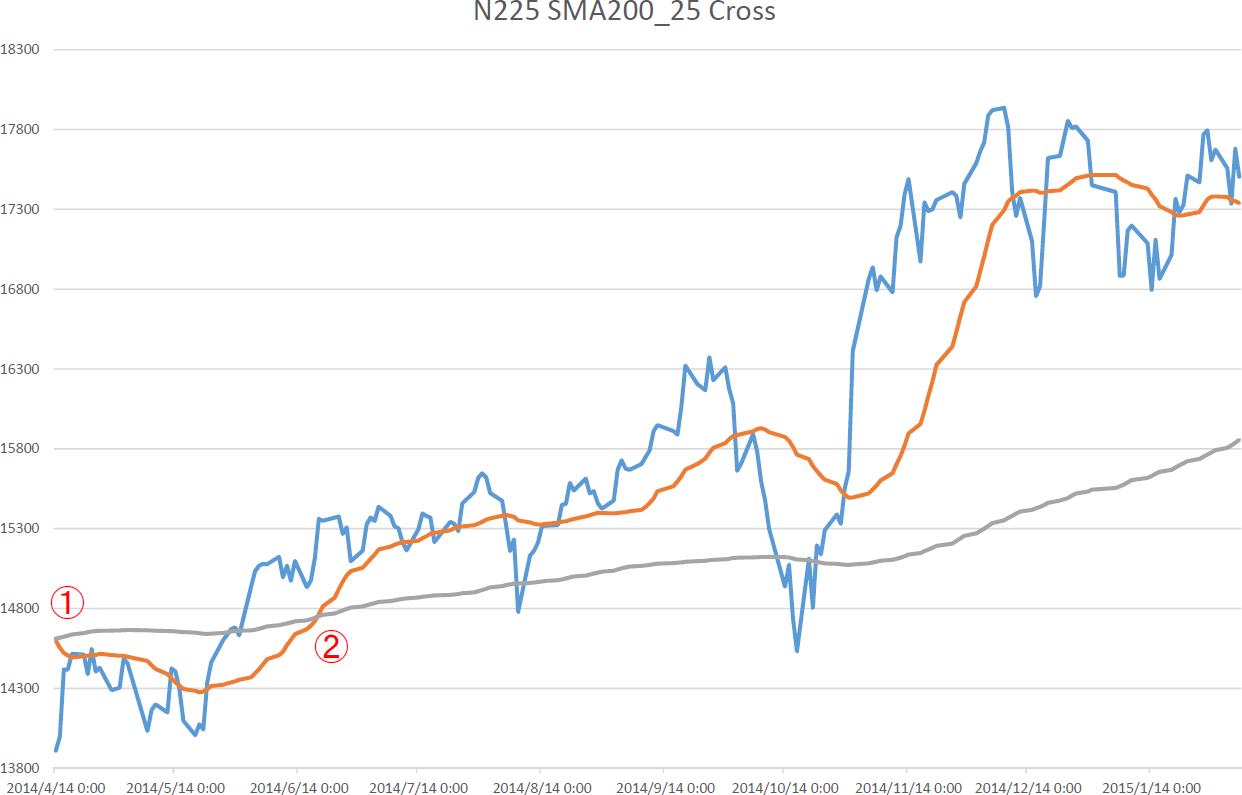
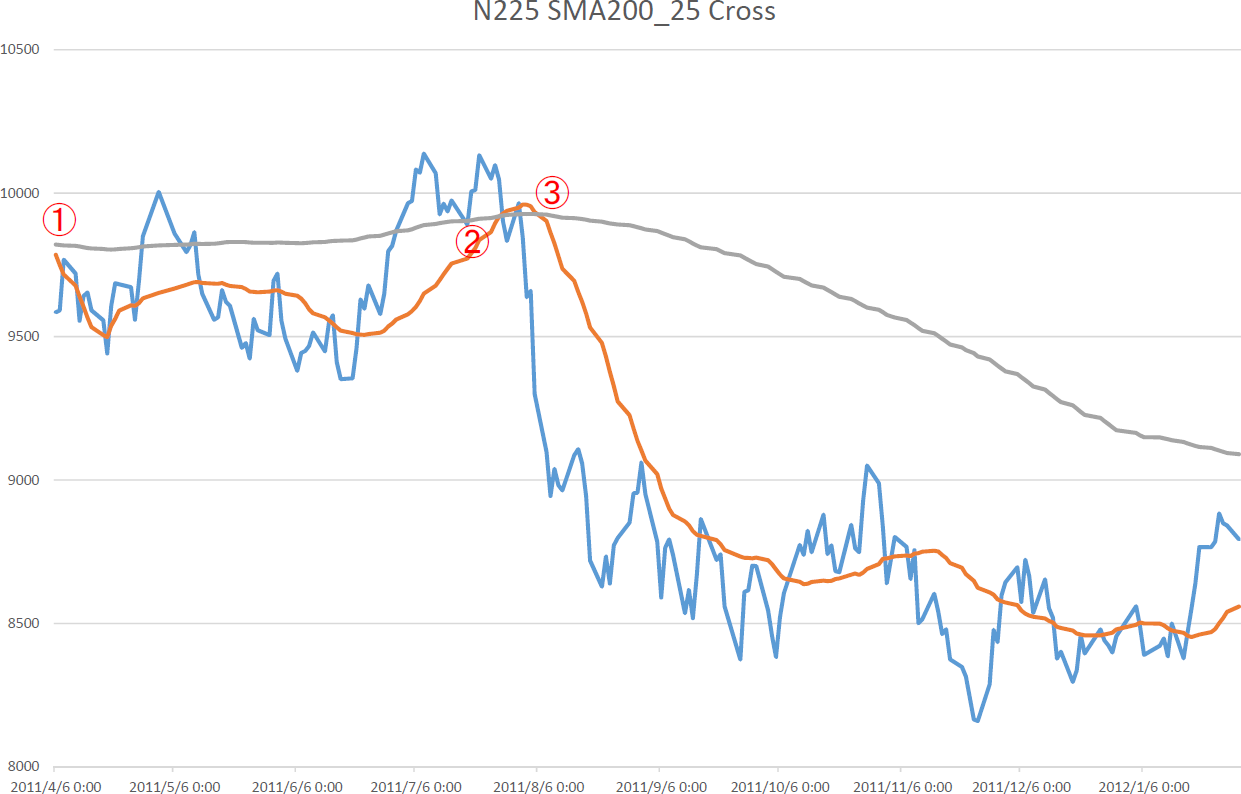
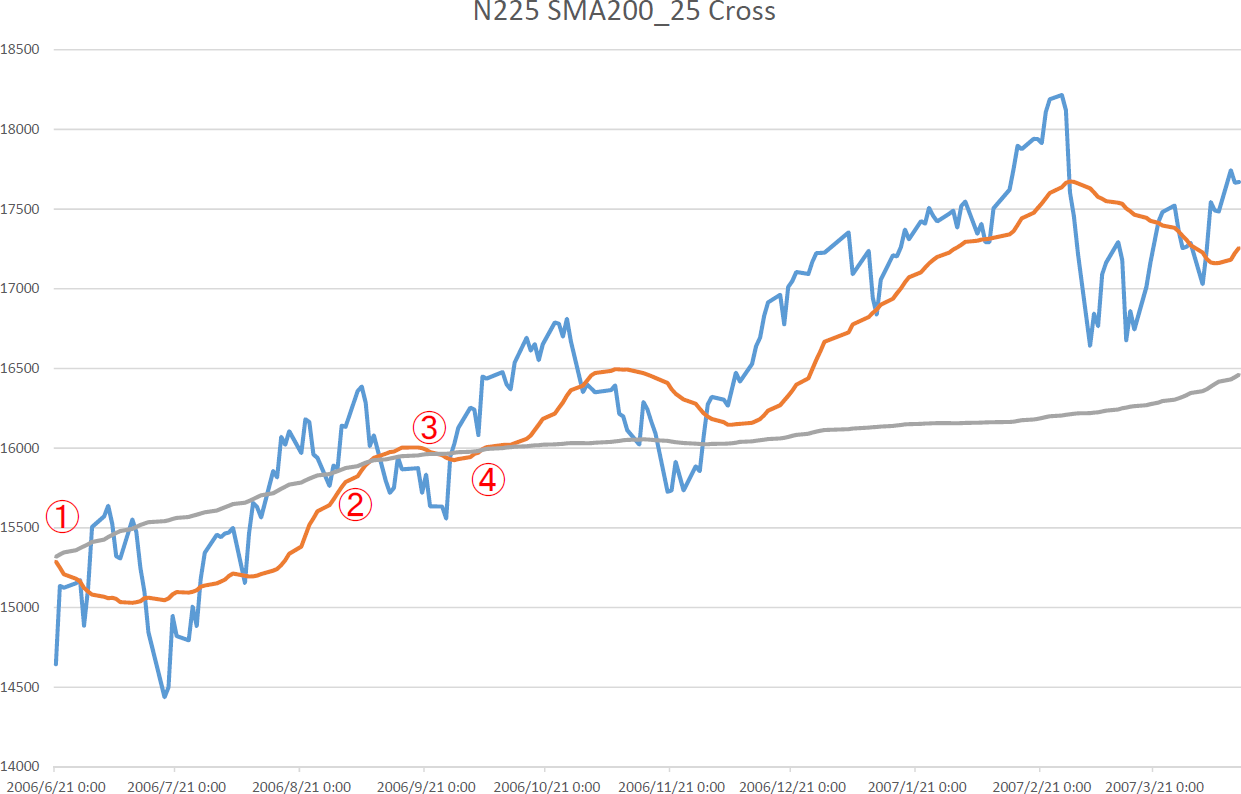
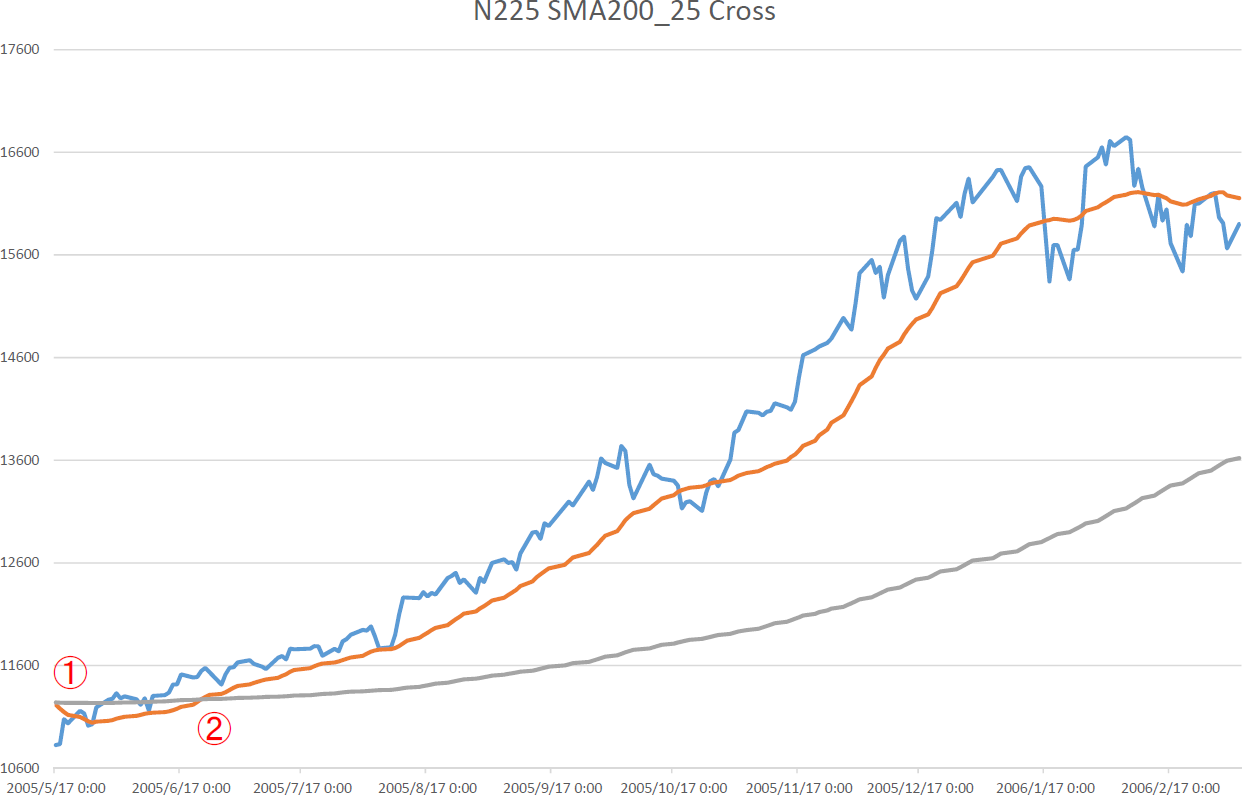
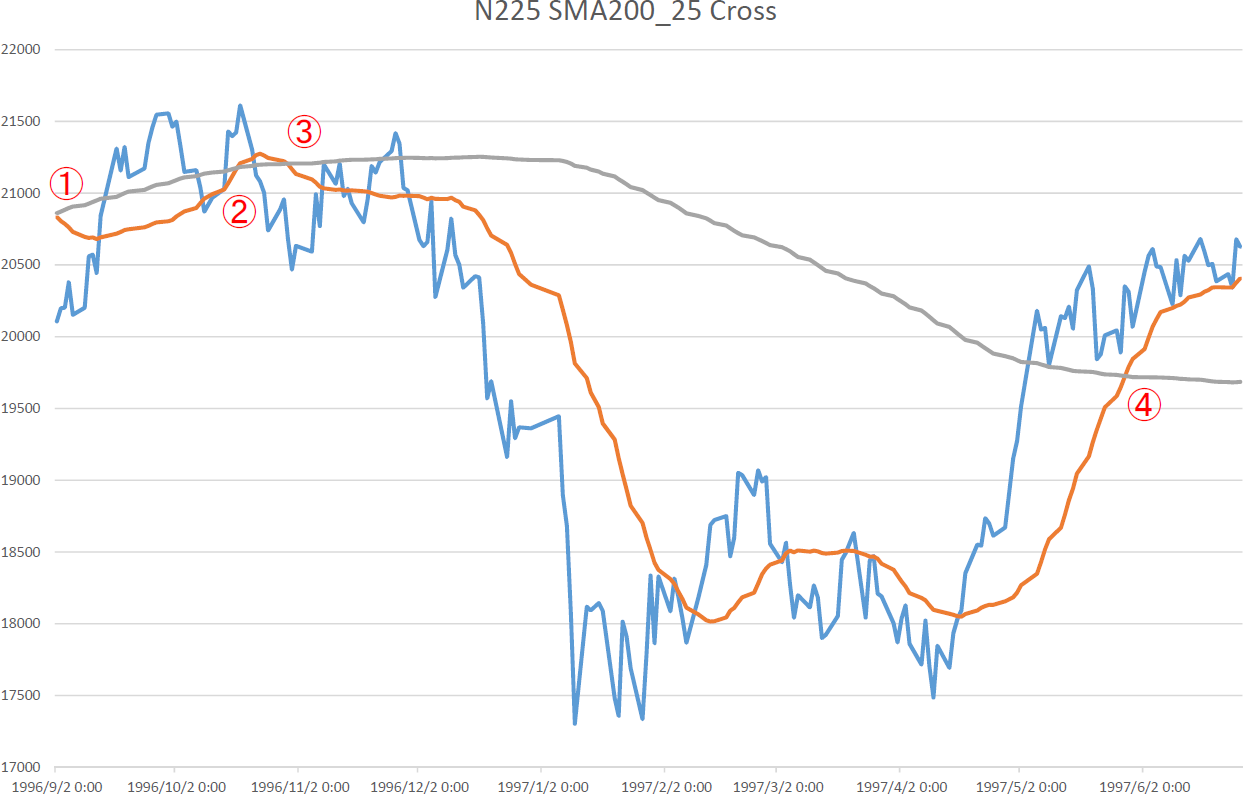
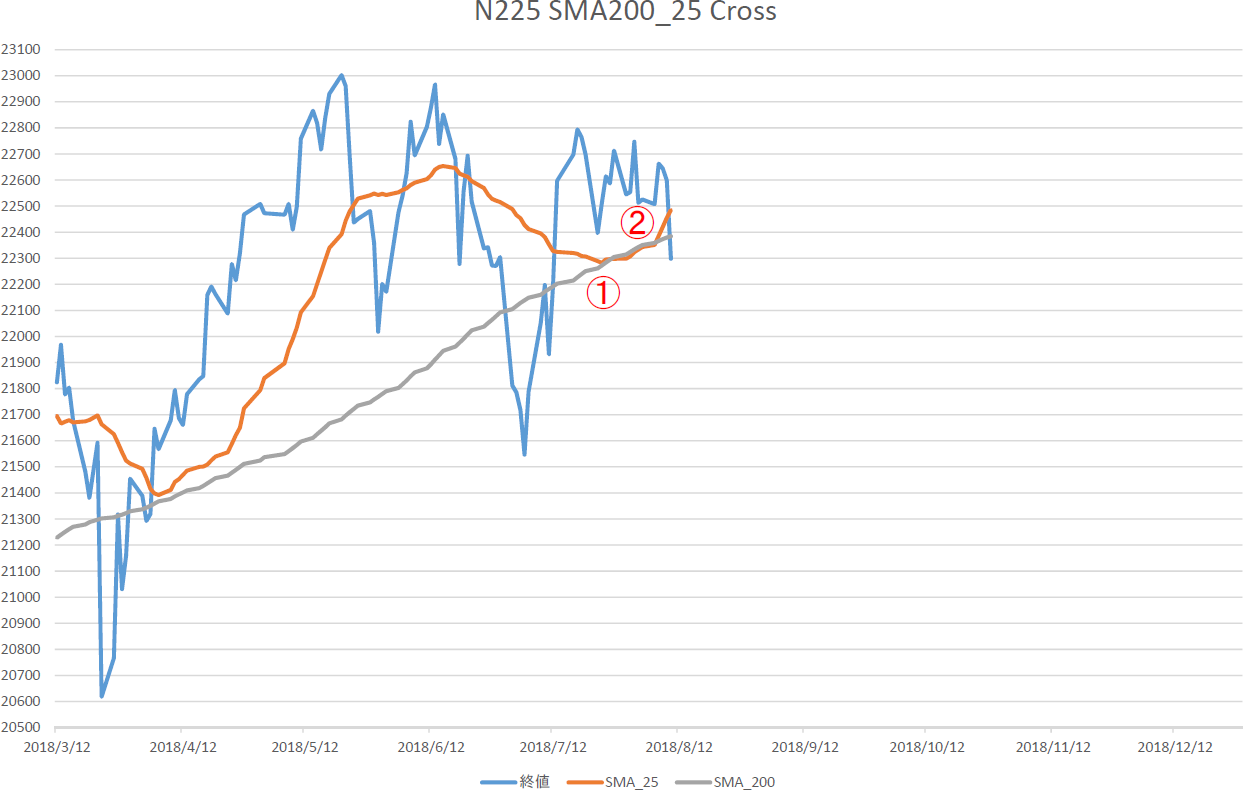
最近の特徴は①の地点でデッドクロス(DC)、②の地点でゴールデンクロス(GC)です。

ポイントは短期間にDC,GCが示現した点(「横~横~」状態)です。

短期間にDC,GCが発生するというのは、モメンタムがなくクロスした場合であり、DC,GCを基準にしづらい状況です。

「短期間」の基準は大よそ長期移動平均の半分にすると良いと思います。

Today, we use 25SMA and 200SMA.

When you analyze SMA, you should use three types of lines; long and short SMA and practical close price.

“①” is Dead Cross point and “②” is Golden Cross Point.

Now is steadiness and GC and DC appeared in short term.

Our short term means “The half period of long term SMA” and in this occasion, this is 100 days.

chart1_conv


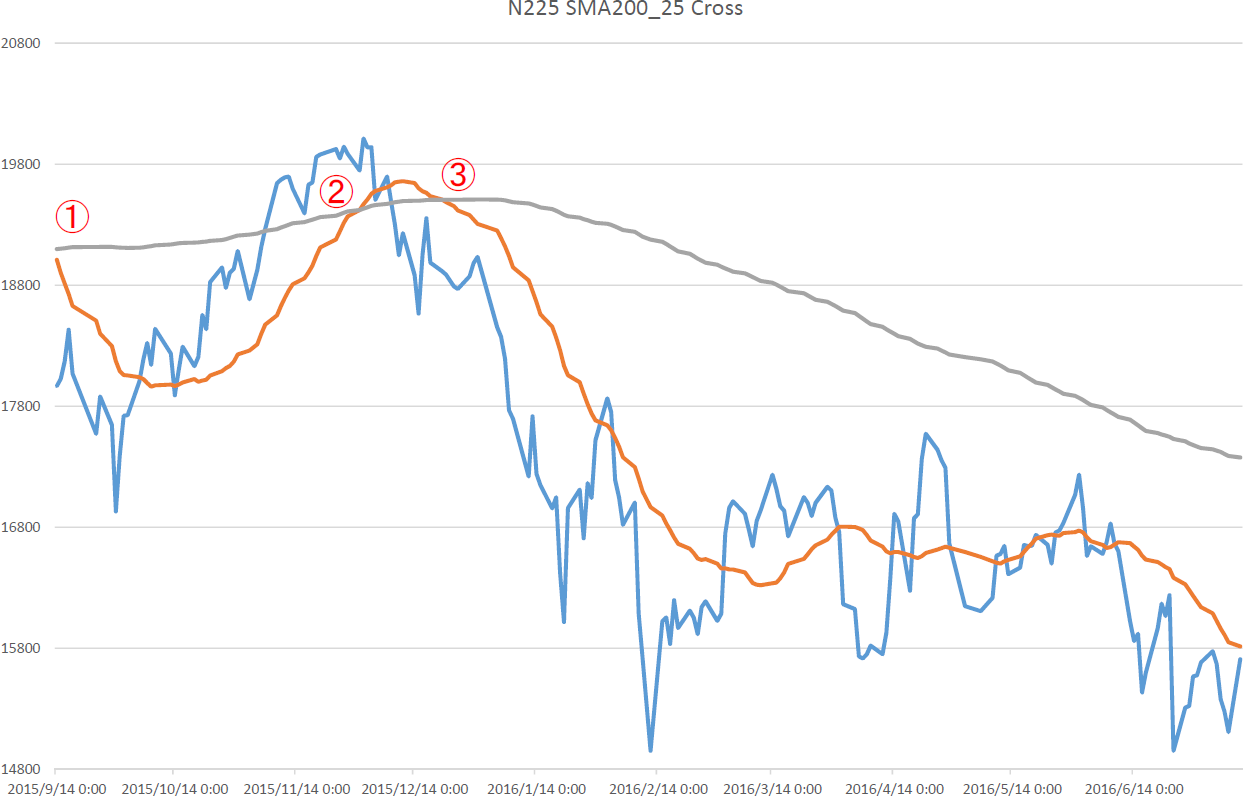
1991年以降おおよそDC発生以前の100営業日にGCの発生はなく100営業日以内に①DC、②GCをした地点を集めました。

DCの後、GCが発生したパターンの内、上昇相場になったのは3回、下降相場になったのは3回です。

Retar.jpでは、おおよそ10か所の発生を基準に判定材料としているため、判断としては乏しいものです。

しかし、上昇相場がはじまるというのであれば、実際の値段はあがっていくはずなので、せめて200日移動平均を超えてからです。

「上昇相場入り」を確定するには補完的な指標が必要です。

We survey both GC and DC appeared in 100 days. (DC first and GC second)

And we can know bull pattern were 3 times and bear times were 3times.

We use 10 times over past occasions and we cannot judge is from this pattern.

But if real bull market will start, price need to rise; at least, 200SMA over.

We need more evidences for judge.

chart2_convchart3_convchart4_convchart5_convchart6_convchart7_conv


★★レポート作成時データのダウンロード★★

ブログで使用したデータをダウンロードしていただけます。

内容により非提供の場合があります。


相場分析のリクエストがありましたら“Contact Us”からお知らせください。ご要望にお応えできるように努力いたします。

このブログはあくまでも個人的な見解であり、投資判断は各自でお願い致します。当ブログは一切の投資損益に対する責任を負いません。

ブログに来て下さってありがとうございます。明日もよろしくお願いいたします。

If you have some request to analyze, please write to “Contact Us”.

We do best effort for your request.

These are only personal opinions on this blog, and you need the investment judgment in each one. This blog doesn’t assume the responsibility to all the investment profit and loss.

Thank for watching our contents. My best regards next day.

如果您需要行情分析,请点击“Contact Us”联系我们。我们将尽力满足您的要求。

本博客仅为个人意见,请各自做出投资判断。本博客概不对任何投资盈亏负责。

感谢您访问本博客。欢迎再次使用。

© 2026 Retar