日経225 : 日经225 : NIKKEI 225

日経平均日足短期・弱気に傾き・変化日2016/10/14/NIKKEI 225 daily short term view; now seems to be bearish; “HENKABI” is 2016/10/14. /日经225。现在似乎是熊市。“变化日”是2016年10月14号。

2016/09/28

日経平均日足短期・弱気に傾き・変化日2016/10/14

NIKKEI 225 daily short term view; now seems to be bearish; “HENKABI” is 2016/10/14.

日经225。现在似乎是熊市。“变化日”是2016年10月14号。


本日は日経225超短期日足についてです。

結論は2016/10/14の変化日に注目です。

今のところは下臭さ満点ですが、16000円台ミドルから離れるタイミングに注目です。

Today is about N225 daily.

Our conclusion is most notable point will be 10/14/2016 as “HENKABI”.

The latest chart seems to be bearish and the most notable point will be the timing of the launching from 16000yen middle.


日柄のレポートは復習つきで解説していきます。

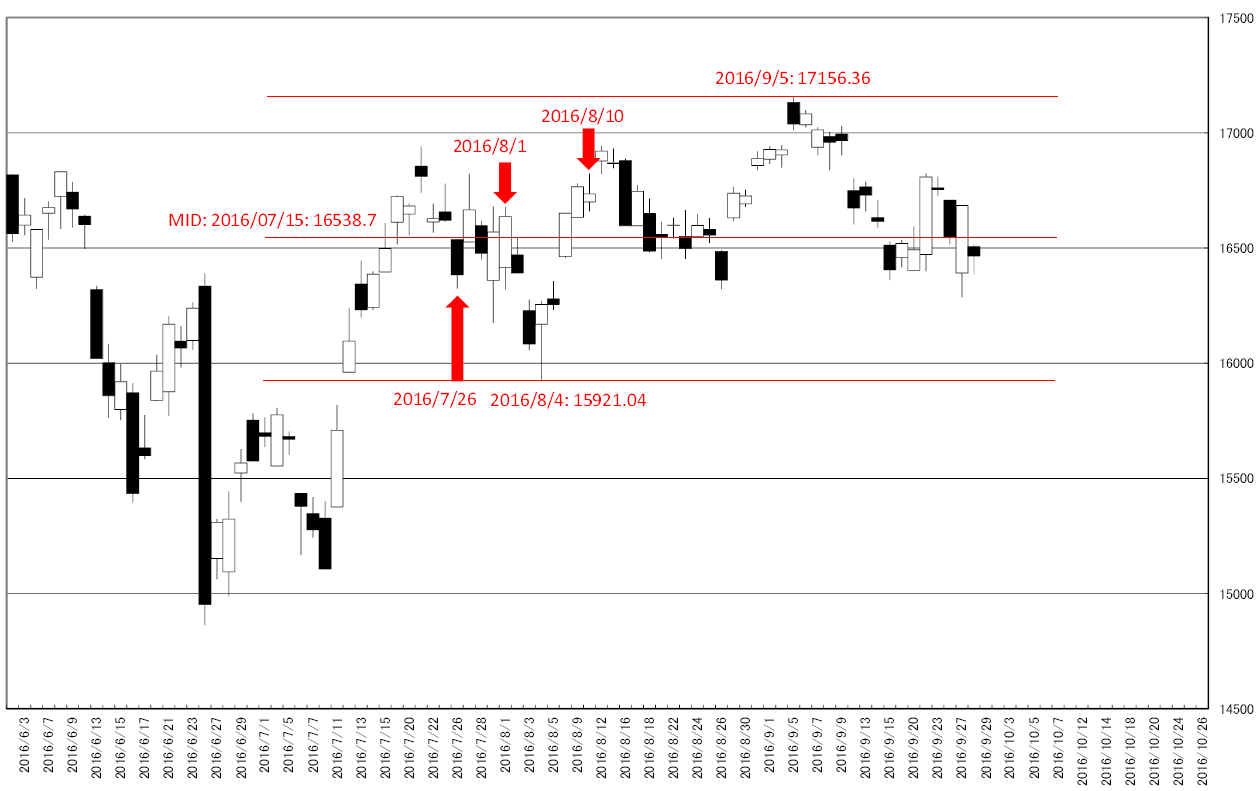
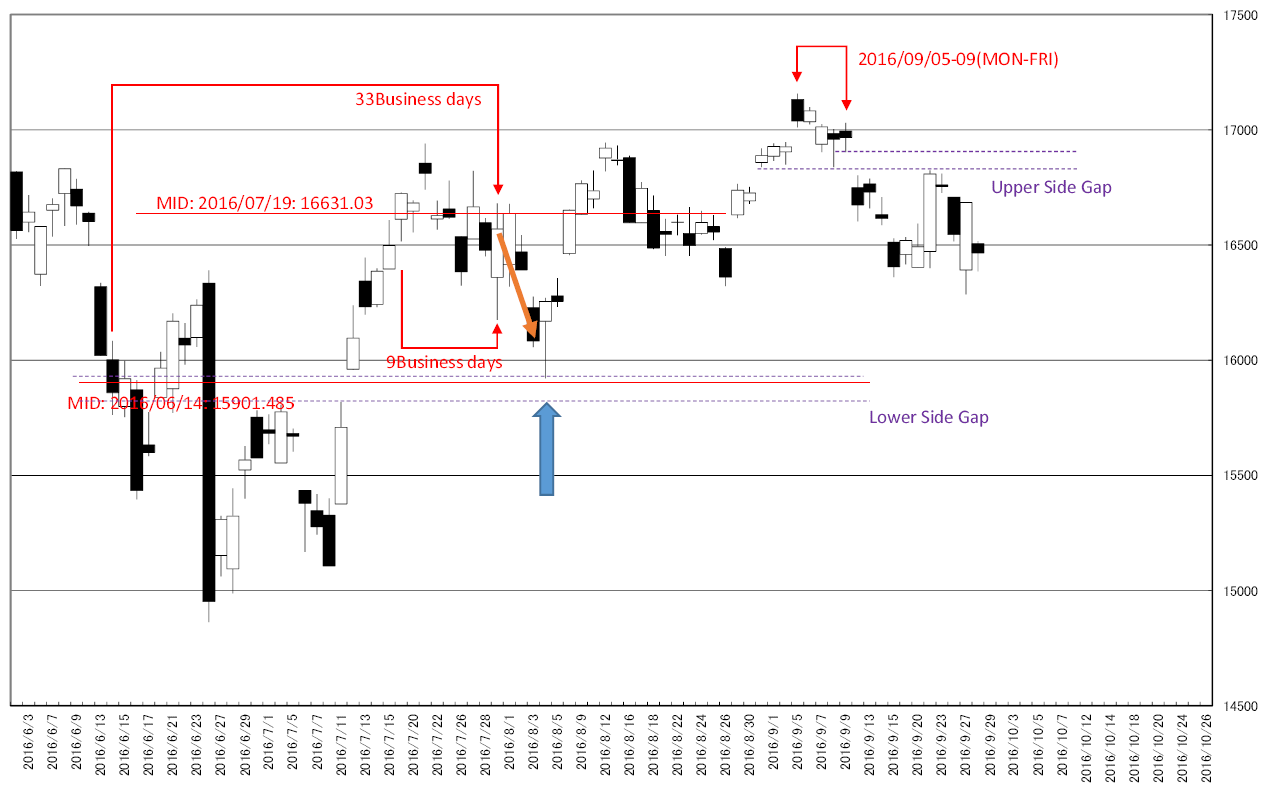
2016/07/21のレポートでは「結論は2016/07/26、2016/08/01、2016/08/10は変化日。基本的な見通しは16000円ミドルをサポート、レジスタンスは17697.96円。」としていました。

持ち合いの中の半値関係を挟んだ細かい変化となっていた地点でした。

また、16000円はサポートとなっていました。

We review our past “HIGARA” report in any time.

We reported ““HENKABI” are 07/26/2016, 08/01/2016 and 08/10/2016. Our basically view is 16000 yen middle will work as support and the resistance is 17697.96yen.” in 07/21/2016.

These points are the mid-price point of the latest steadiness.

And 16000yen worked as support.
1


2016/07/28のレポートでは「日経平均日足超短期・変化日2016/07/29・離れやすい地点なので注意」としていました。

一手挟み短期的な下落となり、短期的な離れとなりました。

We reported “NIKKEI 225 daily shortest term view; “HENKABI” is 07/29/2016 and may launch from here” in 7/28/2016.

And the market price felled after this point.


2016/07/25のレポートでは「日経平均週足・変化日・下が堅く17000円を超えるなら上は17500円付近まで」としていました。

結局は17000円台の滞空時間は短く、17000円台はレジスタンスとなりました。

We reported “NIKKEI 225 weekly; “HIGARA”; if lower side will be iron plated, the upper side limit will be 17500yen around” in 07/25/2016.

Keeping 17000yen over was very short term and we can know 17000 yen is resistance point.


以上の考察からわかることは、17000円がレジスタンス、16000円はサポート。

さらに値段を絞り込むのは、上方下方の窓です。

下の窓を埋められず上昇に転じ、上の窓を残し下方に転じています。

埋めたほうがトレンドになりやすいとみています。

From these facts, we can know 17000yen is resistance point and 16000yen is support point.

And the range is narrower now; upper and lower side gap is resistance and support.

Upper and lower side worked as support and resistance.

First burying gap will often become trend direction.
2


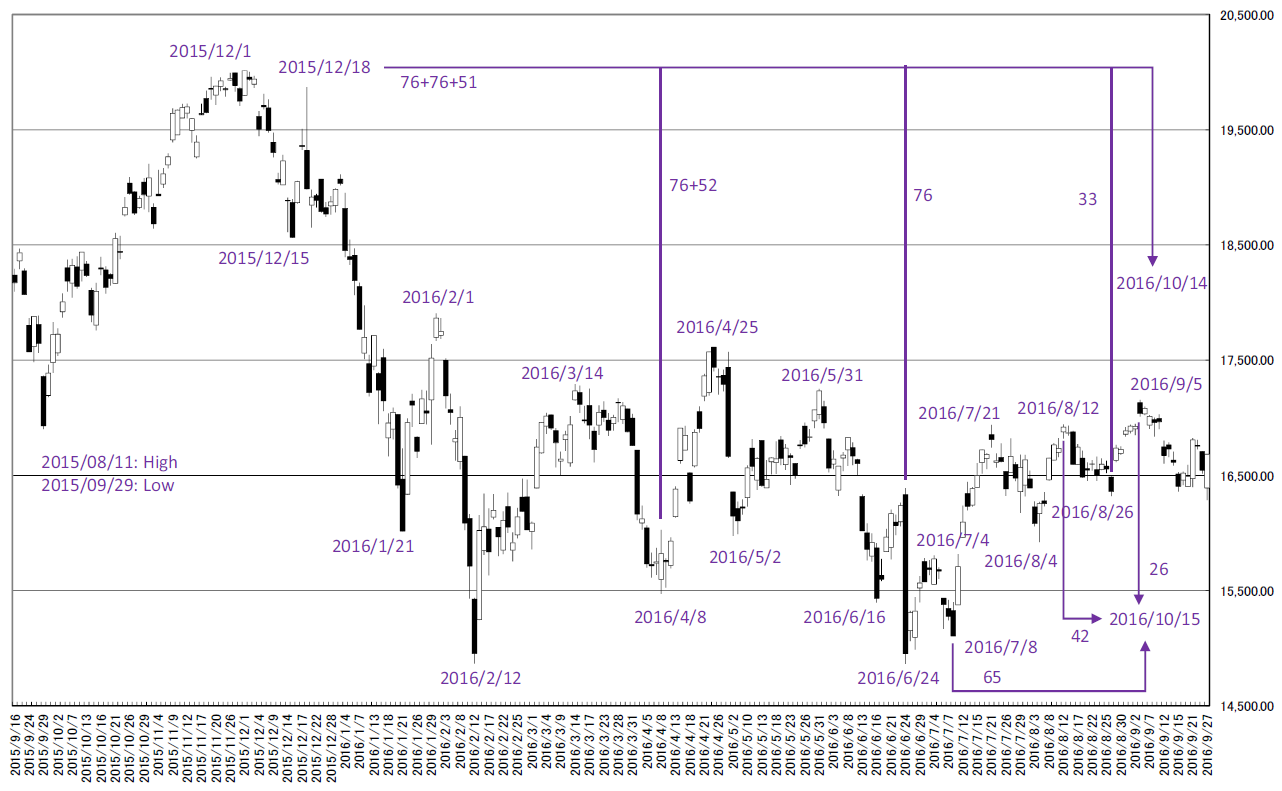
メジャーな頂点からの変化日の位置です。

図中で示す通り、2016/10/14、2016/10/15が注目の変化日です。

特に2016/06/24からの76手は注目の的です。

This is the “HENKABI” from the major peaks.

10/14/2016 and 10/15/2016 will become “HENKABI”.

In particular, 76 business days from 06/24/2016 will be most notable.
3


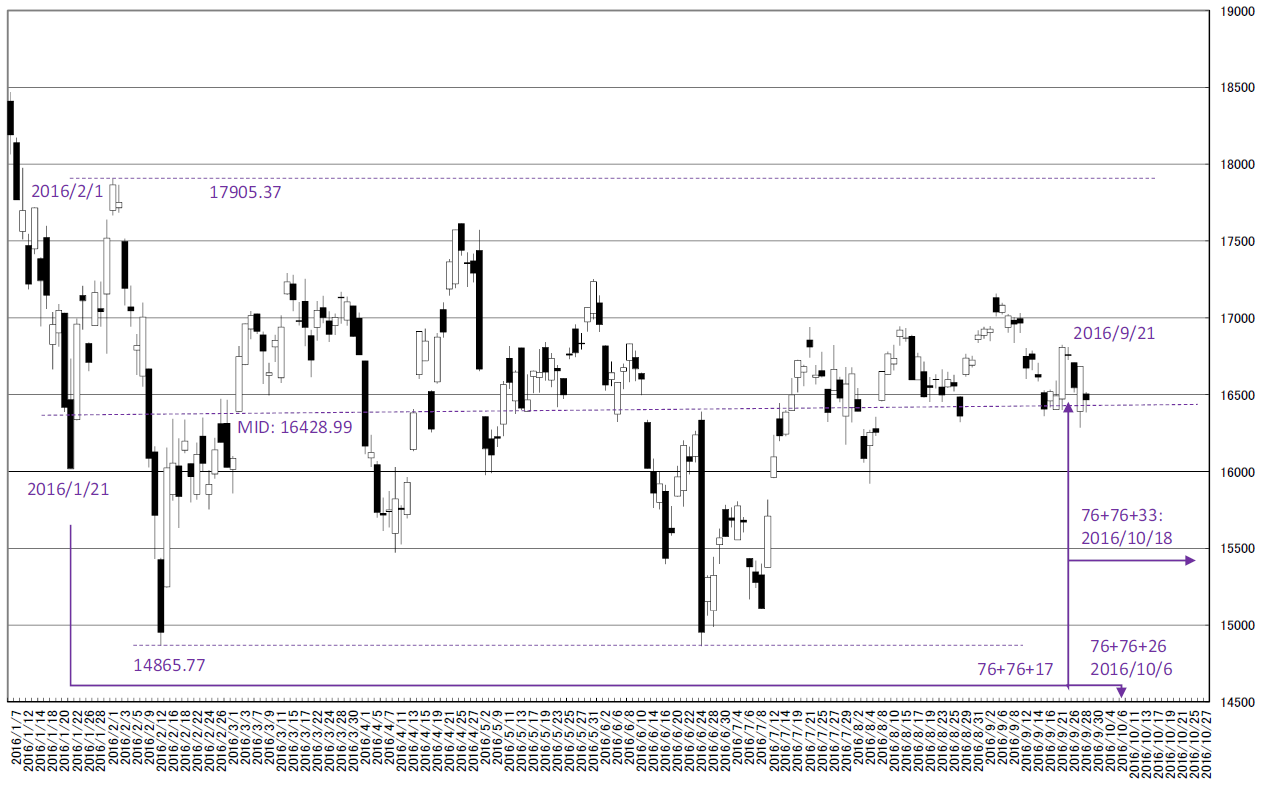
2016/01/21基点持ち合いからの変化日の位置です。

76+76+17手(2016/9/21)で既に高値を更新できずにいます。

16428.99円をサポートに持ちこたえていますが、下向きバイアスが強いとみえます。

76+76+26手は2016/10/6、76+76+33手は2016/10/14。

This is the “HENKABI” point from 1/21/2016 steadiness starting.

In 76+76+17days (9/21/2016), the market price did not take new high and this often means bearish.

16428.99yen worked well.

76+76+26 business day is 10/6/2016 and 76+76+33 business day is 10/18/2016.
4


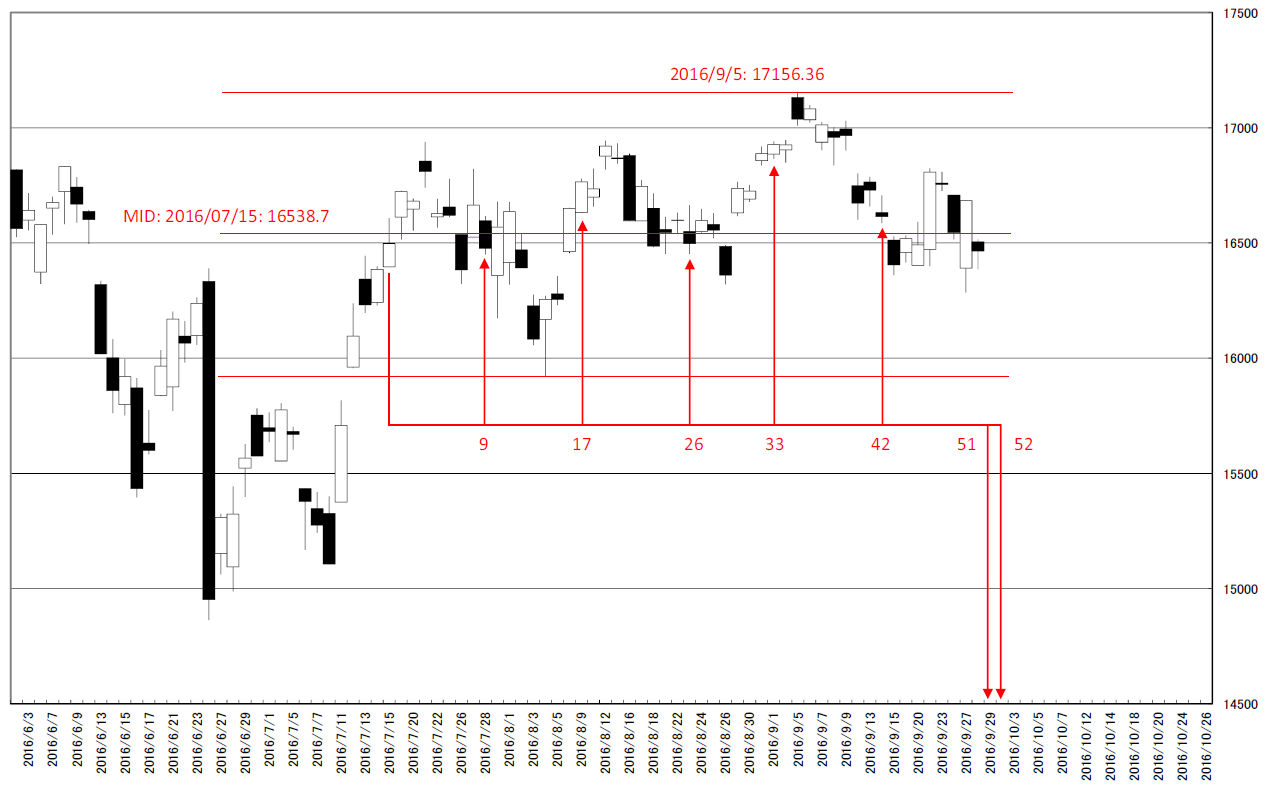
2016/07/15基点持ち合いからの変化日の位置です。

51手は2016/9/29、52手は2016/9/30。

This is the “HENKABI” point from 7/15/2016 steadiness starting.

51 business day is 9/29/2016 and 52 business day is 9/30/2016.
5


相場分析のリクエストがありましたら“Contact Us”からお知らせください。ご要望にお応えできるように努力いたします。

このブログはあくまでも個人的な見解であり、投資判断は各自でお願い致します。当ブログは一切の投資損益に対する責任を負いません。

ホームページに来て下さってありがとうございます。明日もよろしくお願いいたします。

If you have some request to analyze, please write to “Contact Us”.

We do best effort for your request.

These are only personal opinions on this blog, and you need the investment judgment in each one. This blog doesn’t assume the responsibility to all the investment profit and loss.

Thank for watching our contents. My best regards next day.

如果您需要行情分析,请点击“Contact Us”联系我们。我们将尽力满足您的要求。

本博客仅为个人意见,请各自做出投资判断。本博客概不对任何投资盈亏负责。

感谢您访问本博客。欢迎再次使用。

日経平均月足・年初来高値または年初来安値はこれからか?・9月の陰陽が方向性を示唆/ NIKKEI 225 Monthly; Yearly high or low will appear from now on; The candle stick color in September will imply the trend direction. /日经225。从现在开始呈现年度高价或者年度的安价吗?九月的蜡烛颜色将意味着趋势的方向。

2016/09/06

日経平均月足・年初来高値または年初来安値はこれからか?・9月の陰陽が方向性を示唆

NIKKEI 225 Monthly; Yearly high or low will appear from now on; The candle stick color in September will imply the trend direction.

日经225。从现在开始呈现年度高价或者年度的安价吗?九月的蜡烛颜色将意味着趋势的方向。


本日は日経平均月足についてです。

過去をなぞるなら今後の見通しは、年初来高値か年初来安値が示現する可能性あり。

メインシナリオは、2016/01/09のレポート「日経平均年足の分析(3)・年初第一週のパフォーマンス分析・年後半は落っこちる系か?」です。

しかし、2016/08/31のレポート「日経平均週足・ジムロジャースさんは「米国株がバブルになるかも」と言っていました・日本株もバブル前と似ています」のようなパターンもありえます。

派手に上げるか、奈落か、持ち合いではないと見ています。

注目は9月の月足線の陰陽です。

Today’s analyze is NIKKEI 225 monthly.

Following the past market, yearly high or low will appear from now on.

Our main scenario is “NIKKEI 225 annual No.3; the performance of the first week analysis; Later in this year may be falling” (See 01/09/2016 report)

But we reported “NIKKEI 225 week; Mr. Jim Rogers says “The U.S. Stock Market May Turn Into A Bubble” and Japanese stock is also” in 08/31/2016.

Our view is this market will be big rally or sharp fall and there will not be calm.

The candle stick color in September will be most notable.


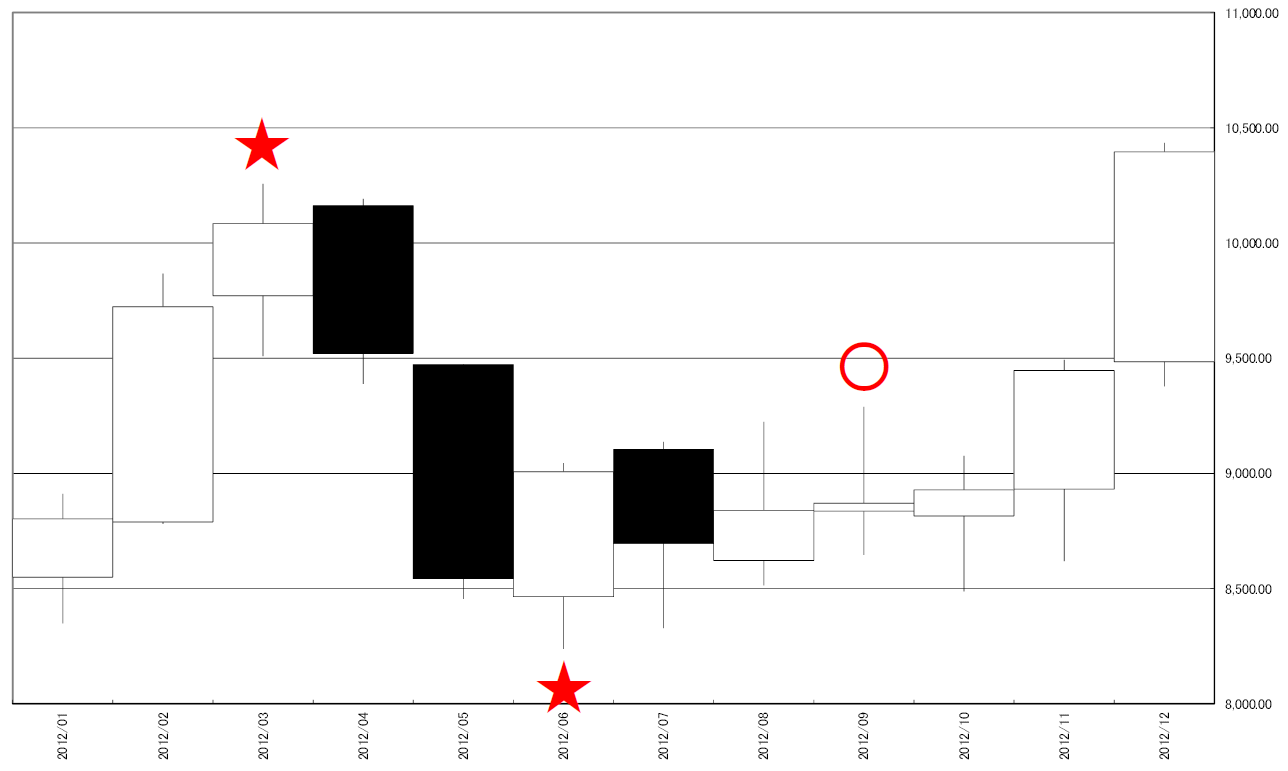
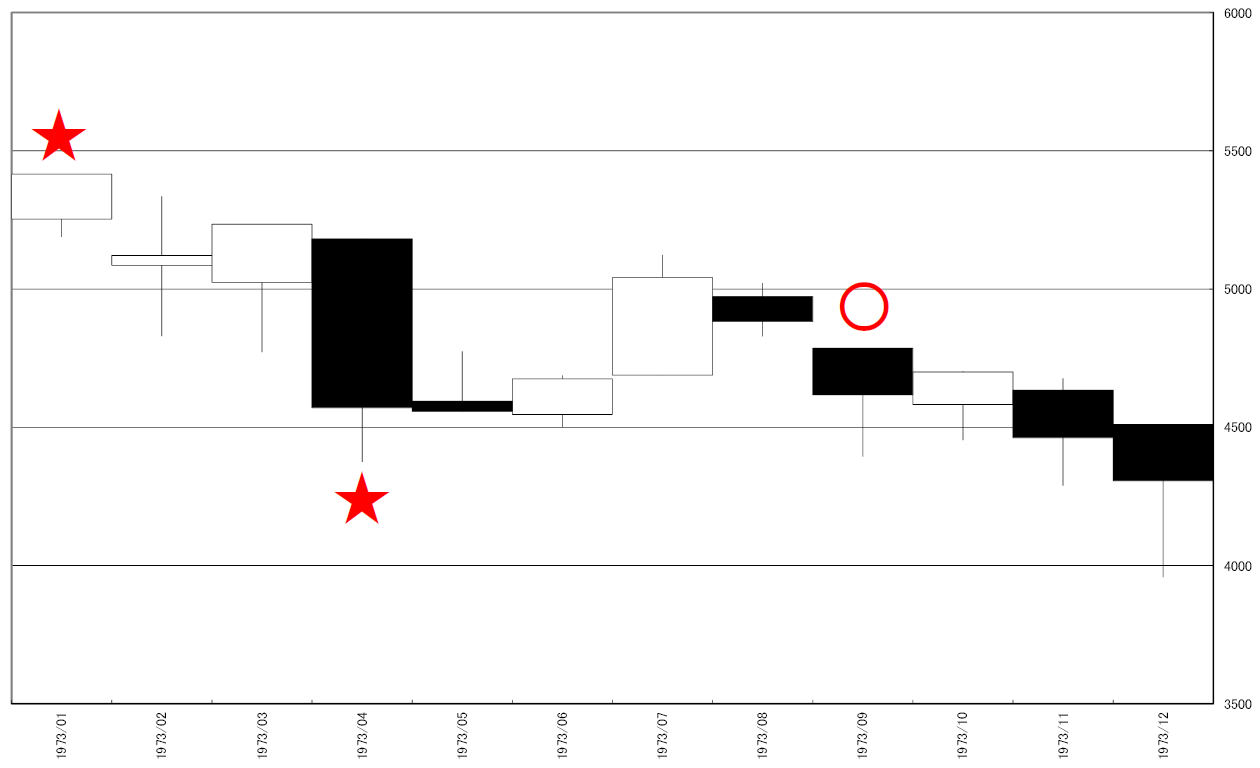
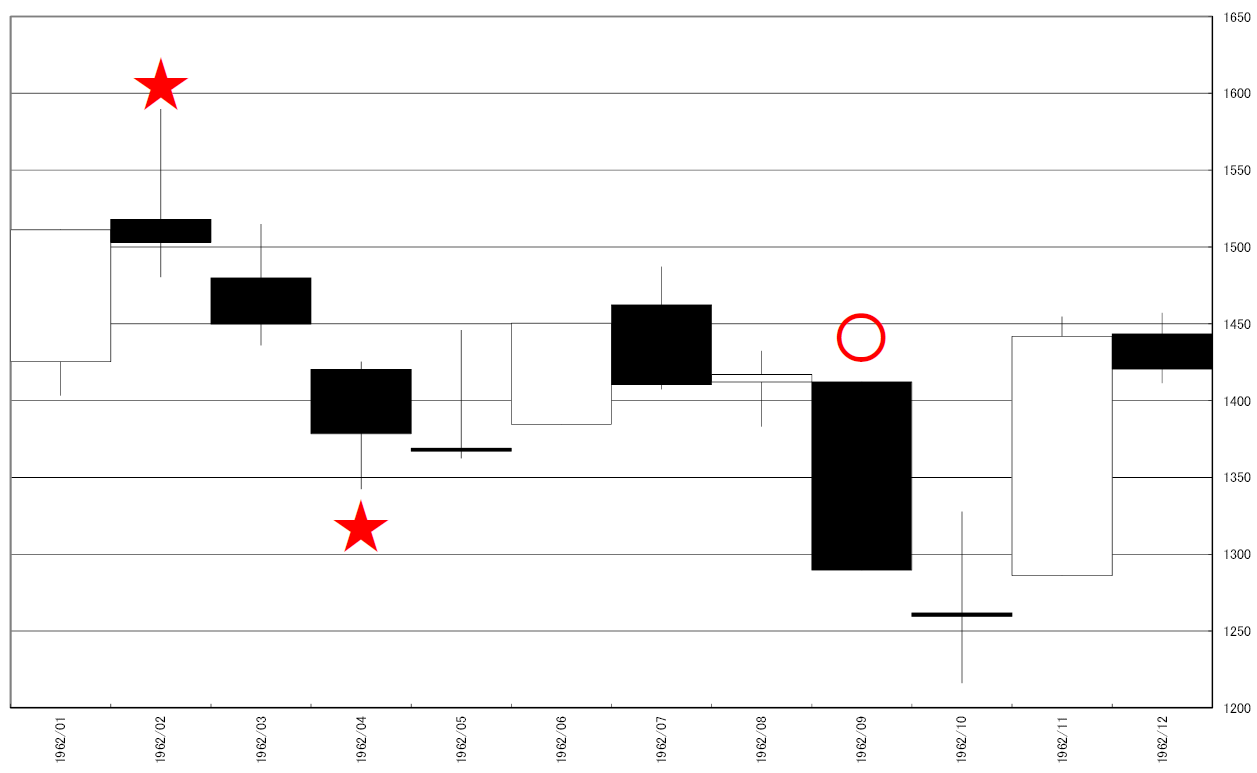
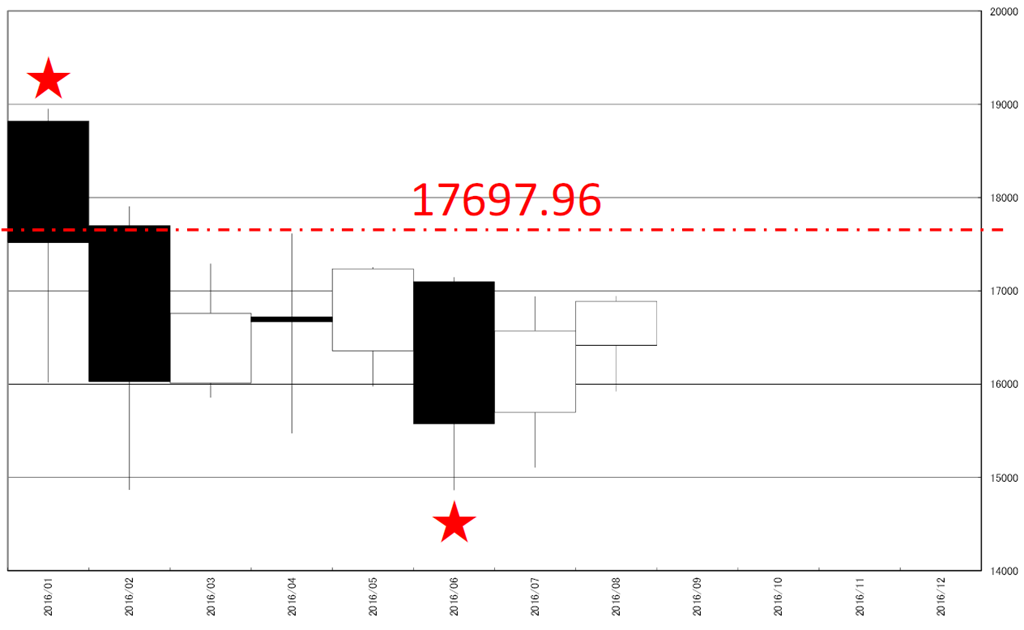
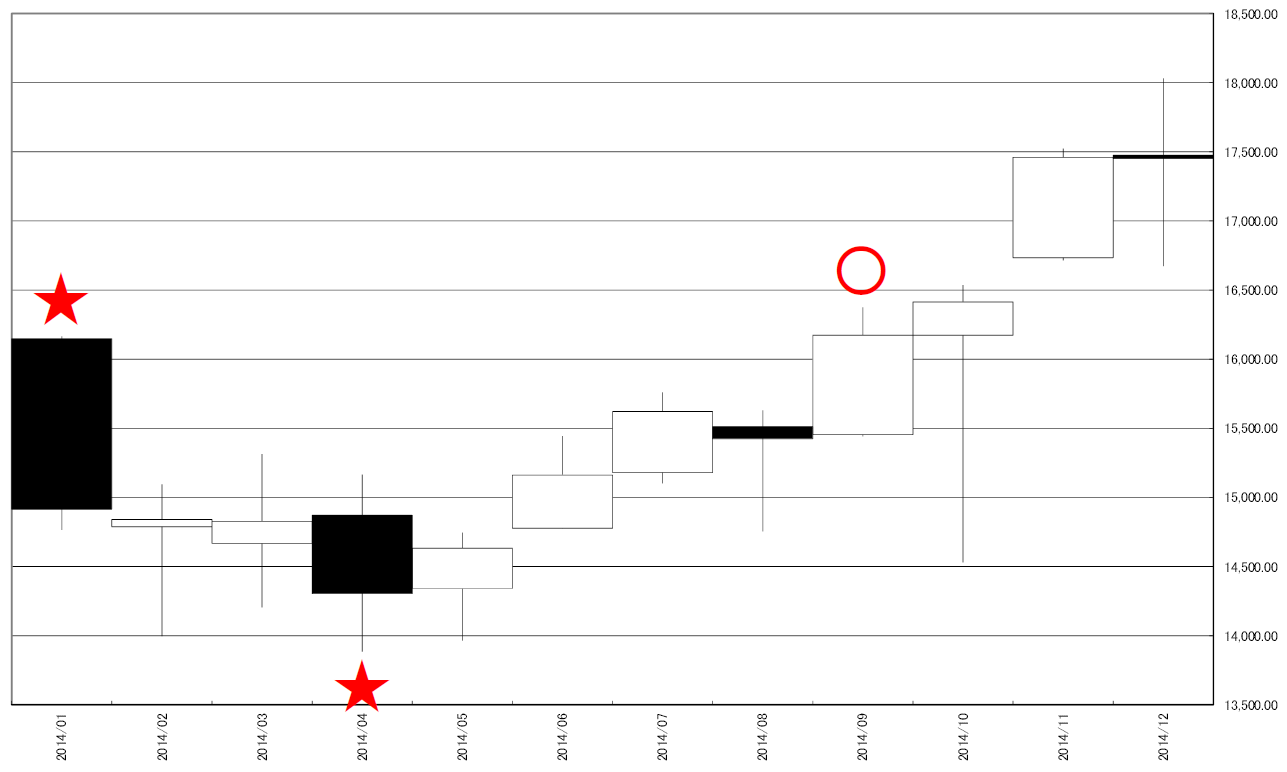
1960年以降、1月から8月までを比較したときに1,2,3月で年初来高値、4,5,6月で年初来安値をとったパターンは2016, 2014, 2012, 1973, 1962年の5パターンしかありません。

57年間で5回しか示現していないレア中のレアパターンです。

After 1960, there were only 5 patterns (2016, 2014, 2012, 1973, 1962) yearly high in Jan. Or Feb. Or Mar. and yearly low in Apr. Or May. Or Jun. (From January to August)

There were 5 cases in past 57 years and these pattern was rare cases.


過去のパターンを比較すると、年初来高値、安値のどちらかは9月以降に示現していました。

また、9月のろうそく足の陰陽が今後のマーケットのトレンドを示唆していることがわかります。

つまり、9月が陽線なら年末に向かって上げ、陰線ならば年末に向かって下げとみています。

Comparing to the past market, year high or low appeared from now on.

And the color of the candle stick in September implied the market trend.

That is to say, when the color of the candle stick in September will become while, we will be bullish and the other, will become black, this market will be bearish.


2016

2016


2014

2014


2012

2012


1973

1973


1962

1962


相場分析のリクエストがありましたら“Contact Us”からお知らせください。ご要望にお応えできるように努力いたします。

このブログはあくまでも個人的な見解であり、投資判断は各自でお願い致します。当ブログは一切の投資損益に対する責任を負いません。

ホームページに来て下さってありがとうございます。明日もよろしくお願いいたします。

If you have some request to analyze, please write to “Contact Us”.

We do best effort for your request.

These are only personal opinions on this blog, and you need the investment judgment in each one. This blog doesn’t assume the responsibility to all the investment profit and loss.

Thank for watching our contents. My best regards next day.

如果您需要行情分析,请点击“Contact Us”联系我们。我们将尽力满足您的要求。

本博客仅为个人意见,请各自做出投资判断。本博客概不对任何投资盈亏负责。

感谢您访问本博客。欢迎再次使用。

© 2026 Retar