日経225 : 日经225 : NIKKEI 225

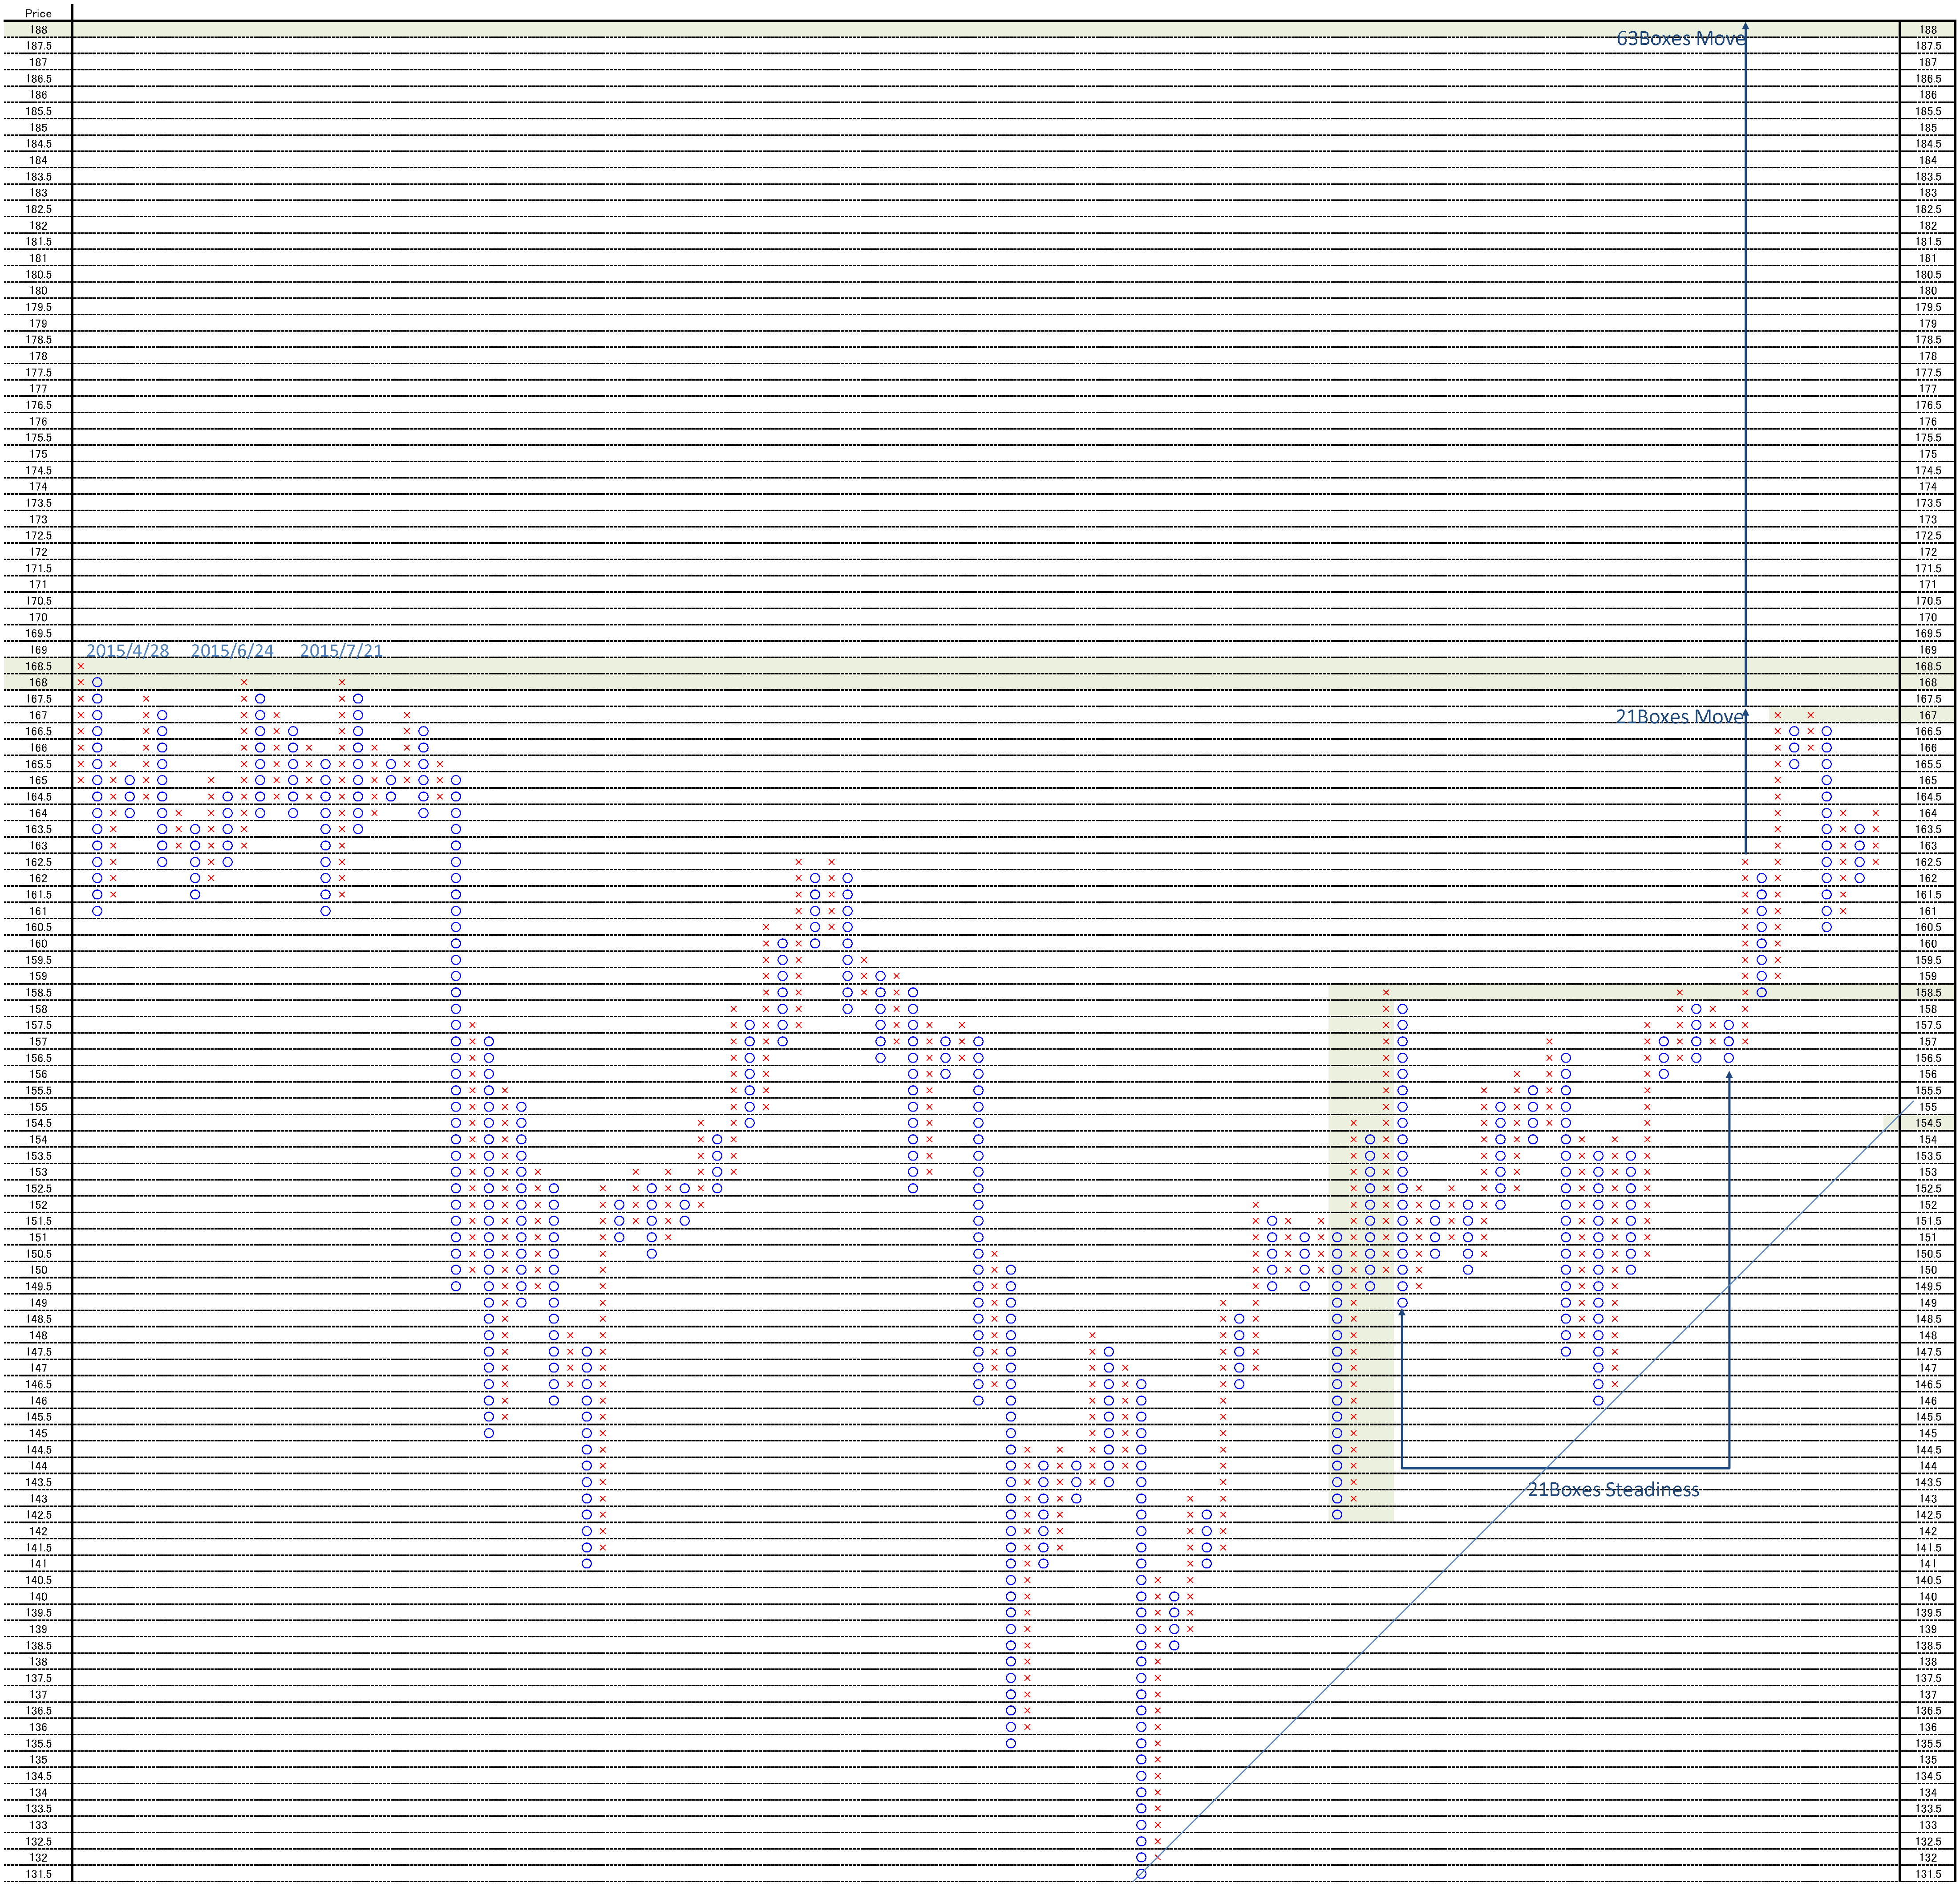
ドルベース日経225日足P&F・引き続き強気・新高値は1999-2000年以来の値/Dollar based NIKKEI 225 Daily P&F; Still bullish; New high is since 1999-2000. /美元换算的日经225。P&F分析。仍然牛市。新的高价是1999年 – 2000年以来的价。

2016/09/02

ドルベース日経225日足P&F・引き続き強気・新高値は1999-2000年以来の値

Dollar based NIKKEI 225 Daily P&F; Still bullish; New high is since 1999-2000.

美元换算的日经225。P&F分析。仍然牛市。新的高价是1999年 – 2000年以来的价。


ドルベース日経平均は引き続き強気です。

2016/08/31のレポートでは「日経平均週足・ジムロジャースさんは「米国株がバブルになるかも」と言っていました・日本株もバブル前と似ています」と報告しています。

日経平均は好位置につけている点は認めますが、メインビューは既にピークアウトしている可能性の方が高いとみています。

チャートに従って粛々と分析を続ける局面です。

Dollar based NIKKEI 225 is still bullish.

In 08/31/2016, we reported “NIKKEI 225 week; Mr. Jim Rogers says “The U.S. Stock Market May Turn Into A Bubble” and Japanese stock is also”.

We admit this opinion and N225 is still being proper price zone but our main view is bearish; this market seems to have already peaked out.

Now is the time for chart analyzing.


日経225クローズとドル円のNYクローズの値段から算出しています。

昨日までのデータで作成しています。

45度線を切らないため、引き続き強気です。

21枠持ち合いからの3倍返しのターゲットは188ポイントです。

Today is about Dollar based NIKKEI 225 daily.

We calculate Nikkei 225 closed price and Dollar/Yen NY close price.

The market price does not cut 45 degree support and this means bullish signal

The target price is 188 point. (21boxes steadiness and 3 times move)
pf1


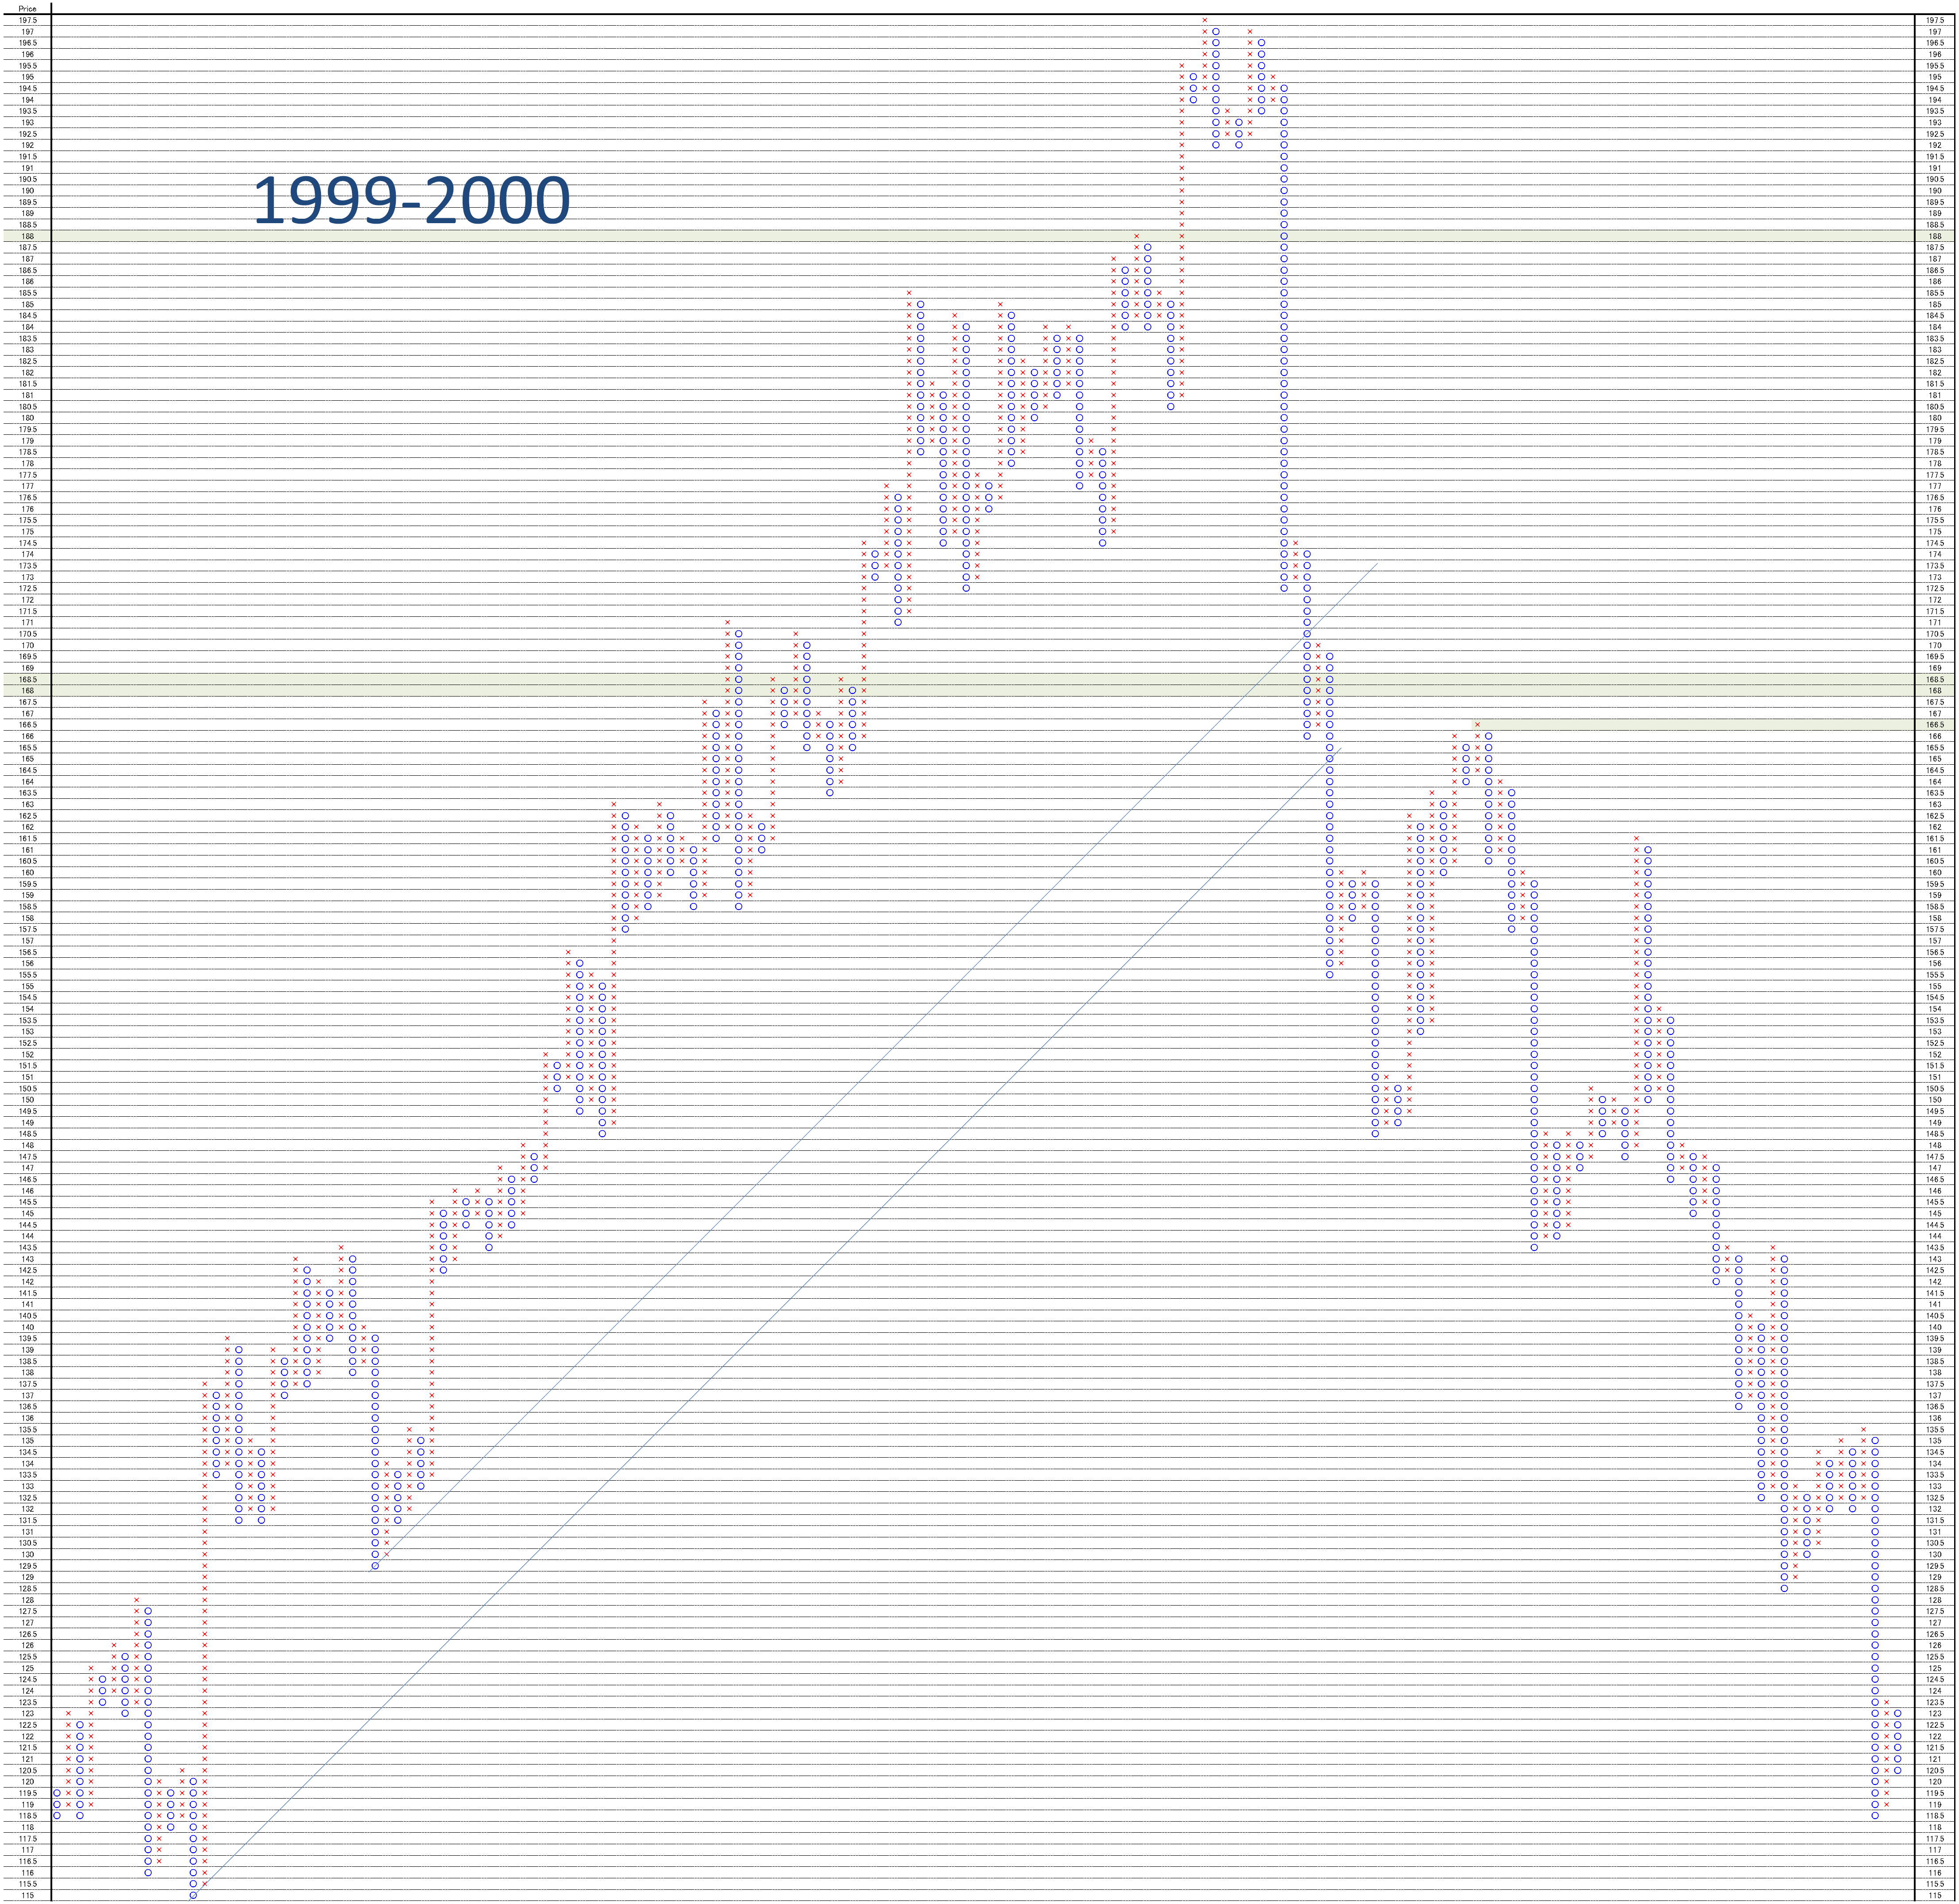
さて、1999-2000年のPFです。

168-170ポイント付近のレジスタンス。

188ポイントのレジスタンス。

166.5ポイントの天井。

「166.5ポイントの天井」というのはどこかで見たことあったような???

既視感のあるチャートだと思います。

Now, this is the P&F from 1999 to 2000.

From 168 point to 170 point worked as resistance.

188 point worked as resistance.

166.5 point was major peak.

“Major peak was 166.5 point”, I have seen right now!

This seem to be déjà vu.
pf2


相場分析のリクエストがありましたら“Contact Us”からお知らせください。ご要望にお応えできるように努力いたします。

このブログはあくまでも個人的な見解であり、投資判断は各自でお願い致します。当ブログは一切の投資損益に対する責任を負いません。

ホームページに来て下さってありがとうございます。明日もよろしくお願いいたします。

If you have some request to analyze, please write to “Contact Us”.

We do best effort for your request.

These are only personal opinions on this blog, and you need the investment judgment in each one. This blog doesn’t assume the responsibility to all the investment profit and loss.

Thank for watching our contents. My best regards next day.

如果您需要行情分析,请点击“Contact Us”联系我们。我们将尽力满足您的要求。

本博客仅为个人意见,请各自做出投资判断。本博客概不对任何投资盈亏负责。

感谢您访问本博客。欢迎再次使用。

日経平均週足・ジムロジャースさんは「米国株がバブルになるかも」と言っていました・日本株もバブル前と似ています/NIKKEI 225 week; Mr. Jim Rogers says “The U.S. Stock Market May Turn Into A Bubble” and Japanese stock is also. /日经225。吉姆•罗杰斯(Jim Rogers)先生说;“美国股市可能转成泡沫”。日本股票是前面的泡类似的。

2016/08/31

日経平均週足・ジムロジャースさんは「米国株がバブルになるかも」と言っていました・日本株もバブル前と似ています

NIKKEI 225 week; Mr. Jim Rogers says “The U.S. Stock Market May Turn Into A Bubble” and Japanese stock is also.

日经225。吉姆•罗杰斯(Jim Rogers)先生说;“美国股市可能转成泡沫”。日本股票是前面的泡类似的。


本日は日経225週足についてです。

2016/08/29にジムロジャースさんは「米国の株式はバブルになるかも」と報告しています。

本日は日経平均もそういった可能性あるかを検証しました。

結論は過去の値動きをトレースするなら「ある」です。

今後の値動きの前提条件として、今後深い下押しをせず年末18000円となると、2017年は一本調子の上げとなり、2017年末のターゲットが25000円となる位置になるとみています。

ただし、今年年末から年初にかけて失速するようでは、来年は15000円を割れ、更なる底へ向かうとみています。

Today is about N225 weekly.

In 08/29/2016, Mr. Jim Rogers reported “The U.S. Stock Market May Turn Into A Bubble” in his Blog.

We survived the similar possibility in Japanese stock market.

Our conclusion is “Japanese stock market has similar possibility to U.S.”.

And there needs some prerequisites; the market will not become big fall and will become 18000yen around and 2017 will be bull market and the price will reach at 25000yen around at the end of the year.

But if the market will fall from the end of this year to the beginning of the next year, the market price will cut 15000yen again and will be more fall.


2016/01/09のレポート「日経平均年足の分析(3)・年初第一週のパフォーマンス分析・年後半は落っこちる系か?」では「今年であれば17697.96円。この値段を心に刻みたいと思います。」と報告しています。

また、2016/7/3のレポート「TOPIXと日経平均日足P&F; 1997-1998年の相場と似ている。戻りが16000円台後半なら本当にソックリ」とも報告しています。

しかしながら、値動きというのは紙一重と感じます。

We reported “This is 17697.96 yen in this year. We need to remind it” in our report “NIKKEI 225 annual No.3; the performance of the first week analysis; Later in this year may be falling.” (See 01/09/2016)

And we reported “TOPIX (Tokyo stock Price Index) and N225 Daily P&F; Now is similar to 1997-1998 market and the price may recover 16000yen high” in 7/3/2016.

The price movement is a very fine line.


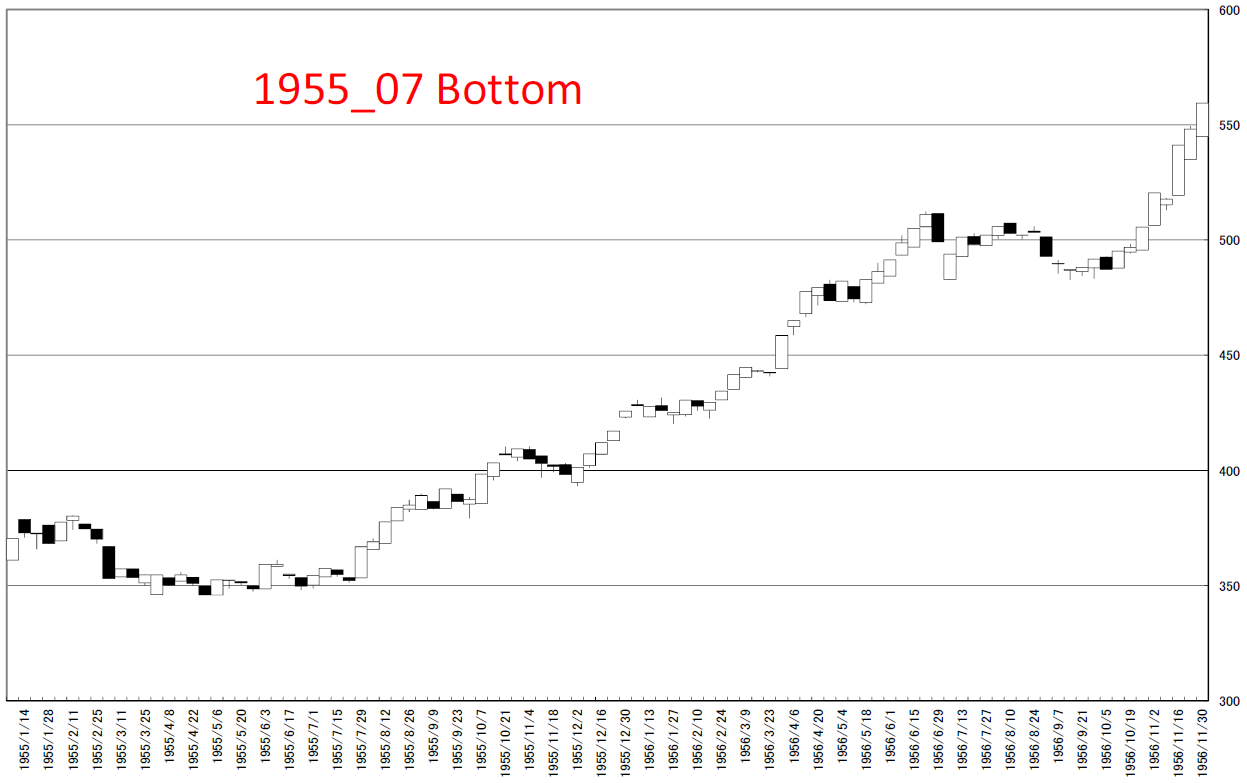
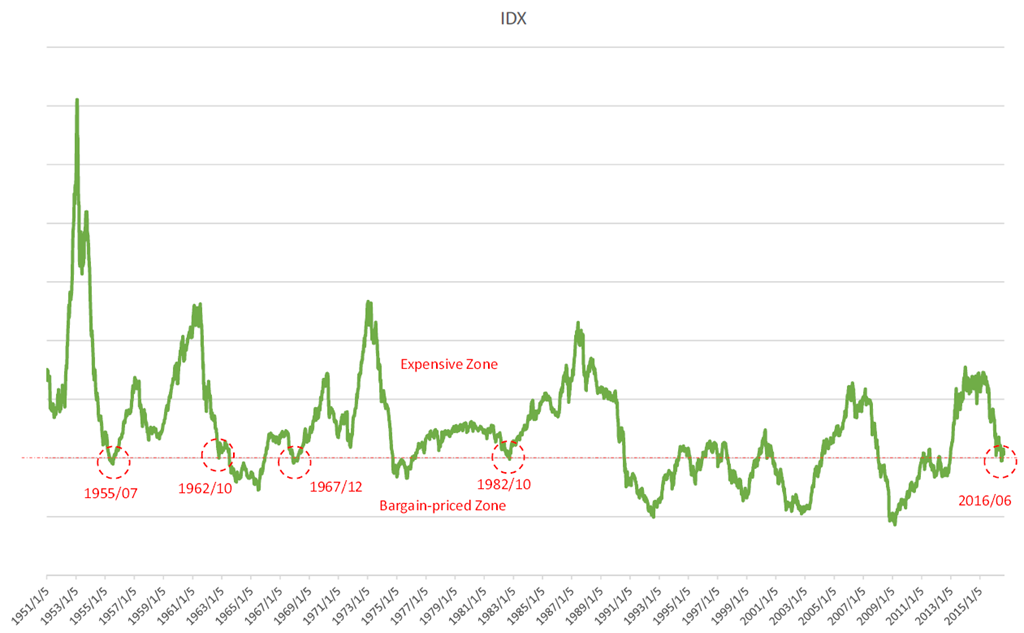
はじめに1950年以降のRetar INDEXです。

2016/06の底は超長期の中長期のイーブンに位置する地点であり、この地点は底堅く推移してきた過去があります。

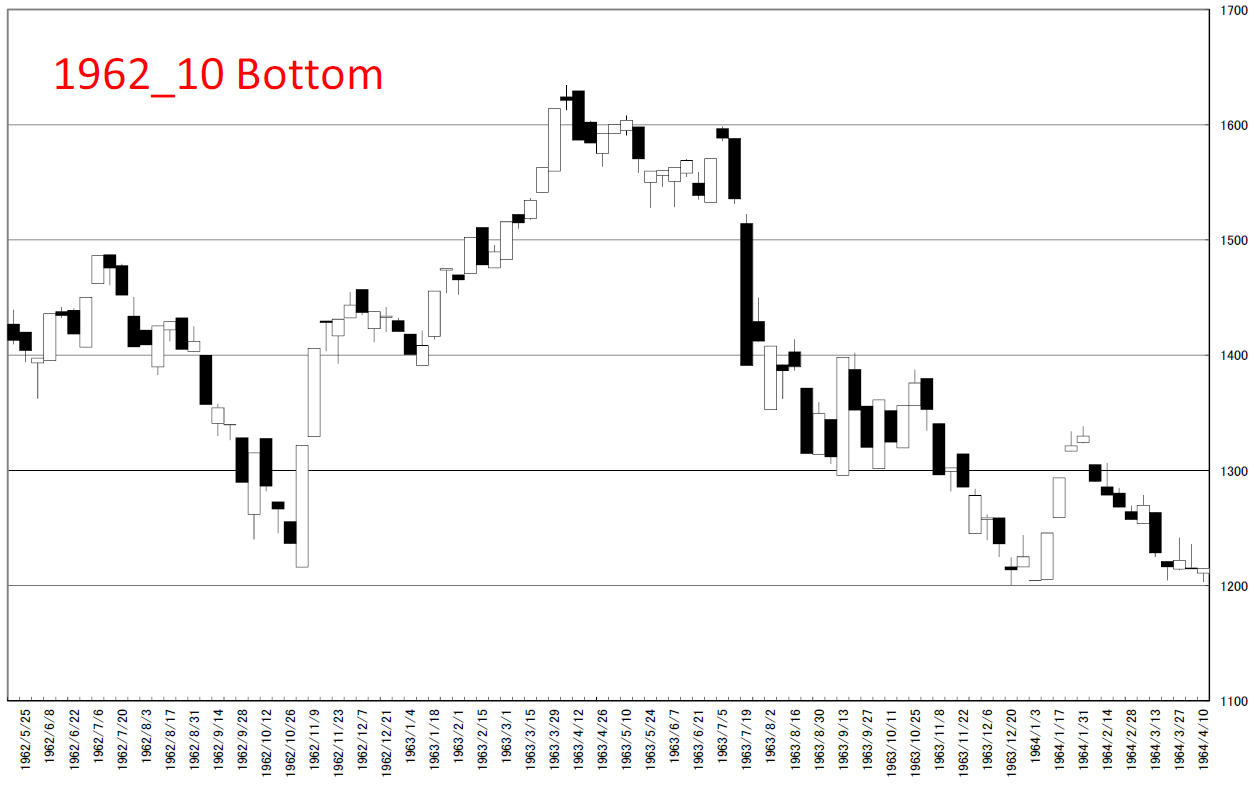
ただし、1962/10の底の地点では、失速してしまいました。

This is Retar Index chart after 1950.

06/2016 was even point in mid-to-long term valuation and the market price was well supported at this point.

But in 1962, the market price felled.

1


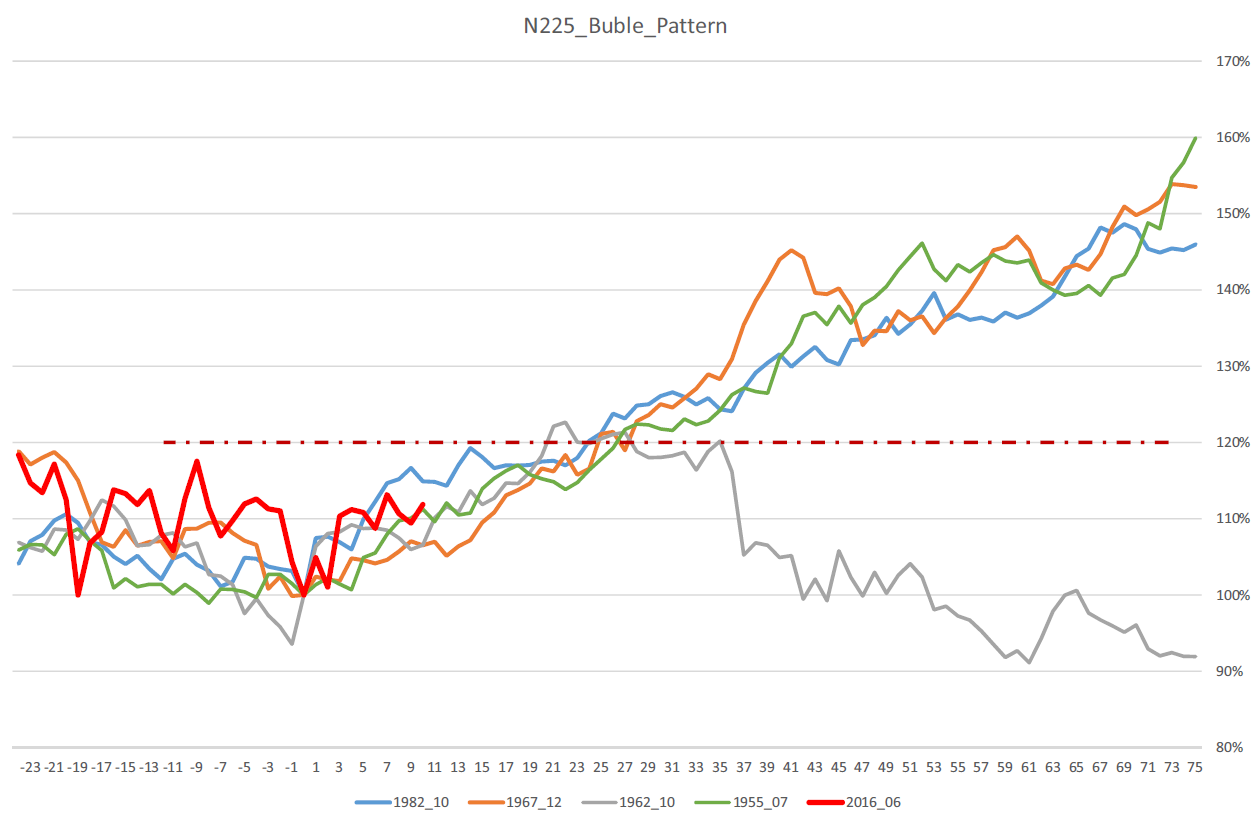
インデックスの底値の週末終値を100%としています。

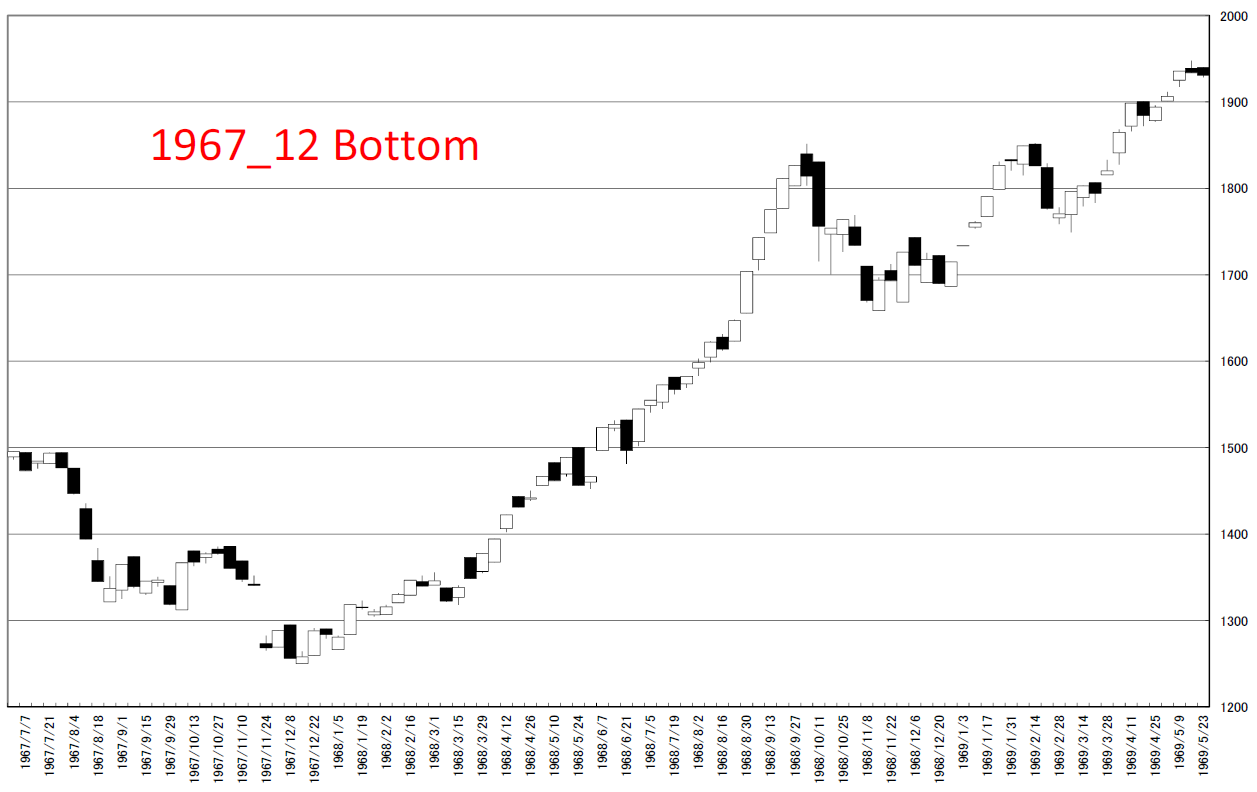
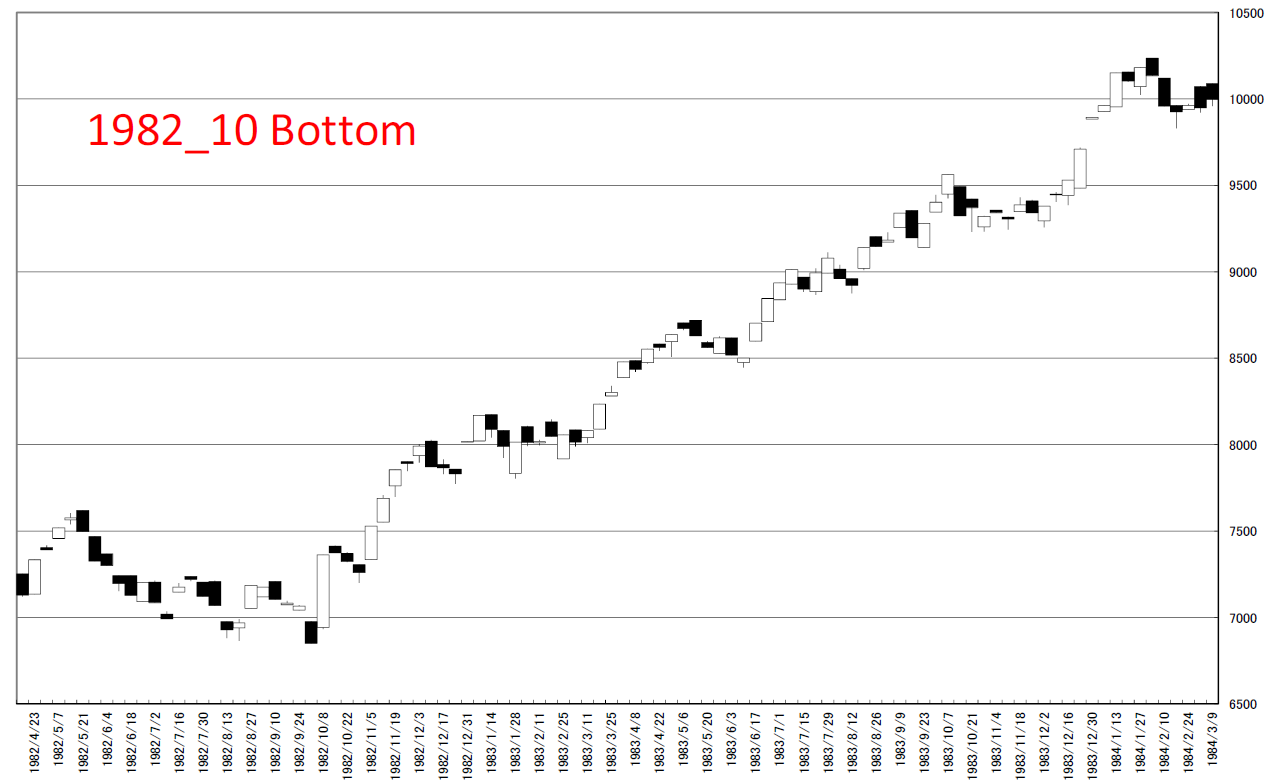
もし、2016/06を底として、現在がバブル前夜だとすると、現在は底割れせずに「結構頑張っているじゃん」です。

もし、このまま15000円をキープできたとして、今後運命の分かれ道となりそうなのが、2016/06末からの26週を迎える2016年末です。

新年を境に失速するようであれば、1962年パターンをとることになり、年末は15000円割れ。

年末18000円超えとなるようであれば、翌年末は25000円を超える昇竜となる可能性を秘めた相場になるとみています。

つまり、日本の株式市場もバブル前夜の好位置となります。

We tread the weekly close price in Retar Index lowest point as 100%.

If 06/2016 was the major bottom and now is the starting of bubble, the latest price seems to keep good position.

If the market price will keep 15000yen, the next junction will be at the end of this year. (26weeks from 06/2016)

If the market price will at the beginning of the next year, the market price will follow 1962 pattern and will cut 15000yen.

If the market price will cut 18000yen over at the end of the year, there is some possibility of the market price may reach 25000yen over at the end of 2017.

After all, Japanese stock market keeps good position popping bubble.

2

3

4

5

6


相場分析のリクエストがありましたら“Contact Us”からお知らせください。ご要望にお応えできるように努力いたします。

このブログはあくまでも個人的な見解であり、投資判断は各自でお願い致します。当ブログは一切の投資損益に対する責任を負いません。

ホームページに来て下さってありがとうございます。明日もよろしくお願いいたします。

If you have some request to analyze, please write to “Contact Us”.

We do best effort for your request.

These are only personal opinions on this blog, and you need the investment judgment in each one. This blog doesn’t assume the responsibility to all the investment profit and loss.

Thank for watching our contents. My best regards next day.

如果您需要行情分析,请点击“Contact Us”联系我们。我们将尽力满足您的要求。

本博客仅为个人意见,请各自做出投资判断。本博客概不对任何投资盈亏负责。

感谢您访问本博客。欢迎再次使用。

© 2026 Retar