日経225 : 日经225 : NIKKEI 225

日経平均週足・トレンドライン分析・2008/01/04とよく似た線が引けます/NIKKEI 225 weekly; Trend line analysis; we can draw similar to 01/04/2008. /日经225。趋势线分析。我们可以得出2008年1月4号的相似形成。

2016/01/08

日経平均週足・トレンドライン分析・2008/01/04とよく似た線が引けます

NIKKEI 225 weekly; Trend line analysis; we can draw similar to 01/04/2008.

日经225。趋势线分析。我们可以得出2008年1月4号的相似形成。


結論はベアマーケットか、ブルマーケットかの瀬戸際です。

2015/12/25のレポートでは羽黒15(11)号線について、「日経平均週足・羽黒15(11)号線・下げても尻尾。底入れか」と報告していましたが、どうやら、そうではなさそうでした。

2015/12/24のレポートでは「次の変化日(2016/1/5)まで、レジスタンス19215.80円、サポート18562.51円の持ち合いだとみています」とも報告しており、2016/01/04にサポート割れしたため、以降、崩れの警戒が必要になりました。

Now is the watershed of the bull or bear.

We reported “NIKKEI 225 weekly is “HAGURO” No.15 (11) formation; Next week may be a small fall and bottom is the close” but it did not so.

We reported “The first scenario is the resistance is 19215.80yen and the support is 18562.51yen” in 12/24/2015 and the support point was cut in 01/04/2016 and this was the bearish signal.


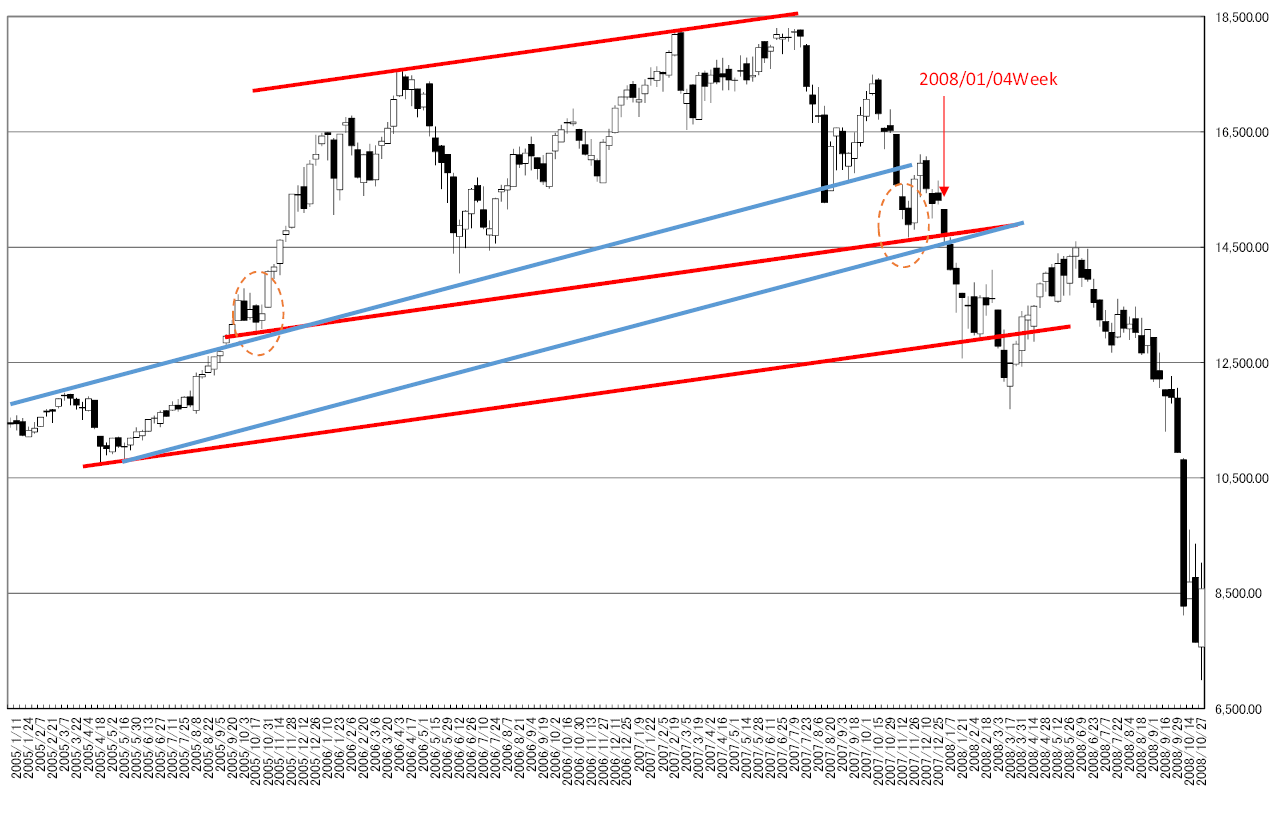
本日は「ヤバッチー・トレンドライン」が引けましたので紹介します。

本日は2008年相場と現在の比較をしました。

はじめに赤のトレンドラインです。

赤は最外郭レジスタンスラインであり、平行に引いてくると、オレンジのところにやってきます。

オレンジの左側は一段上げ前にモニョモニョしたところ。

右側の到達点は、本日チャートでは安値より少し下、2008/01/04のチャートでは割り込みとなっています。

年初に最外郭に関わる動きになっている点が気になります。

そして、青のトレンドライン。

青はモニョモニョ前の窓を通る最外郭線でした。

これは、本日の最外郭線と一緒であり、2008/01/04の週も全く同じ最外郭線が引けました。

違いがあるにせよ、気分は2008/01/04の週です。

Today, we introduce very much interesting trend line.

We compared today’s chart and 2008 chart.

First is red trend line.

This is the most outer line and when it’s pulled to parallel, this line draw at orange circles.

Left side of orange circle is the steadiness point.

And the right side is drawing the lower than today’s price and in 2008’ chart, this line was cut.

We are interested in the price was related at the beginning of the year.

And the blue line was the most outer line as the support.

This line can draw in each of these charts.

There are some difference but we can remind 01/04/2008 week.


<2016>
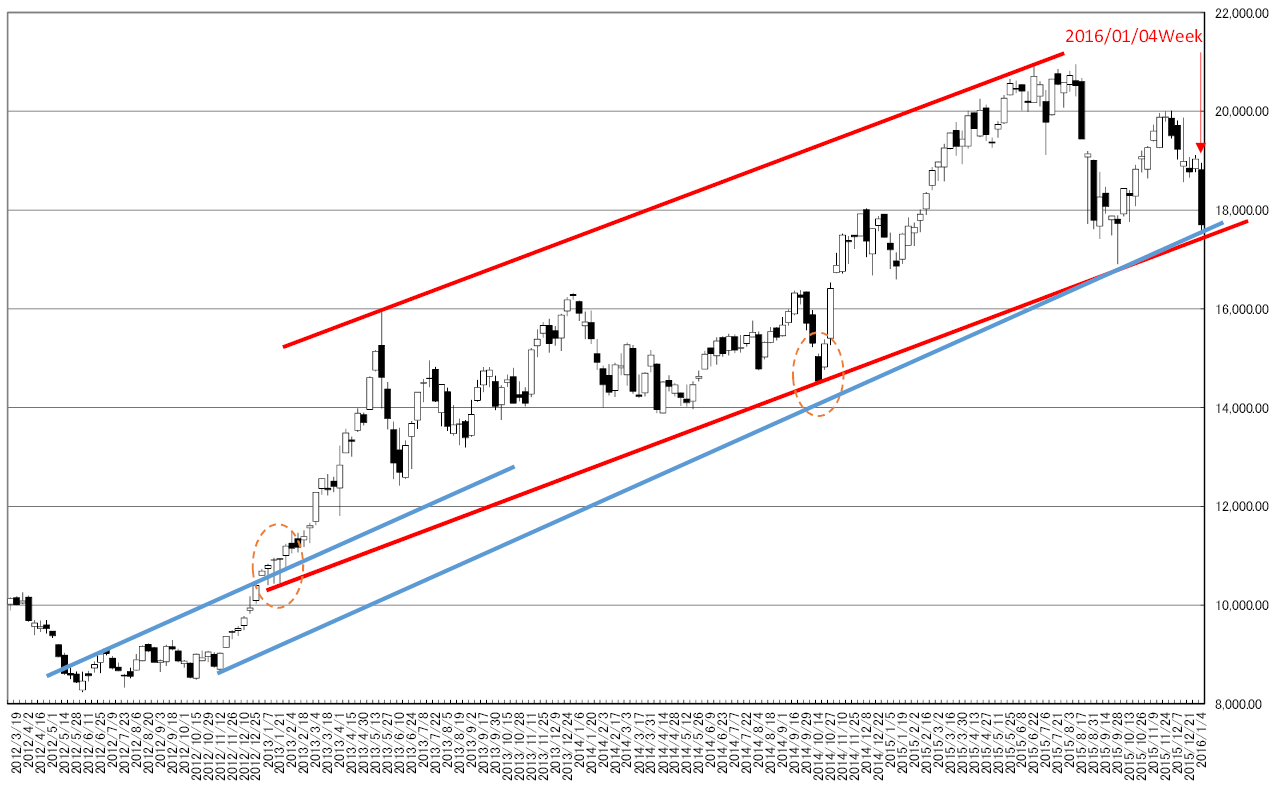
2016


<2008>

2008


相場分析のリクエストがありましたら“Contact Us”からお知らせください。ご要望にお応えできるように努力いたします。

このブログはあくまでも個人的な見解であり、投資判断は各自でお願い致します。当ブログは一切の投資損益に対する責任を負いません。

ホームページに来て下さってありがとうございます。明日もよろしくお願いいたします。

If you have some request to analyze, please write to “Contact Us”.

We do best effort for your request.

These are only personal opinions on this blog, and you need the investment judgment in each one. This blog doesn’t assume the responsibility to all the investment profit and loss.

Thank for watching our contents. My best regards next day.

如果您需要行情分析,请点击“Contact Us”联系我们。我们将尽力满足您的要求。

本博客仅为个人意见,请各自做出投资判断。本博客概不对任何投资盈亏负责。

感谢您访问本博客。欢迎再次使用。

日経平均年足の分析(2)・4連騰の後は長い下ヒゲ、または下落?/NIKKEI 225 annual No.2; After 4 years continuous jumping, long lower shadow appeared or drop? /日经225。年K的分析。第2部。经过4年的不断跳跃,长下影线或出现下降?

2016/01/06

日経平均年足の分析(2)・4連騰の後は長い下ヒゲ、または下落?

NIKKEI 225 annual No.2; After 4 years continuous jumping, long lower shadow appeared or drop?

日经225。年K的分析。第2部。经过4年的不断跳跃,长下影线或出现下降?


本日は日経平均についてです。

1950年以降のデータについて調査しました。

Today’s analyze is NIKKEI 225.

We surveyed after 1950’s.


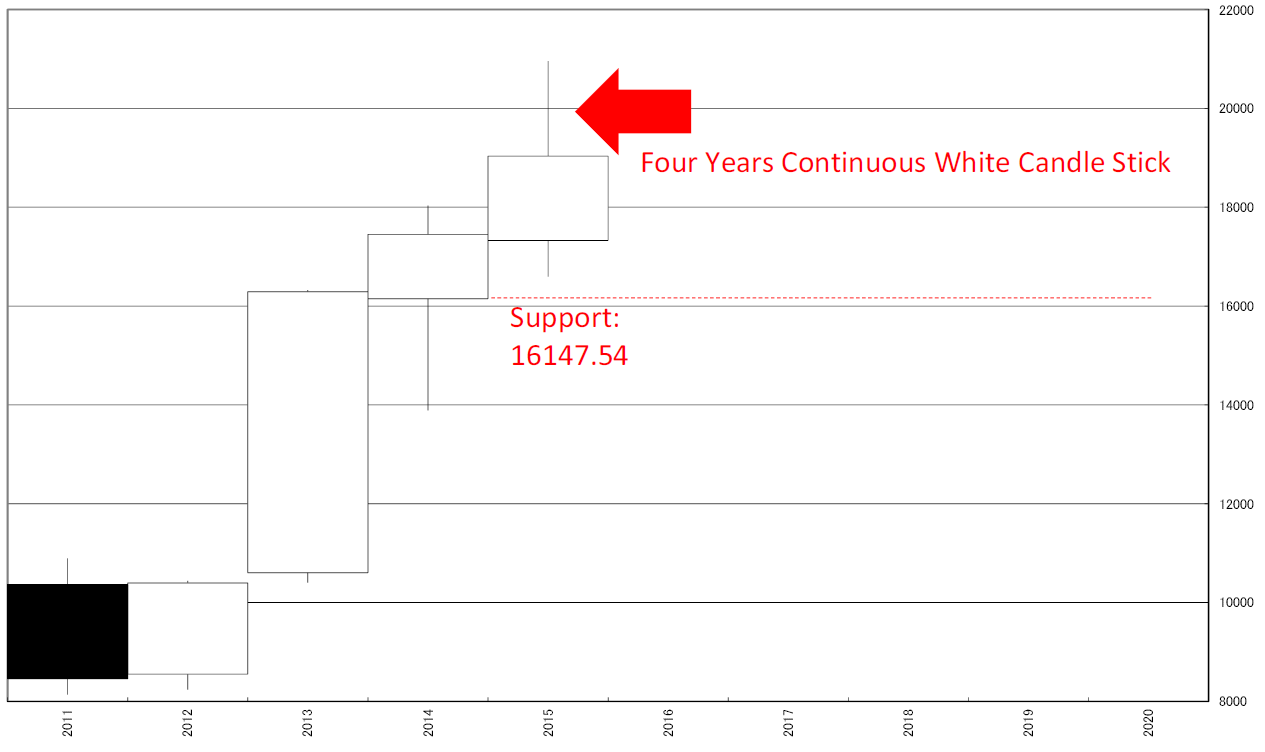
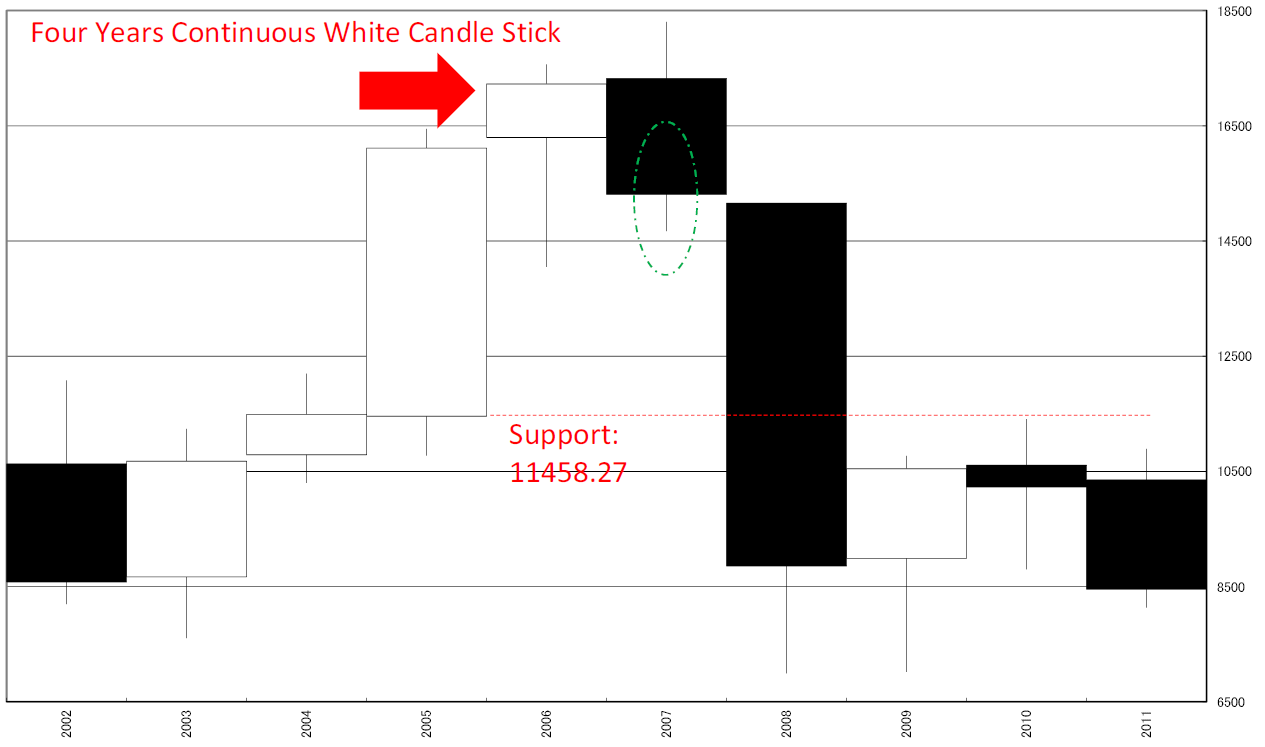
今年の特徴は「陰線後、4連騰の翌年」。

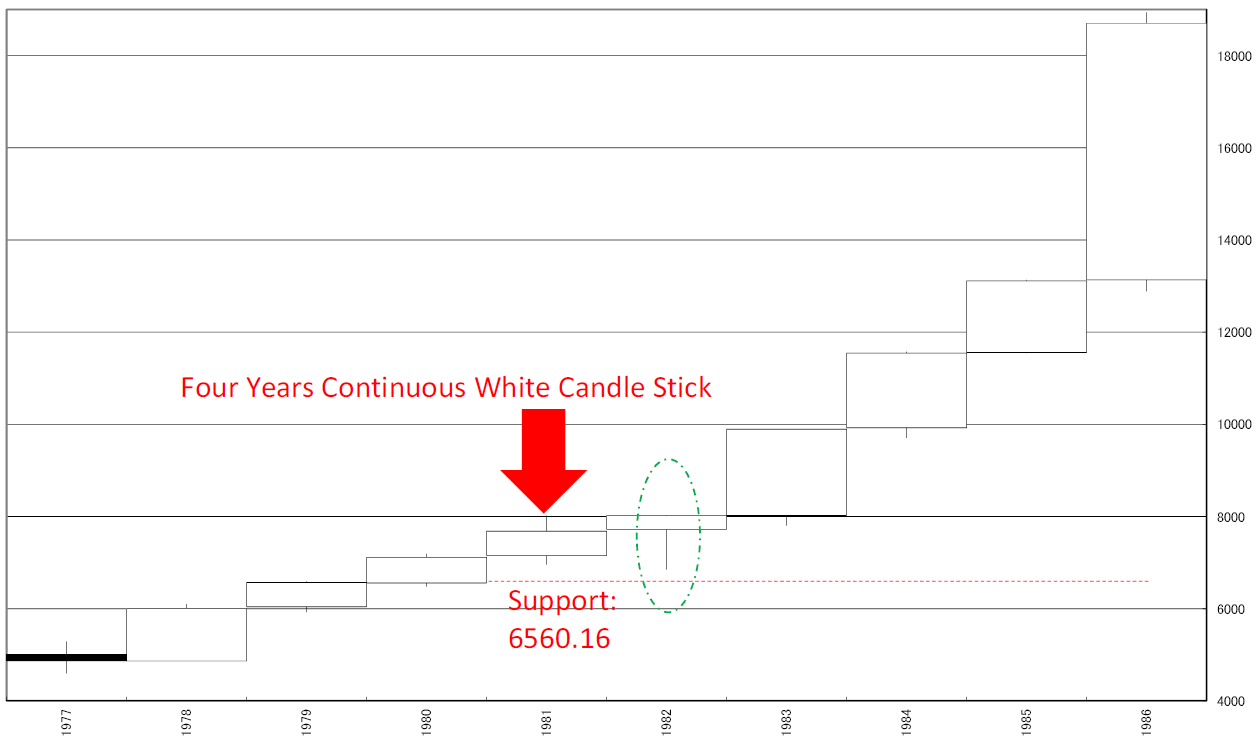
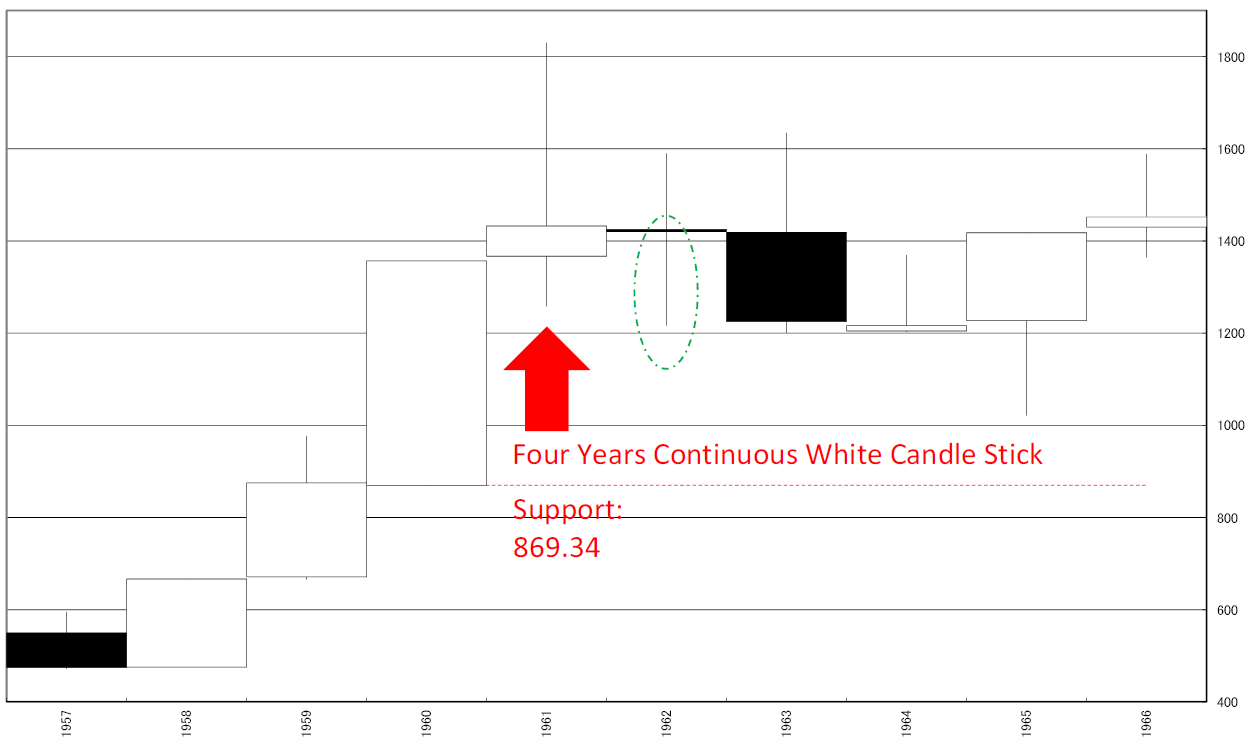
1950年以降の相場でこうした特徴を持つ都市は、1961年、1981年、2006年と3度ありました。

それぞれに、上げ、下げ、持ち合いとの分かれ道になっていました。

1961年の場合は、8年間もの間持ち合いを続け1968年まで新高値を取ることはありませんでした。

1981年の翌年は高値引けをしており、まさに駆け上がる寸前となりました。

2006年の場合は、陰線を出し、下落となりました。

そして新高値をとったのは、9年後の2014年でした。

This year’s most obvious character is “After black candle stick and 4 year continuous jumping”.

After 1950’s, the similar character years are 1961, 1981 and 2006.

They are the watershed of the market; jumping, falling and steadiness.

In 1961, the market keep steadiness for 8 years and took new high in 1968.

In 1981, the market price took the year high at the end of the next year.

In 2006, the market price formed the black candle stick and took new high after 9 years (2014).


これらのチャートの考察からわかることは、今年は過去の経験則的には、どうなるかわからない局面であるとみえます。

ただし、過去のチャートで共通することは、下げるか、長い下ヒゲを残すかといった特徴があるようです。

また、サポートとして期待できそうなのは、2年前の始値の16147.54円としたいと思います。

過去の相場で、上がっていく局面では、この水準を割ることなく上にいきました。

実体を伴って割り込むようであれば、オワッタということになるでしょう。

現在の相場に当てはめると、2000円ぐらい下の地点なので、そう遠いところではありません。

From these chart characters, we cannot know what will occur.

But there are common character in these chart; this year may remain long lower shadow or fall.

And the major support will be 16147.54 yen (the opening price in 2014).

In past market, if the market price was still bullish, the market price would not cut this price.

And cutting will mean the bearish signal.

Applying to this occasion, this is lower 2000 yen than the latest market and this is no so far.


<2015>

2015


<2006>

2006


<1981>

1981


<1961>

1961


相場分析のリクエストがありましたら“Contact Us”からお知らせください。ご要望にお応えできるように努力いたします。

このブログはあくまでも個人的な見解であり、投資判断は各自でお願い致します。当ブログは一切の投資損益に対する責任を負いません。

ホームページに来て下さってありがとうございます。明日もよろしくお願いいたします。

If you have some request to analyze, please write to “Contact Us”.

We do best effort for your request.

These are only personal opinions on this blog, and you need the investment judgment in each one. This blog doesn’t assume the responsibility to all the investment profit and loss.

Thank for watching our contents. My best regards next day.

如果您需要行情分析,请点击“Contact Us”联系我们。我们将尽力满足您的要求。

本博客仅为个人意见,请各自做出投资判断。本博客概不对任何投资盈亏负责。

感谢您访问本博客。欢迎再次使用。

© 2026 Retar