
日経225 : 日经225 : NIKKEI 225

日経平均年足の分析(10)・1950-2014年調査・統計的には今月17844.3円以下で引けると年足陰線の可能性が高まる/NIKKEI 225 annual No.10; Surveying from 1950 to 2014; statistically, if the price will cut 17844.3yen at the end of this month, annual candle stick often becomes black body. /日经225。年K的分析。第10部。调查从1950年到2014年。如果价格将削减17844.3日元在本月底结束,就蜡烛棒往往成为黑色的。

2015/09/09

日経平均年足の分析(10)・1950-2014年調査・統計的には今月17844.3円以下で引けると年足陰線の可能性が高まる

NIKKEI 225 annual No.10; Surveying from 1950 to 2014; statistically, if the price will cut 17844.3yen at the end of this month, annual candle stick often becomes black body.

日经225。年K的分析。第10部。调查从1950年到2014年。如果价格将削减17844.3日元在本月底结束,就蜡烛棒往往成为黑色的。


本日は日経平均月足についてです。

1950年から2014年の65年間を調査対象としています。

Today’s analyze is NIKKEI 225 Monthly.

We survey from 1950 to 2014. (65years monthly data)


はじめに日経平均の月間の値幅(open – close)の平均値、標準偏差を求めると、それぞれ、0.77%、5.67%となります。

この値から-1σの値は-4.9% (0.77%-5.67%)となります。

The monthly price range (open – close) of average and standard deviation are 0.77% and 5.67%.

And the -1 sigma is -4.9%. (0.77%-5.67%)


では、2015年8月の成績を調べてみると、オープンは20540.21円、クローズは18890.48円。

下落幅は8.03%((18890.48-20540.21)/ 20540.21)となり、-1σを超えています。

今月は-1σを超えたのは今のところ8月だけです。

And now, in August, the open price was 20540.21yen and the close price was 18890.48yen.

It felled 8.03%((18890.48-20540.21)/ 20540.21) and it went over -1 sigma.

And August was only month the range went over -1 sigma.


過去65年間のそれぞれで、-1σを超える下落が発生した回数と年足の陰陽の関係を、表にしました。

-1σを超える下落が0回と1回の時は大部分の場合で、陽線を立てています。

しかし、2回以上の-1σを超える下落が発生すると、年足はどちらかと言うと陰線が発生しやすくなります。

By each in the past for 65 years, we analyzed the relation between -1 sigma cutting times and annual candle stick color.

When the price went over zero or once, the price often took white candle stick.

But it went over twice and more, more than half cases, the candle stick color became black.
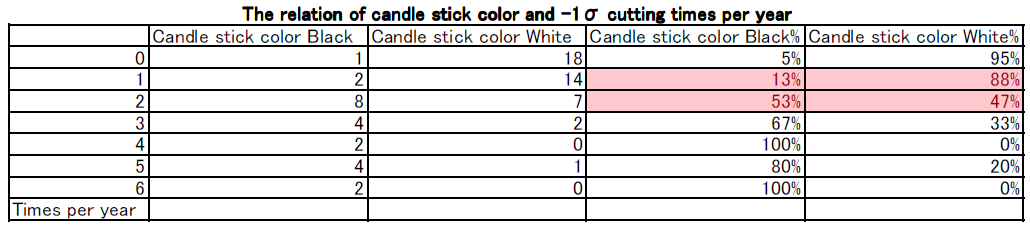
table


2015年は8月に1度目の-1σを超える下落が発生しています。

9月のopenは18763.72円であり、もしcloseが17844.3円を超えた下落となれば、2度目の下落となります。

統計的には、17844.3円割れになるようだと、本年の陽線発生は五分五分以下の可能性しかなくなります。

In 2015, this market has already took -1 sigma exceed falling once.

The opening price of September was 18763.72yen and if the market price will cut 17844.3yen at the end of this month, this will be twice.

Statically, if this month’s close price will cut 17844.3yen, it will be difficult to taking white candle stick in this year.


相場分析のリクエストがありましたら“Contact Us”からお知らせください。ご要望にお応えできるように努力いたします。

このブログはあくまでも個人的な見解であり、投資判断は各自でお願い致します。当ブログは一切の投資損益に対する責任を負いません。

ホームページに来て下さってありがとうございます。明日もよろしくお願いいたします。

If you have some request to analyze, please write to “Contact Us”.

We do best effort for your request.

These are only personal opinions on this blog, and you need the investment judgment in each one. This blog doesn’t assume the responsibility to all the investment profit and loss.

Thank for watching our contents. My best regards next day.

如果您需要行情分析,请点击“Contact Us”联系我们。我们将尽力满足您的要求。

本博客仅为个人意见,请各自做出投资判断。本博客概不对任何投资盈亏负责。

感谢您访问本博客。欢迎再次使用。


日経平均年足の分析(9)・1950-2014年調査・統計的には年初来高値をつける可能性はなお残る/NIKKEI 225 annual No.9; Surveying from 1950 to 2014; statistically, there is some possibility for new high. /日经225。年K的分析。第9部。调查从1950年到2014年。据统计有一些可能的新高价。

2015/09/08

日経平均年足の分析(9)・1950-2014年調査・統計的には年初来高値をつける可能性はなお残る

NIKKEI 225 annual No.9; Surveying from 1950 to 2014; statistically, there is some possibility for new high.

日经225。年K的分析。第9部。调查从1950年到2014年。据统计有一些可能的新高价。


本日は日経平均月足についてです。

2015年は1月に年初来安値、6月に年初来高値を、今のところつけていますが、今後、年初来高値、年初来安値のどちらが示現しやすいのか調査しました。

1950年から2014年の65年間を調査対象としています。

Today’s analyze is NIKKEI 225 Monthly.

This year, the year low was taken in January and the year high was taken in June right now and we surveyed which one will appear after September.

We survey from 1950 to 2014.


はじめに調査したのは、1月から8月までの間の年初来高値、安値を超える可能性があるかどうかです。

8月までの年初来高値を超えていき、年初来安値を下回らなかった場合が43%あり、8月までの年初来高値を超えられず、年初来安値を下回った場合の31%となりました。

傾向としては、新高値への芽の方にエッジがありそうです。

We surveyed the price will take new high or low after September.

The price exceeded the highest before August and did not cut the lowest before August was 43% and the price did not exceed the highest before August and cut the lowest before August was 31%

There was a tendency of taking new high after September.

1


また、今年の場合は、1月に年初来安値、6月に年初来高値をつけています。

8月までの間に年初来安値が先、年初来高値が後につけた場合に限ってみていくとよりハッキリした傾向が見られます。

8月までの年初来高値を超えていき、年初来安値を下回らなかった場合が59%あり、8月までの年初来高値を超えられず、年初来安値を下回った場合の15%となりました。

傾向としては上値の芽がかなり残っているとみて良さそうです。

And in this year, the year low was January and the year high was June.

We limited the year high was first and the year low was later before August and this tendency was more obvious.

The price exceeded the highest before August and did not cut the lowest before August was 59% and the price did not exceed the highest before August and cut the lowest before August was 15%.

We should notice there are some tendency of taking new high.

2


相場分析のリクエストがありましたら“Contact Us”からお知らせください。ご要望にお応えできるように努力いたします。

このブログはあくまでも個人的な見解であり、投資判断は各自でお願い致します。当ブログは一切の投資損益に対する責任を負いません。

ホームページに来て下さってありがとうございます。明日もよろしくお願いいたします。

If you have some request to analyze, please write to “Contact Us”.

We do best effort for your request.

These are only personal opinions on this blog, and you need the investment judgment in each one. This blog doesn’t assume the responsibility to all the investment profit and loss.

Thank for watching our contents. My best regards next day.

如果您需要行情分析,请点击“Contact Us”联系我们。我们将尽力满足您的要求。

本博客仅为个人意见,请各自做出投资判断。本博客概不对任何投资盈亏负责。

感谢您访问本博客。欢迎再次使用。


© 2026 Retar
