
日経225 : 日经225 : NIKKEI 225

日経平均年足の分析(8)・年末に年初来高値となるなら5,6,7月に押しとなったことが多い/NIKKEI 225 annual No.8; if the year high will come at the end of the year, May, June or July will become a dip. /日经225。年K的分析。第8部。如果年高会在今年年底,就五月、六月和七月将成为倾角。

2015/05/11

日経平均年足の分析(8)・年末に年初来高値となるなら5,6,7月に押しとなったことが多い

NIKKEI 225 annual No.8; if the year high will come at the end of the year, May, June or July will become a dip.

日经225。年K的分析。第8部。如果年高会在今年年底,就五月、六月和七月将成为倾角。


本日は日経平均月足についてです。

Today’s analyze is NIKKEI 225 Monthly.


2015/05/08のレポートでは、以下のように報告しています。

We reported under these in 2015/05/08.

1950年から2014年(65年あります)の1月から4月までの期間に注目して、年内に年初来高値や年初来安値が示現するのかを調査しました。

この65年の期間中に1月に年初来安値、4月に年初来高値をつけたのは25年/65年=38%ありました。約4割近くで発生しているパターンです。

From 1950 to 2014 (In 65 years), notify from January to April, we survey what month did year high or low appear.

And we can know the year high was in April and the year low was in January pattern was 25years/65years=38%.


以上の事実は確定している事実であり、今後、示現は4パターンあることを紹介しました。(カッコ内は25年間で発生したパーセンテージ)

This fact is fixed in 2015’s truth and we introduce there will occur 4 patterns in future. (In the parenthesis, the percentage in 25 years)

1. 5月以降に年初来高値をつけて、年初来安値は1月/Year high will come after May and year low was January (72%)

2. 5月以降に年初来安値をつけて、年初来高値は4月/Year low will come after May and year high was April (12%)

3. 5月以降に年初来高値も安値も示現しない/Year high and low will not come after May (0%)

4. 5月以降に年初来高値も安値も示現する/Year high and low will come after May (16%)

圧倒的に1番目のパターンの発生が多く、今後年初来安値(16,592.57円)を割り込まずに反転しています。

この圧倒的に多く発生するパターンの中で、安値を示現する月を調査しました。

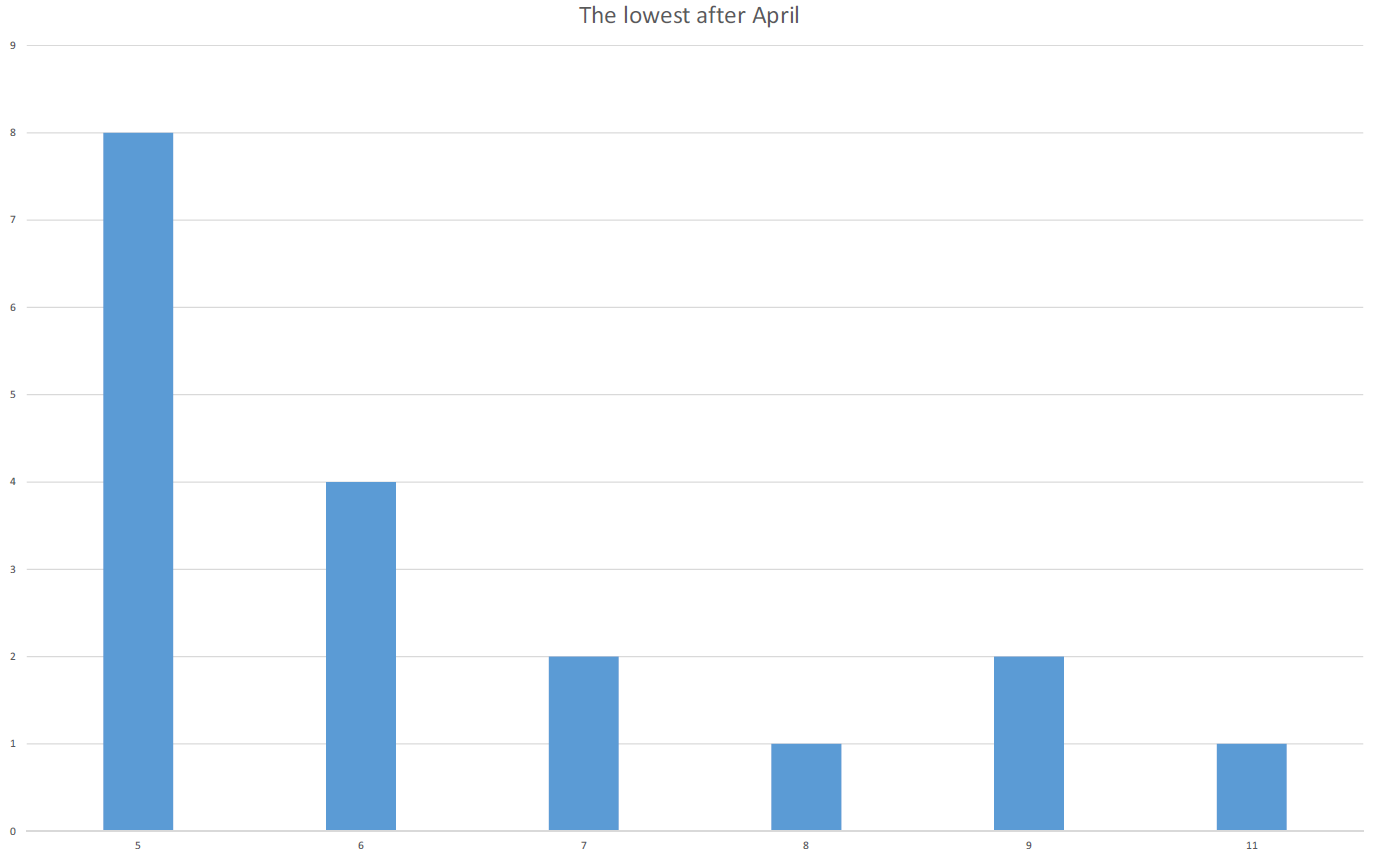
1番目に属するパターンは18年ありますが、このうち5月安値は8回、6月安値は4回、7月安値は2回あり、合計14回(14/25=56%、14/18=78%)あります。

この事実をもとに相場を想定すると、今後は盛夏までに安値をつけて(16,592.57円以上)、その後盛り返して、年末に高値をつける相場が一番くる相場がメインシナリオです。

しかし、過去44%の相場はこれ以外の軌跡を描いたことも、考慮したいと思います。

There were 18 occasions in No.1 pattern.

And we survey when it took the lowest and can know in May(8 times), June(4 times) and July(2 times); there were 14 times (14/25=56%, 14/18=78%) taking the lowest.

Applying this fact, our main scenario is the market price will take the lowest before mid-summer (over 16,592.57yen) and take new high at the end of this year.

But 44% occasions cannot apply this pattern.
chart


相場分析のリクエストがありましたら“Contact Us”からお知らせください。ご要望にお応えできるように努力いたします。

このブログはあくまでも個人的な見解であり、投資判断は各自でお願い致します。当ブログは一切の投資損益に対する責任を負いません。

ホームページに来て下さってありがとうございます。明日もよろしくお願いいたします。

If you have some request to analyze, please write to “Contact Us”.

We do best effort for your request.

These are only personal opinions on this blog, and you need the investment judgment in each one. This blog doesn’t assume the responsibility to all the investment profit and loss.

Thank for watching our contents. My best regards next day.

如果您需要行情分析,请点击“Contact Us”联系我们。我们将尽力满足您的要求。

本博客仅为个人意见,请各自做出投资判断。本博客概不对任何投资盈亏负责。

感谢您访问本博客。欢迎再次使用。

日経平均週足・羽黒2号線・包みの下抜けを評価。2007年のピークを思い出そう。/NIKKEI 225 weekly is “HAGURO” No. 2 formation; we should attach importance to cutting “INSIDE DAY”; remind 2007’s peak around. /日经225。羽黑2号线。我们要重视”内包日线”。 我们回顾一下2007年的高峰期。

2015/05/09

日経平均週足・羽黒2号線・包みの下抜けを評価。2007年のピークを思い出そう。

NIKKEI 225 weekly is “HAGURO” No. 2 formation; we should attach importance to cutting “INSIDE DAY”; remind 2007’s peak around.

日经225。羽黑2号线。我们要重视”内包日线”。 我们回顾一下2007年的高峰期。


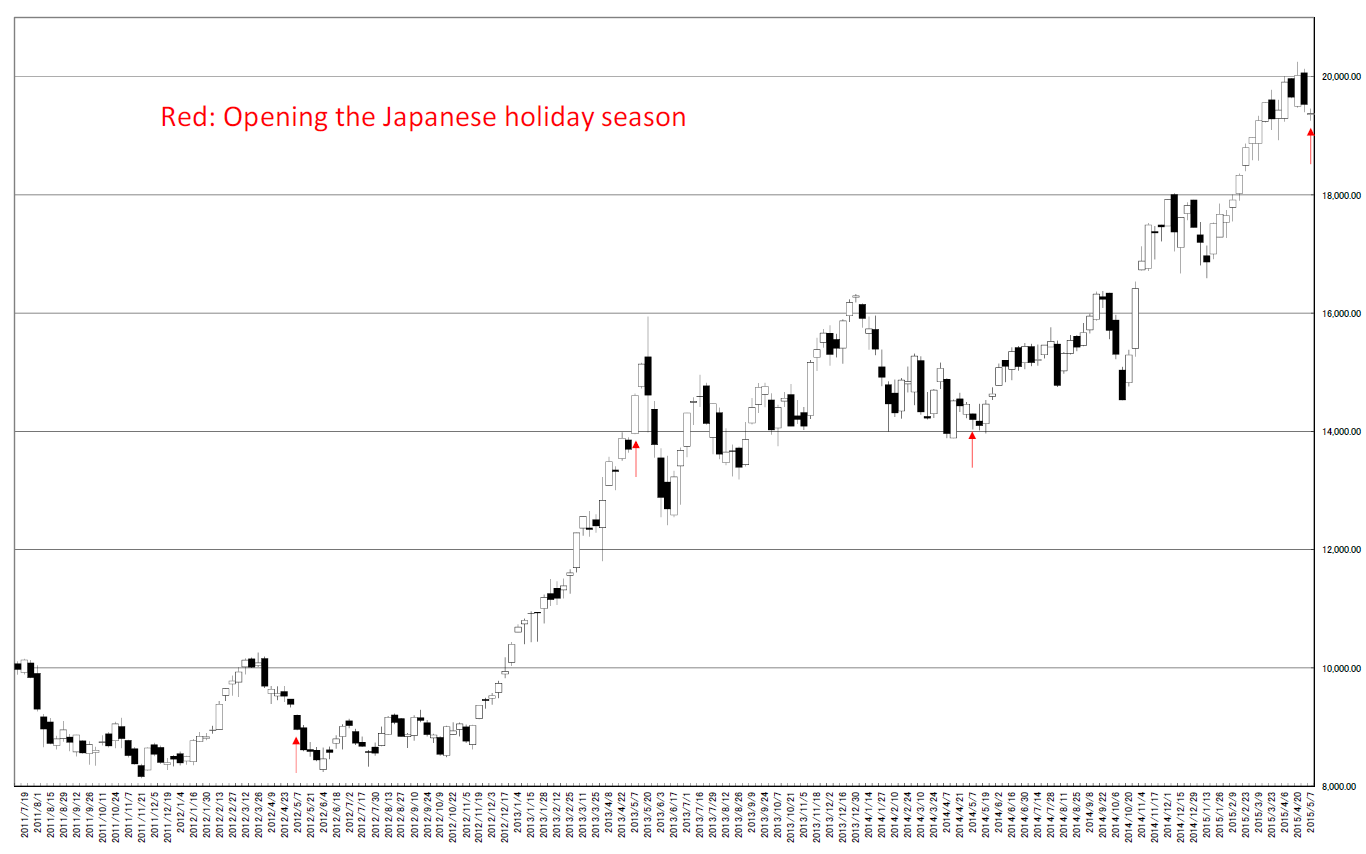
日本は連休が明けました。

Japanese holiday season has ended.


日経225週足線は羽黒2号線となりました。

日経225週足線では200週で羽黒2号線は33回出現しています。

羽黒2号線は判断に迷う線であり、評価は割愛します。

In this week, N225 formed “HAGURO” No. 2 formation.

In past 200 weeks, N225 price formed “HAGURO” No.2 formation was 33 times.

“HAGURO” No.2 often becomes nontypable formation and we omit.


2015/04/27のレポートでは以下のように書いています。

We reported under these in 04/27/2015.

今週のもう一点の注目は、包み。

羽黒2,5,8号線を出した時の包みを集めてみると殆どが上昇していることがわかります。

しかし、同値付近までは必ず戻ってきていることも多く、売り買いを一方向きと決めず柔軟な対応が必要であることもわかります。

The other notable point is “Inside day”.

We gather “HAGURO” No.2, 5 and 8 point and find out the market price became rally.

But market price often wend back; we need to know rally will continue forever and the market price be up and down.


過去の連休明けを調べてみると月末付近に反転していることが多いようです。

包みの実体抜きであっても、ダマシとなる可能性も秘めます。

After Japanese holiday season, the market reverse at the end of the month.

There occurred cutting “INSIDE DAY” but it often became fake.

chart


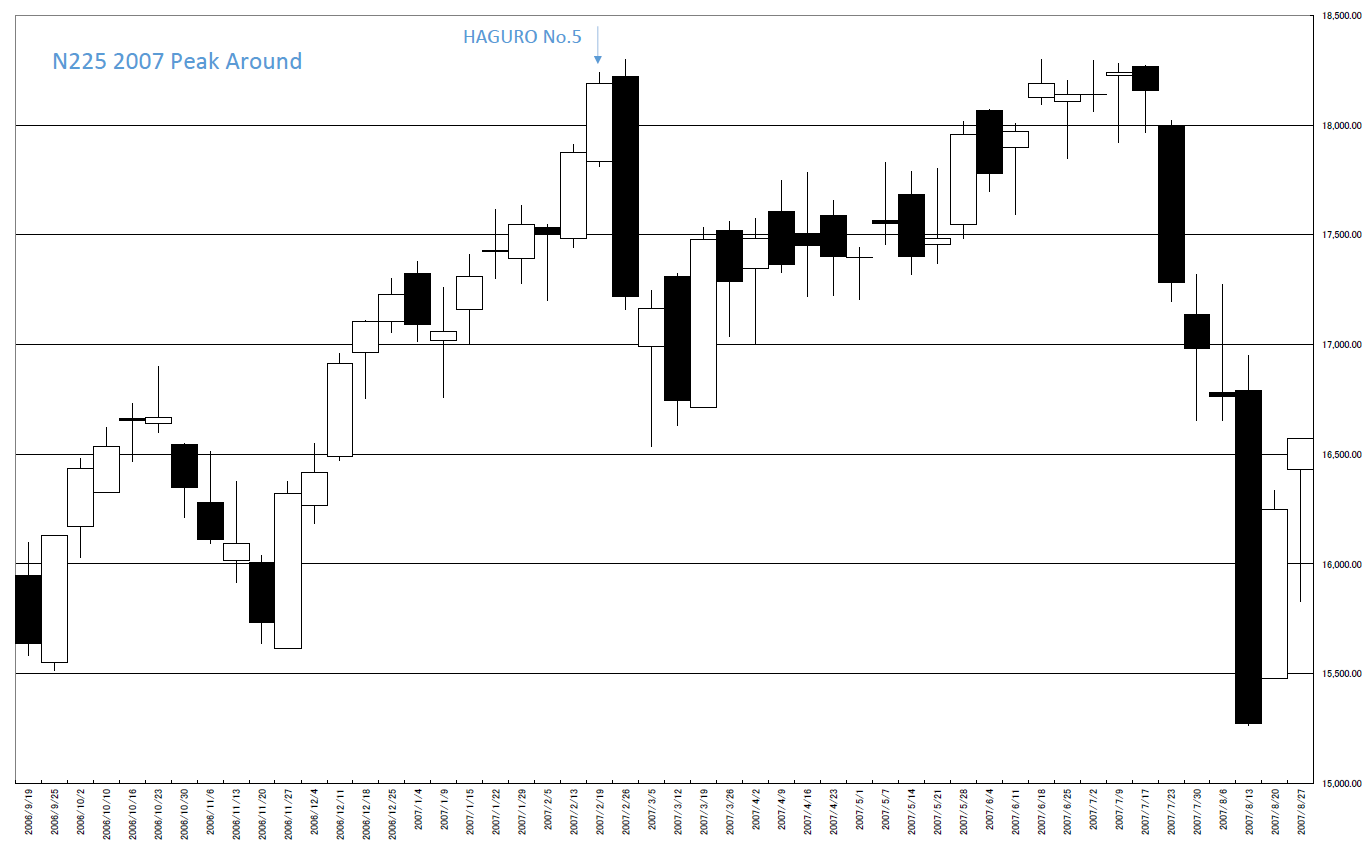
2007年の頂点付近がなんとなく、現在と似ているので紹介します。

天井をつけて、包みの実体抜きの後、新高値をつけられず下落となりました。

We can introduce 2007’s peak around and this is similar to now.

The market price took the peak after cutting the “INSIDE DAY” and could not take new high and became falling.

2007


相場分析のリクエストがありましたら“Contact Us”からお知らせください。ご要望にお応えできるように努力いたします。

このブログはあくまでも個人的な見解であり、投資判断は各自でお願い致します。当ブログは一切の投資損益に対する責任を負いません。

ホームページに来て下さってありがとうございます。明日もよろしくお願いいたします。

If you have some request to analyze, please write to “Contact Us”.

We do best effort for your request.

These are only personal opinions on this blog, and you need the investment judgment in each one. This blog doesn’t assume the responsibility to all the investment profit and loss.

Thank for watching our contents. My best regards next day.

如果您需要行情分析,请点击“Contact Us”联系我们。我们将尽力满足您的要求。

本博客仅为个人意见,请各自做出投资判断。本博客概不对任何投资盈亏负责。

感谢您访问本博客。欢迎再次使用。

© 2026 Retar
