日経225 : 日经225 : NIKKEI 225

日経平均トレンドライン分析・上昇相場の終焉と押しを定義/NIKKEI 225 trend line analysis; The definition of bull trend end and dip. /日经225。趋势线分析。看涨趋势结束和倾角的定义。

2015/03/11

日経平均トレンドライン分析・上昇相場の終焉と押しを定義

NIKKEI 225 trend line analysis; The definition of bull trend end and dip.

日经225。趋势线分析。看涨趋势结束和倾角的定义。


本日は日経平均についてです。

Today’s analyze is NIKKEI 225.


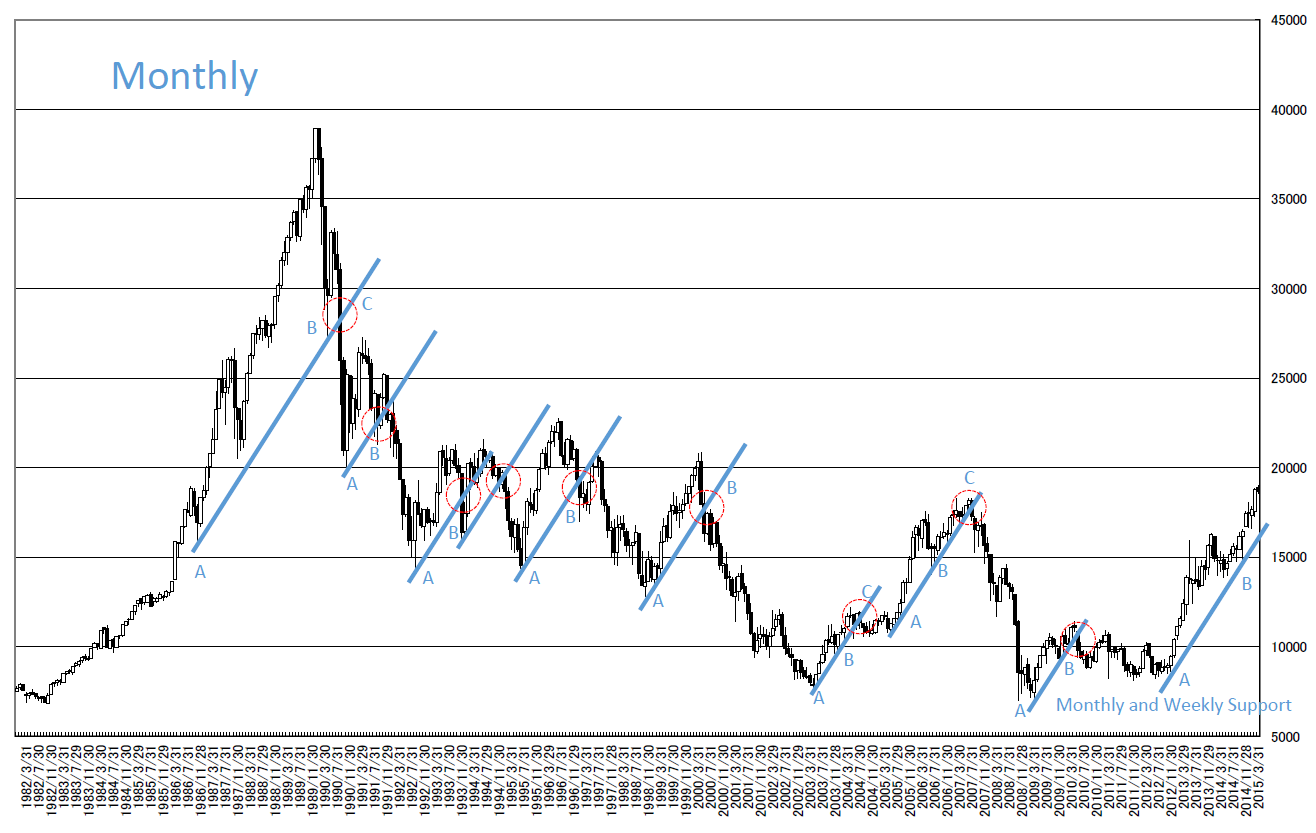
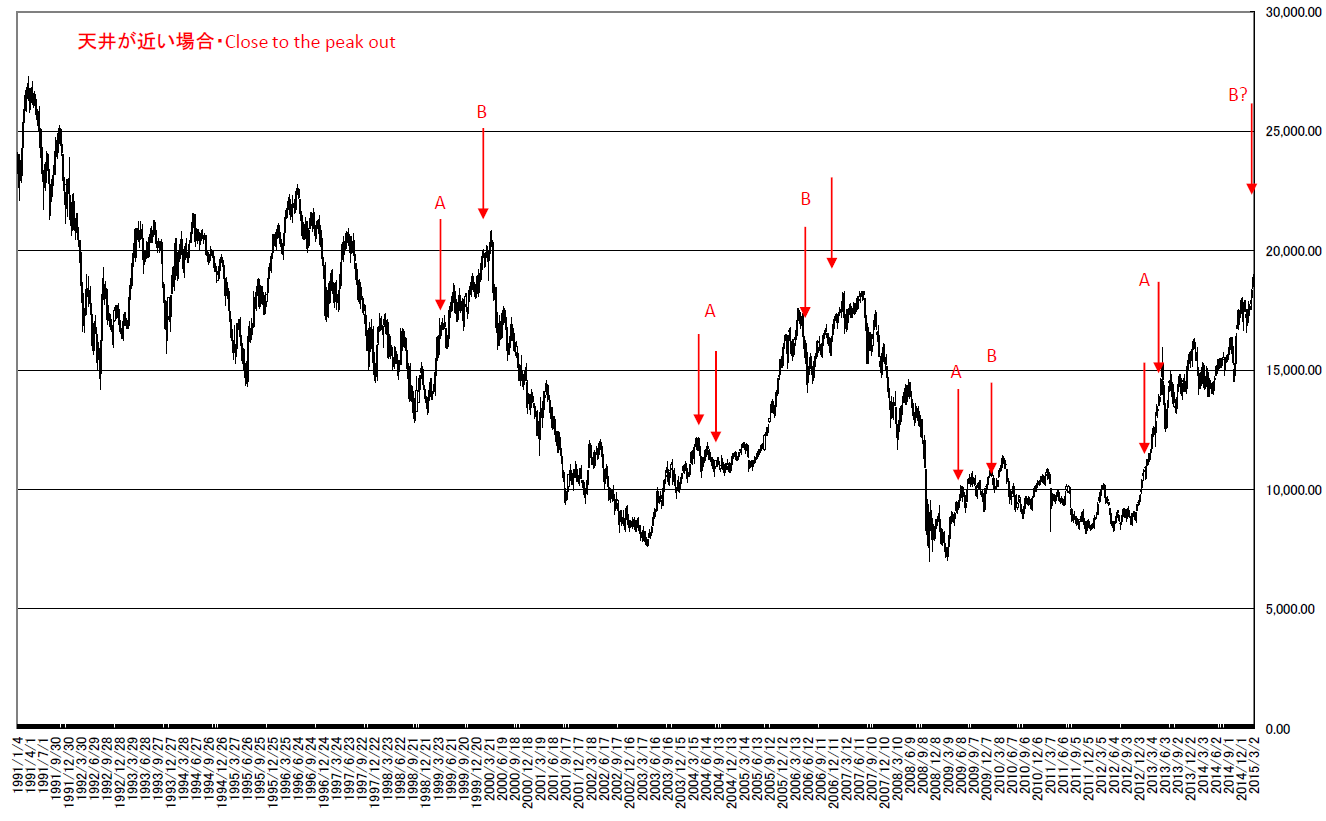
過去400ヶ月では青色のサポートが引けます。

このサポートには特徴があり、上昇してからいきなり切れるか(ABパターン)、上昇した後に一旦サポートされた後に切れるか(ABCパターン)の2パターンです。

今回のパターンは一旦サポートされたパターンとなっているため(ABを形成)、上伸相場の継続が確認できています。

しかし、いつまでも上げ続ける相場というのは無いので何時かはCがやってきます。

In past 400 weeks, we can draw blue support line.

This support has unique character; go upper and cut suddenly (A and B pattern) or go upper and make a dip and cut (A, B and C pattern).

In this case, the market price has make A and B point and we can confirm bull trend.

But there will come C point in future; this will mean bull trend end.
Monthly


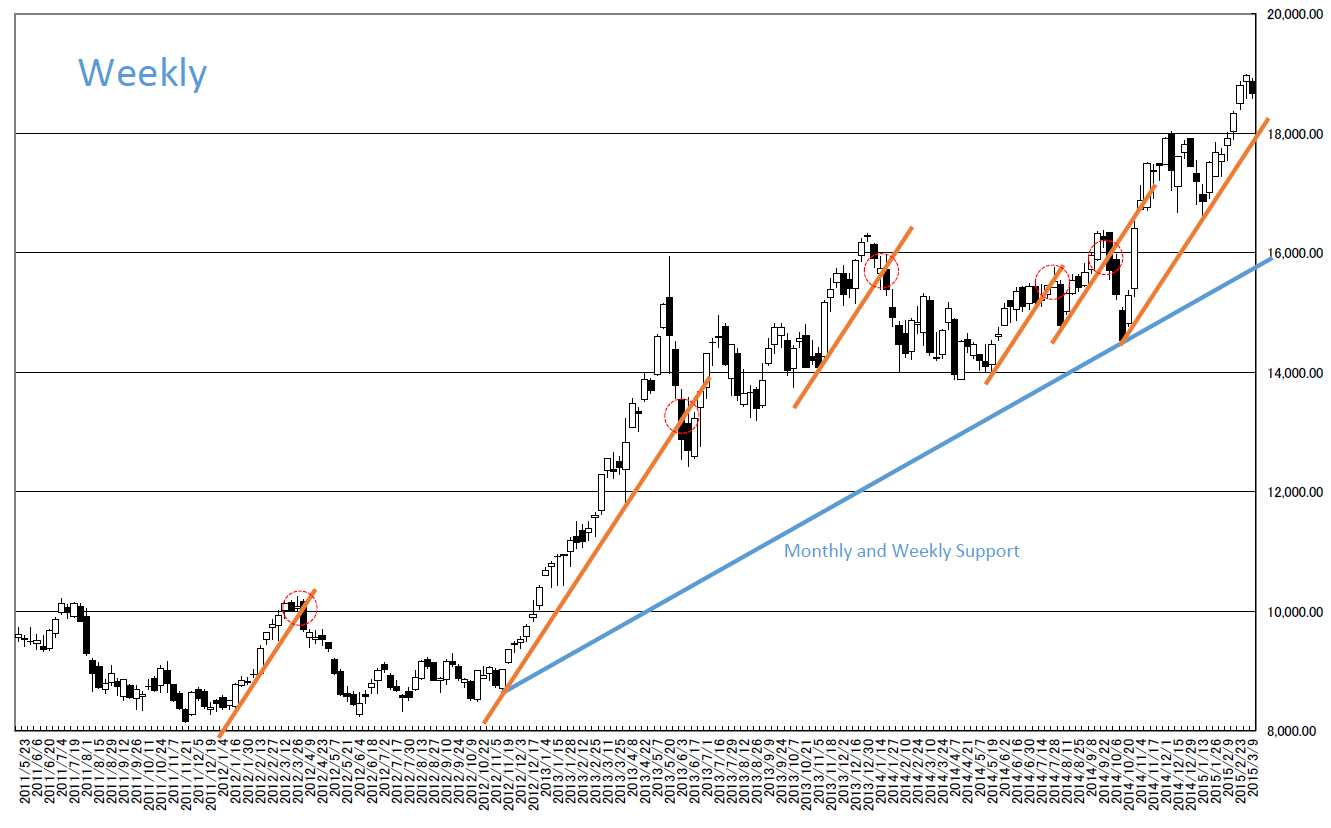
同じ足を週足に引いてみると(青)、現在の相場は大変に堅調です。

青が切れるまではブルトレンドの継続が基本シナリオです。

短期的には(週足)、オレンジを切ると押しが入るようです。

現在は高値圏にあり、しっかりと押しが入り、上げだした地点から買うべきだと思います。

Adding Monthly support on weekly chart, the latest market is pure bull market.

Until cutting blue line, bull trend is going on and this is basic scenario.

But short term meaning (Weekly), cutting orange line will make a dip.

The latest market is too high and we need to wait a dip and start recovering.
Weekly


相場分析のリクエストがありましたら“Contact Us”からお知らせください。ご要望にお応えできるように努力いたします。

このブログはあくまでも個人的な見解であり、投資判断は各自でお願い致します。当ブログは一切の投資損益に対する責任を負いません。

ホームページに来て下さってありがとうございます。明日もよろしくお願いいたします。

If you have some request to analyze, please write to “Contact Us”.

We do best effort for your request.

These are only personal opinions on this blog, and you need the investment judgment in each one. This blog doesn’t assume the responsibility to all the investment profit and loss.

Thank for watching our contents. My best regards next day.

如果您需要行情分析,请点击“Contact Us”联系我们。我们将尽力满足您的要求。

本博客仅为个人意见,请各自做出投资判断。本博客概不对任何投资盈亏负责。

感谢您访问本博客。欢迎再次使用。

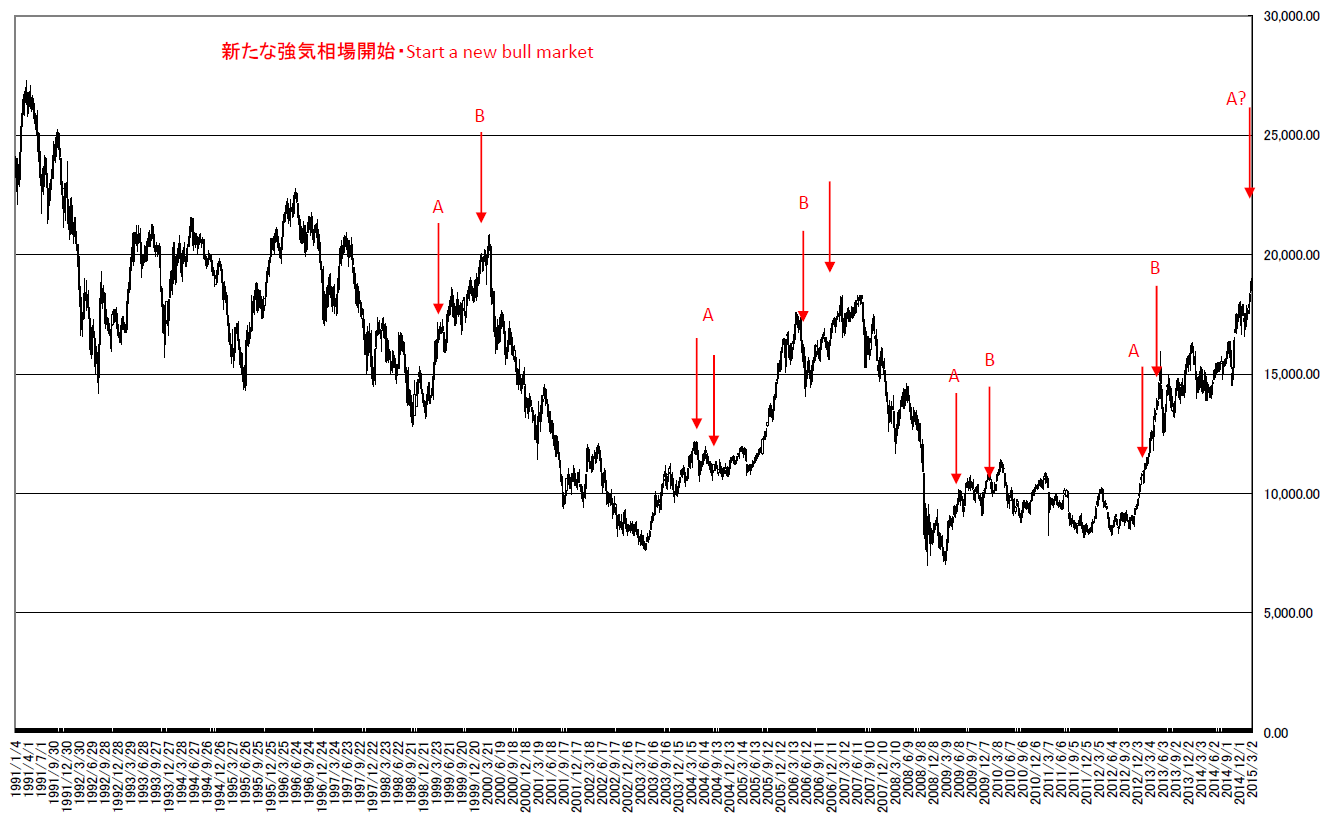
日経平均、TOPIX週足・羽黒7号線・なお上値余地。天井は近いか?新たな上げ相場か?/NIKKEI 225 and TOPIX Weekly; “HAGURO” No. 7 formation; there are some room for rally but the peak out may be sooner or new rally market may start. /日经225和东证综合指数。羽黑7号线。还有一些余地,但反弹的高峰出可能是迟早新的反弹行情可能开始。

2015/03/07

日経平均、TOPIX週足・羽黒7号線・なお上値余地。天井は近いか?新たな上げ相場か?

NIKKEI 225 and TOPIX Weekly; “HAGURO” No. 7 formation; there are some room for rally but the peak out may be sooner or new rally market may start.

日经225和东证综合指数。羽黑7号线。还有一些余地,但反弹的高峰出可能是迟早新的反弹行情可能开始。


週足線では先週に引き続き羽黒7号線となりました。

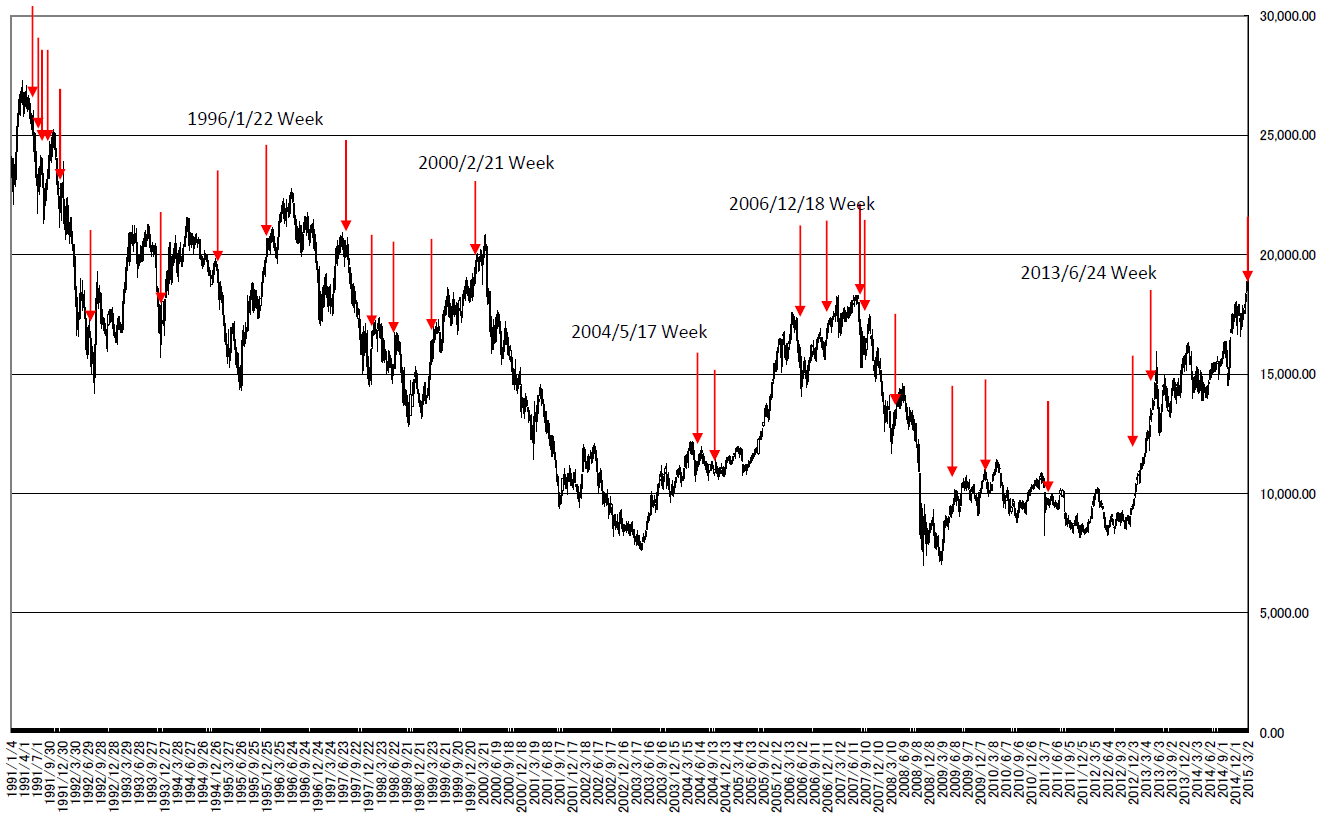
1262週で27回出現しています。

わずか全体の2%(27/1262)しかない、珍しい線です。

In this week, the market price formed “HAGURO” No.7 formation following last week.

In past 1262 weeks, it appeared 27 times.

This formation is only 2% (27/1262); very rare.


過去には大きな上昇相場の上伸開始のシグナルか、天井示唆のシグナルになっていました。

In past market, this formation implies a start of bullish market or close to the peak out.

chart1


羽黒7号線の面白い特性は、上げ相場で2回出ると、天井付近になると言う点に面白さがあります。

今回の場合は、上げ相場開始のシグナルと解釈できる場合と、天井が近い場合としても見ることができます。

いずれにせよ、なお相場に上伸余地があることを示唆しています。

This formation unique character was appearing two times meant close to the peak out.

We can judge now is the start of new rally market or close to the peak out.

In any way, there are more room for rally.

chart2

chart3


相場分析のリクエストがありましたら“Contact Us”からお知らせください。ご要望にお応えできるように努力いたします。

このブログはあくまでも個人的な見解であり、投資判断は各自でお願い致します。当ブログは一切の投資損益に対する責任を負いません。

ホームページに来て下さってありがとうございます。明日もよろしくお願いいたします。

If you have some request to analyze, please write to “Contact Us”.

We do best effort for your request.

These are only personal opinions on this blog, and you need the investment judgment in each one. This blog doesn’t assume the responsibility to all the investment profit and loss.

Thank for watching our contents. My best regards next day.

如果您需要行情分析,请点击“Contact Us”联系我们。我们将尽力满足您的要求。

本博客仅为个人意见,请各自做出投资判断。本博客概不对任何投资盈亏负责。

感谢您访问本博客。欢迎再次使用。

© 2026 Retar