日経225 : 日经225 : NIKKEI 225

日経平均日足・サポート15173.195円に注目/NIKKEI 225 Daily; 15173.195yen will be next support. /日经225。15173.195日元是下一个支持。

2014/01/14

日経平均日足・サポート15173.195円に注目

NIKKEI 225 Daily; 15173.195yen will be next support.

日经225。15173.195日元是下一个支持。


本日は日経平均日足についてです。

Today’s analyze is NIKKEI 225 daily.

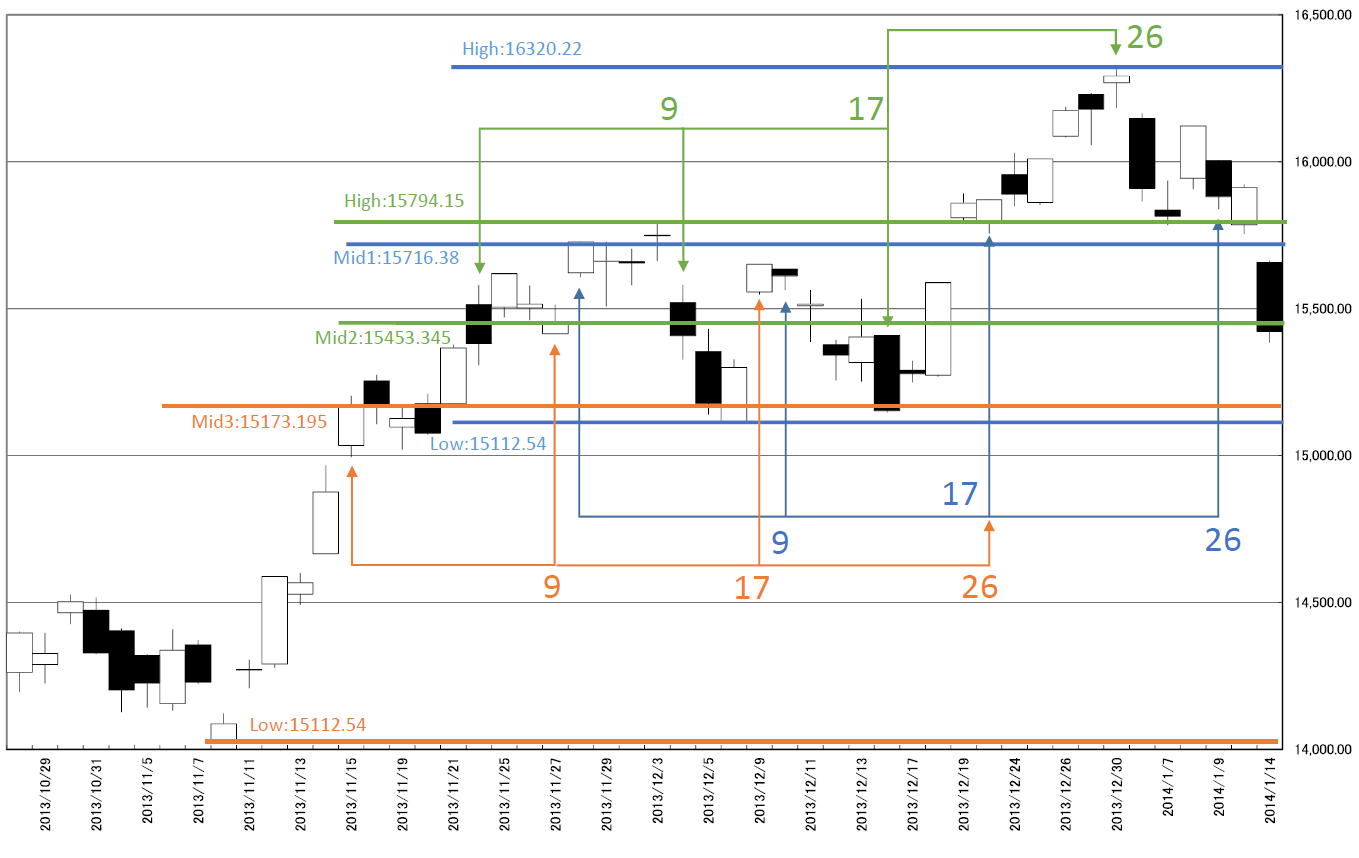
Mid1(15716.38円)、Mid2(15453.345円)を割り込みました。

次のサポートはMid3(15173.195円)です。

もう一点の注目は窓を貫くMid1(15716.38円)です。

「押し、戻りは空まで実現するを酒田線の骨子とす」(酒田五法は風林火山・P73)

この地点にMid1(15716.38円)が位置しており、戻り売りを考えることになりそうです。

The market price cut Mid1(15716.38yen) and Mid2(15453.345yen).

The next support is Mid3(15173.195円).

The other notable point is Mid1(15716.38yen) going through “The price gap”.

“Dip will be the price gap and this is SAKATA method creed.” (The text book “SAKATA GOHOU HA FURINKAZAN” P.73)

Mid1(15716.38yen) is being at this point and this price will be good selling point.
N225


相場分析のリクエストがありましたら“Contact Us”からお知らせください。ご要望にお応えできるように努力いたします。

このブログはあくまでも個人的な見解であり、投資判断は各自でお願い致します。当ブログは一切の投資損益に対する責任を負いません。

ホームページに来て下さってありがとうございます。明日もよろしくお願いいたします。

If you have some request to analyze, please write to “Contact Us”.

We do best effort for your request.

These are only personal opinions on this blog, and you need the investment judgment in each one. This blog doesn’t assume the responsibility to all the investment profit and loss.

Thank for watching our contents. My best regards next day.

如果您需要行情分析,请点击“Contact Us”联系我们。我们将尽力满足您的要求。

本博客仅为个人意见,请各自做出投资判断。本博客概不对任何投资盈亏负责。

感谢您访问本博客。欢迎再次使用。

日経平均週足・羽黒12(13)号線・弱気転換かつ不吉/ NIKKEI 225 Weekly; “HAGURO” No. 12(13) formation; Bearish and Baleful. /日经225。“羽黑” 12(13)号。熊市和险恶。

2014/01/11

日経平均週足・羽黒12(13)号線・弱気転換かつ不吉

NIKKEI 225 Weekly; “HAGURO” No. 12(13) formation; Bearish and Baleful.

日经225。“羽黑” 12(13)号。熊市和险恶。


本日は日経平均週足についてです。

結論と言うよりも感想ですが、いきなり「これかい」です。

Today’s analyze is NIKKEI 225 weekly.

This is only comment rather than analyzing conclusion; this is an amazing candle stick.

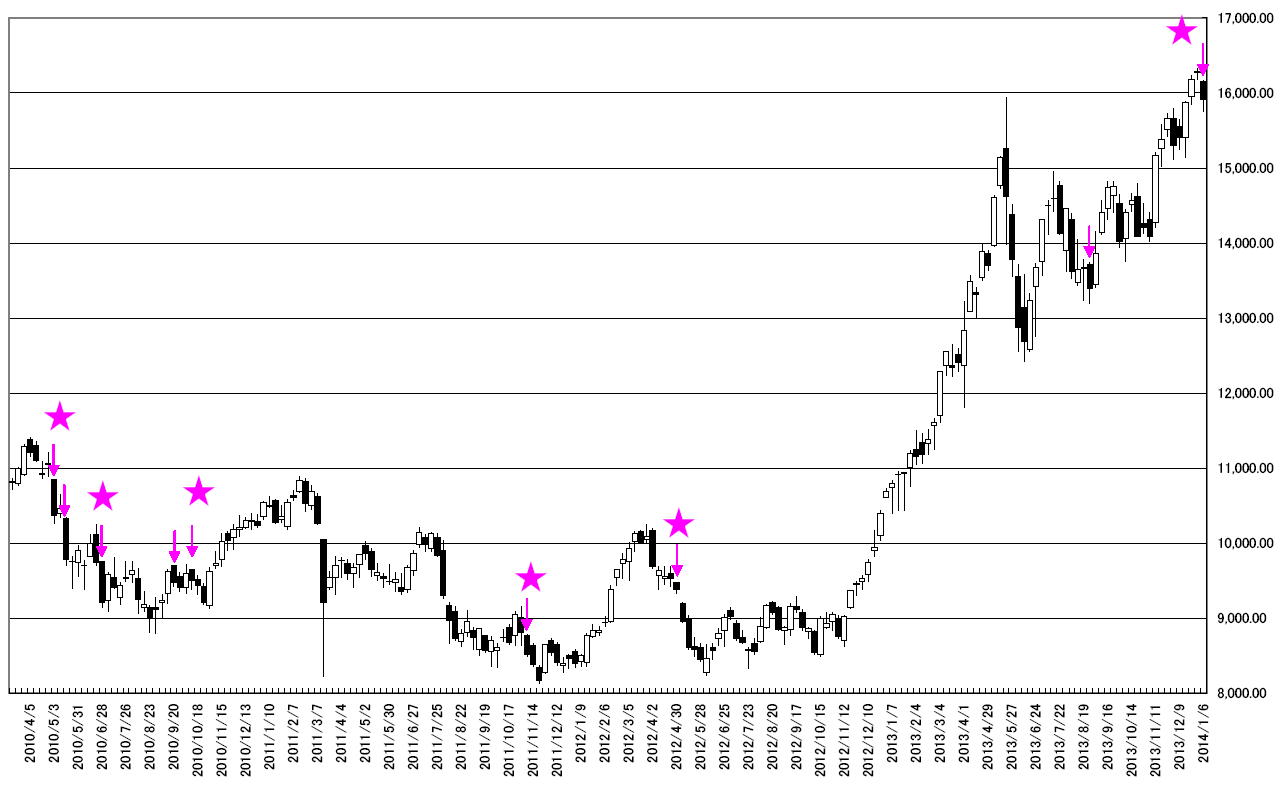
週足線では羽黒12(13)号線となりました。

200週で9回出現しています。

珍しい足ですが、それだけでは片付けられない重要な肝です。

2011年に1回、2012年に1回、2013年に1回には、それぞれ1回ずつしか出ていません。

つまりここ3年のデータでは、この足の意味は理解できず、もう少し過去まで振り返る必要があります。

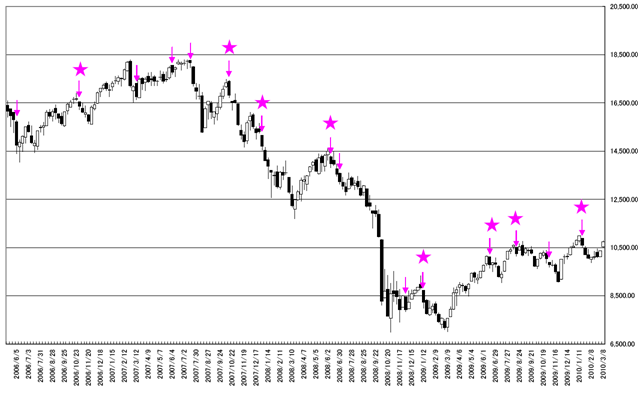
この足は、金融危機のときに、よく出ていたと理解できます。

この足の特徴をみていくと、高値後に、この足を出すとほぼ間違いなく下落しているようです。(星)

先週は星のような足を出した後だったので、幸先の悪いスタートです。

In this week, the market price formed “HAGURO” No. 12(13) formation.

In past 200 weeks, it appeared 9 times.

This formation is very interesting and we need to notice this formation.

In 2011, 2012 and 2013, this formation appeared only once of each year.

The meaning of this candle stick cannot be understood from these three years; it is necessary to look back more data.

We can know this formation often appeared when it was financial crisis.

This formation unique character is the falling signal after the peak. (Star points)

1

2


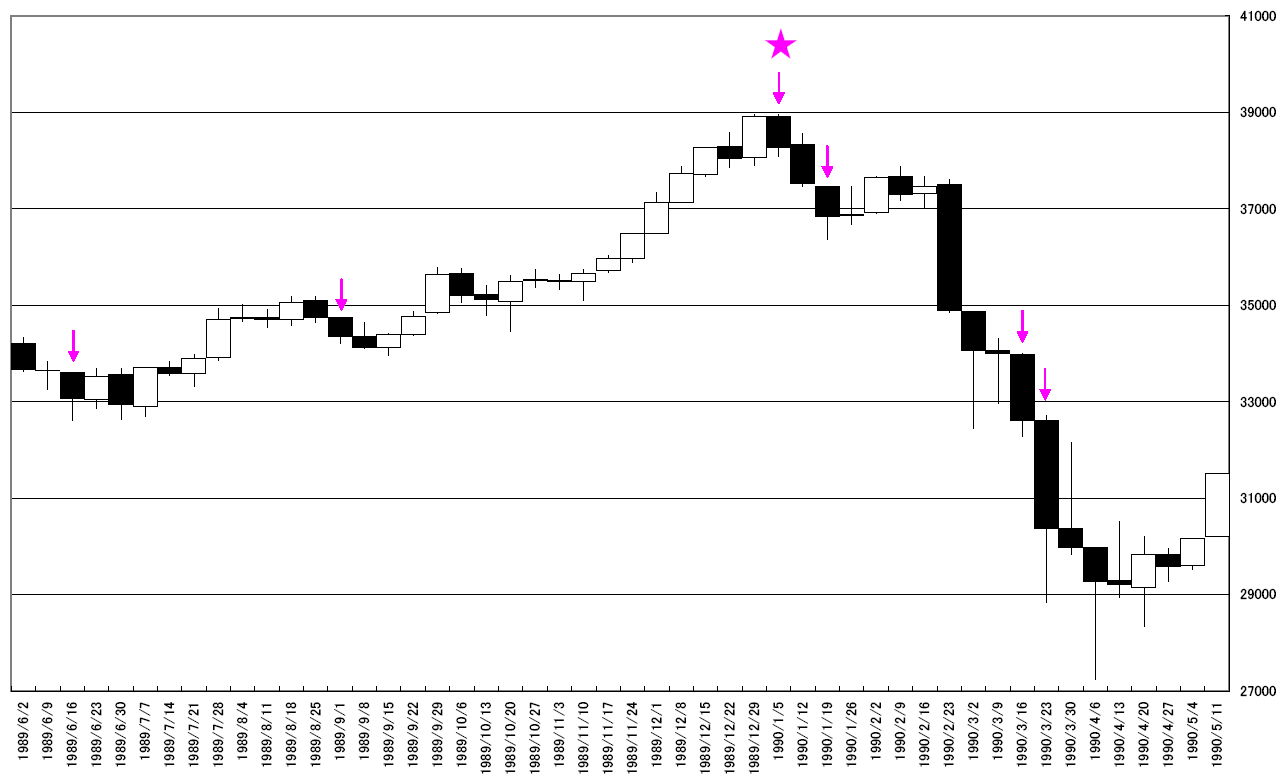
この足の真骨頂は1990年の年初です。

バブル崩壊もこの足が基点だったことをお伝えしたいと思います。

This formation was the best baleful formation at the beginning of 1990.

Japanese bubble breaking was started from this formation.

1990


相場分析のリクエストがありましたら“Contact Us”からお知らせください。ご要望にお応えできるように努力いたします。

このブログはあくまでも個人的な見解であり、投資判断は各自でお願い致します。当ブログは一切の投資損益に対する責任を負いません。

ホームページに来て下さってありがとうございます。明日もよろしくお願いいたします。

If you have some request to analyze, please write to “Contact Us”.

We do best effort for your request.

These are only personal opinions on this blog, and you need the investment judgment in each one. This blog doesn’t assume the responsibility to all the investment profit and loss.

Thank for watching our contents. My best regards next day.

如果您需要行情分析,请点击“Contact Us”联系我们。我们将尽力满足您的要求。

本博客仅为个人意见,请各自做出投资判断。本博客概不对任何投资盈亏负责。

感谢您访问本博客。欢迎再次使用。

© 2026 Retar