日経225 : 日经225 : NIKKEI 225

日経平均月足・1970年台初頭の相場と類似/NIKKEI 225 Monthly; this market is similar to the beginning of the early 1970s. /日经225指数。这个市场是相似的1970年代初期的。

2013/10/18

日経平均月足・1970年台初頭の相場と類似

NIKKEI 225 Monthly; this market is similar to the beginning of the early 1970s.

日经225指数。这个市场是相似的1970年代初期的。


本日は日経平均月足についてです。

「相場が日柄の尻尾を隠す」

本物の日柄というのは、そういうもので面白いぐらいに読めている方がおかしいものです。

Today’s analyze is NIKKEI 225 monthly.

“The market “HIGARA” suddenly hides its tail.”

The true “HIGARA” is the way it is. And too much predicable are irregular occasions.

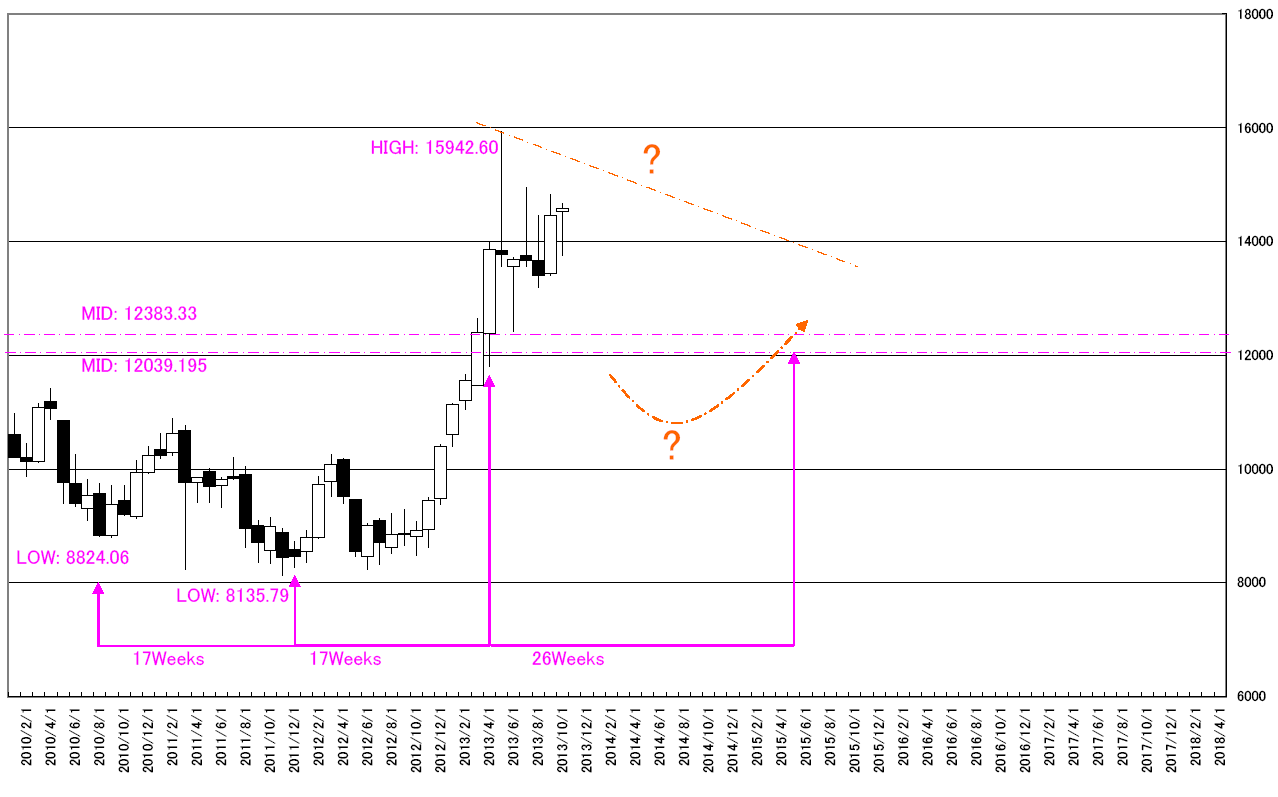
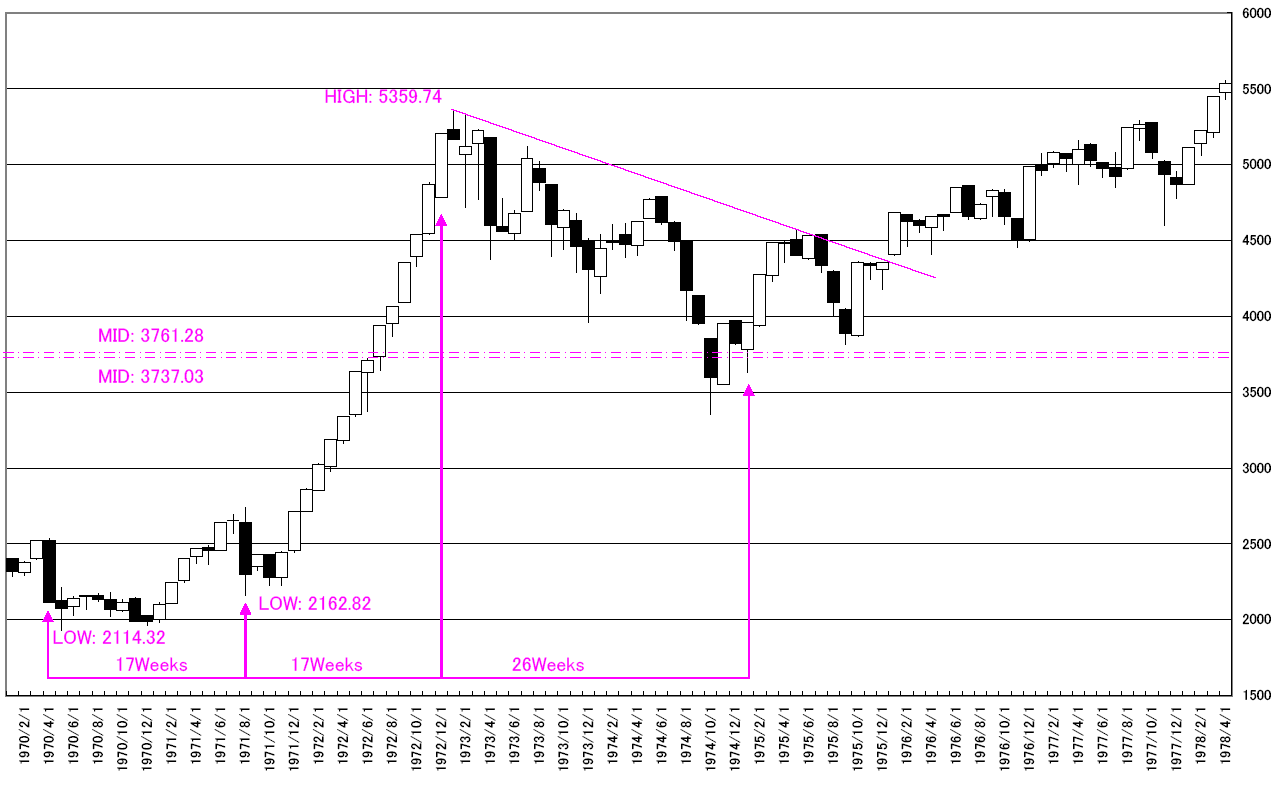
1970年初頭の相場と現在の相場の類似性です。

2013/05の高値をつけるまでの日柄とよく似ています。

1970年初頭の相場では1970/05に底(1929.64円)をつけて、1973/01に天井(5359.74円)をつけています。

その後半値試しをして、駆け上がっていきました。

現在の相場も「半値試しをするのではないか」と見るのが定石です。

現在の相場の半値試しは12000円前後。

We think the recent market is similar to the early 1970s market.

The recent “HIGARA” jumping is similar to the past market.

In early 1970s market, the market price took the bottom at 05/1970 (1929.64yen) and took the peak at 01/1973 (5359.74yen).

After that, the market price challenged the half price and jumped.

And it is natural that the recent market price will challenge the half price.

The half price is 12000yen around.
1970

2013


相場分析のリクエストがありましたら“Contact Us”からお知らせください。ご要望にお応えできるように努力いたします。

このブログはあくまでも個人的な見解であり、投資判断は各自でお願い致します。当ブログは一切の投資損益に対する責任を負いません。

ホームページに来て下さってありがとうございます。明日もよろしくお願いいたします。

If you have some request to analyze, please write to “Contact Us”.

We do best effort for your request.

These are only personal opinions on this blog, and you need the investment judgment in each one. This blog doesn’t assume the responsibility to all the investment profit and loss.

Thank for watching our contents. My best regards next day.

如果您需要行情分析,请点击“Contact Us”联系我们。我们将尽力满足您的要求。

本博客仅为个人意见,请各自做出投资判断。本博客概不对任何投资盈亏负责。

感谢您访问本博客。欢迎再次使用。

日経平均週足・2013/10/14の週に要注意/NIKKEI 225 Weekly; We need to watch 10/14/2013 week. /日经225指数。我们需要看2013年10月14日。

2013/10/07

日経平均週足・2013/10/14の週に要注意

NIKKEI 225 Weekly; We need to watch 10/14/2013 week.

日经225指数。我们需要看2013年10月14日。


本日は日経平均週足についてです。

Today’s analyze is NIKKEI 225 weekly.

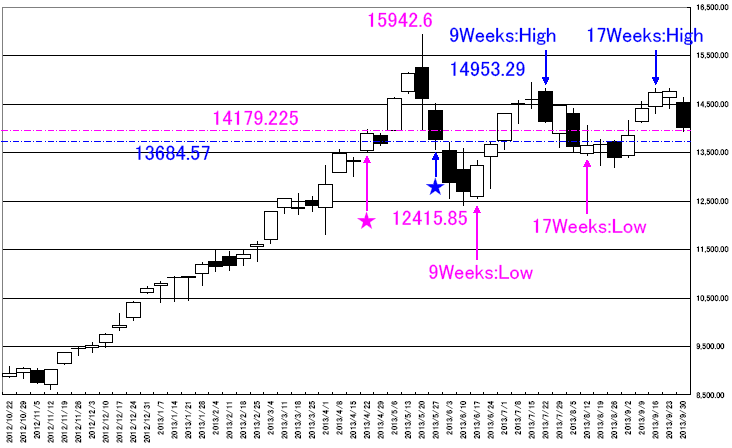
年初来高値と年初来安値に挟まれている現在、離れを見極めるのが定石です。

We need to wait for the launching; the market price is being between the year high and the year low.

半値関係のピンク系列は安値圏。

半値関係の青系列は高値圏。

このように、相場が動いていると考えると「2013/10/14の週は安値圏。2013/11/18の週は高値圏」ではないかとみえます。

この動きから外れるときこそ、離れへの警戒です。

The pink series of the half price points are the low price zone.

The blue series of the half price points are the high price zone.

If the market will go on this relation, 10/14/2013 week will be the low price zone and 11/18/2013 week will be the low price zone.

And if the market price relation will break, this may be the launching.

CHART


相場分析のリクエストがありましたら“Contact Us”からお知らせください。ご要望にお応えできるように努力いたします。

このブログはあくまでも個人的な見解であり、投資判断は各自でお願い致します。当ブログは一切の投資損益に対する責任を負いません。

ホームページに来て下さってありがとうございます。明日もよろしくお願いいたします。

If you have some request to analyze, please write to “Contact Us”.

We do best effort for your request.

These are only personal opinions on this blog, and you need the investment judgment in each one. This blog doesn’t assume the responsibility to all the investment profit and loss.

Thank for watching our contents. My best regards next day.

如果您需要行情分析,请点击“Contact Us”联系我们。我们将尽力满足您的要求。

本博客仅为个人意见,请各自做出投资判断。本博客概不对任何投资盈亏负责。

感谢您访问本博客。欢迎再次使用。


© 2026 Retar