
日経225 : 日经225 : NIKKEI 225

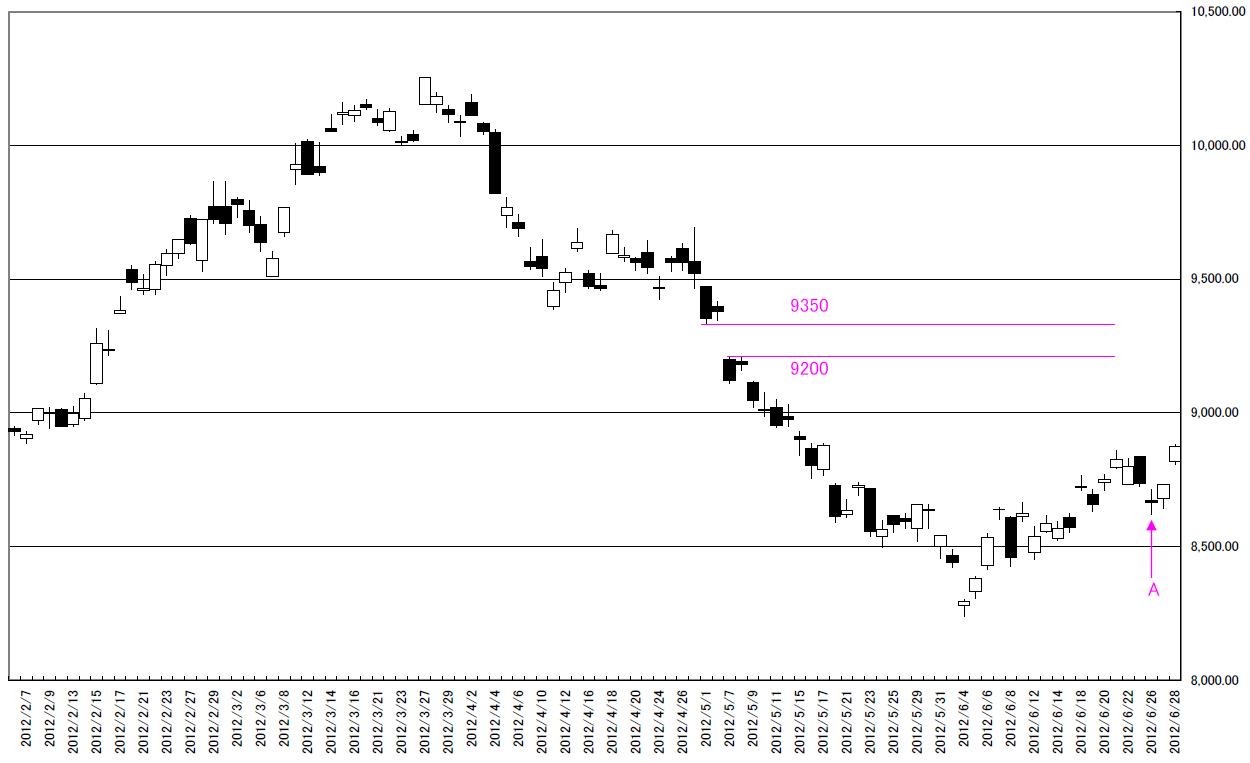
日経平均日足・押し、戻りは空まで実現するを酒田線の骨子とす/NIKKEI 225 Daily. The main point of SAKATA Rules says “The dip reaches the gap and not goes over”.

2012/06/29

本日は日経平均日足についてです。

Today’s analyze is NIKKEI 225 daily.


「押し、戻りは空まで実現するを酒田線の骨子とす」(酒田五法は風林火山 P73)

A点の動きは教科書どおりの動きです。

“The main point of SAKATA Rules says “A dip or recovery only reaches the gap and not goes over”.” (“SAKATAGOHOU HA FUURINKAZAN” P73)

“A” point is the typical type as the textbook says.
CHART


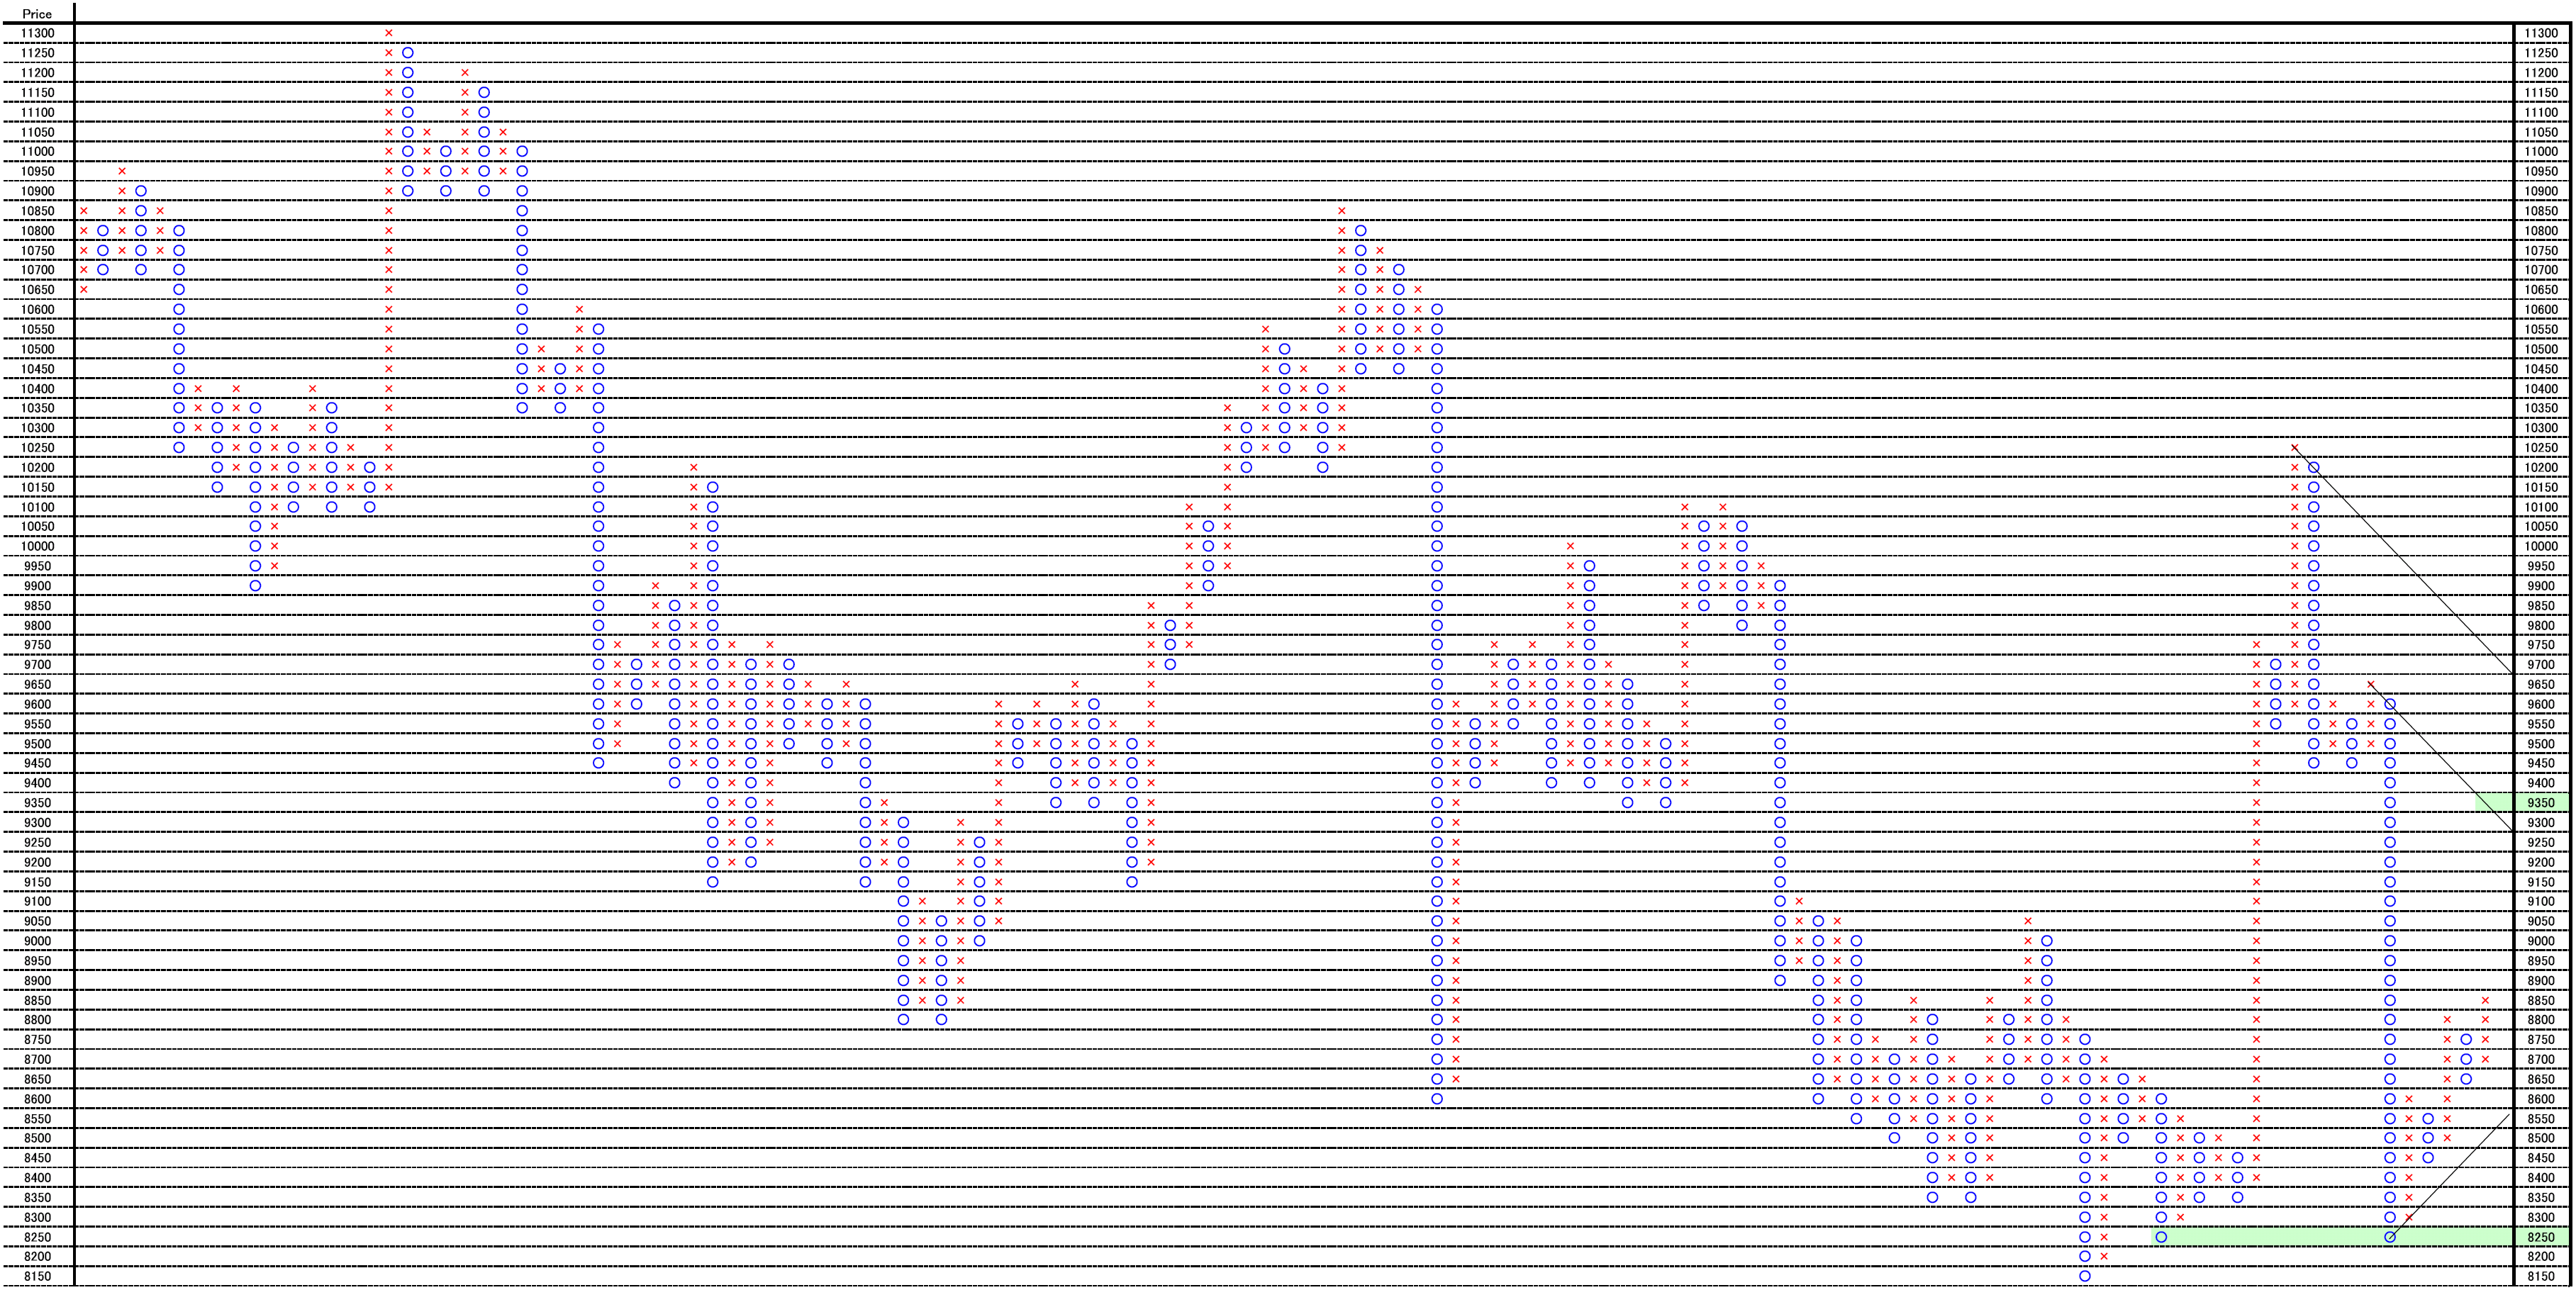
1枠50ポイント、3枠転換の終値ポイントアンドフィギュアです。

直近の45度線のレジスタンスは9350円です。

このまま上昇しても窓上限の値と一致しています。

一度、押しが入り上昇すると45度線のレジスタンスポイントは下がってきます。

いずれにせよ窓は強い抵抗帯として機能すると考えております。

This is 50point change and 3 box reversal close price’s Point and Figure chart.

The nearest 45 degree resistance line is 9350yen.

And if the market price will go upside without a dip, the market price will reach the top upside of the gap.

And if the market price will make a dip, the 45 degree resistance point will go lower side.

We think the upper side gap will work as strong resistance point.
PF


相場分析のリクエストがありましたら“Contact Us”からお知らせください。ご要望にお応えできるように努力いたします。

このブログはあくまでも個人的な見解であり、投資判断は各自でお願い致します。当ブログは一切の投資損益に対する責任を負いません。

ホームページに来て下さってありがとうございます。明日もよろしくお願いいたします。

If you have some request to analyze, please write to “Contact Us”.

We do best effort for your request.

These are only personal opinions on this blog, and you need the investment judgment in each one. This blog doesn’t assume the responsibility to all the investment profit and loss.

Thank for watching our contents. My best regards next day.

日経平均週足・弱気の上げ相場とみています/NIKKEI 225 Weekly. We think now is bear market rally.

2012/06/27

本日は日経平均週足についてです。

Today’s analyze is NIKKEI 225 weekly.

chart


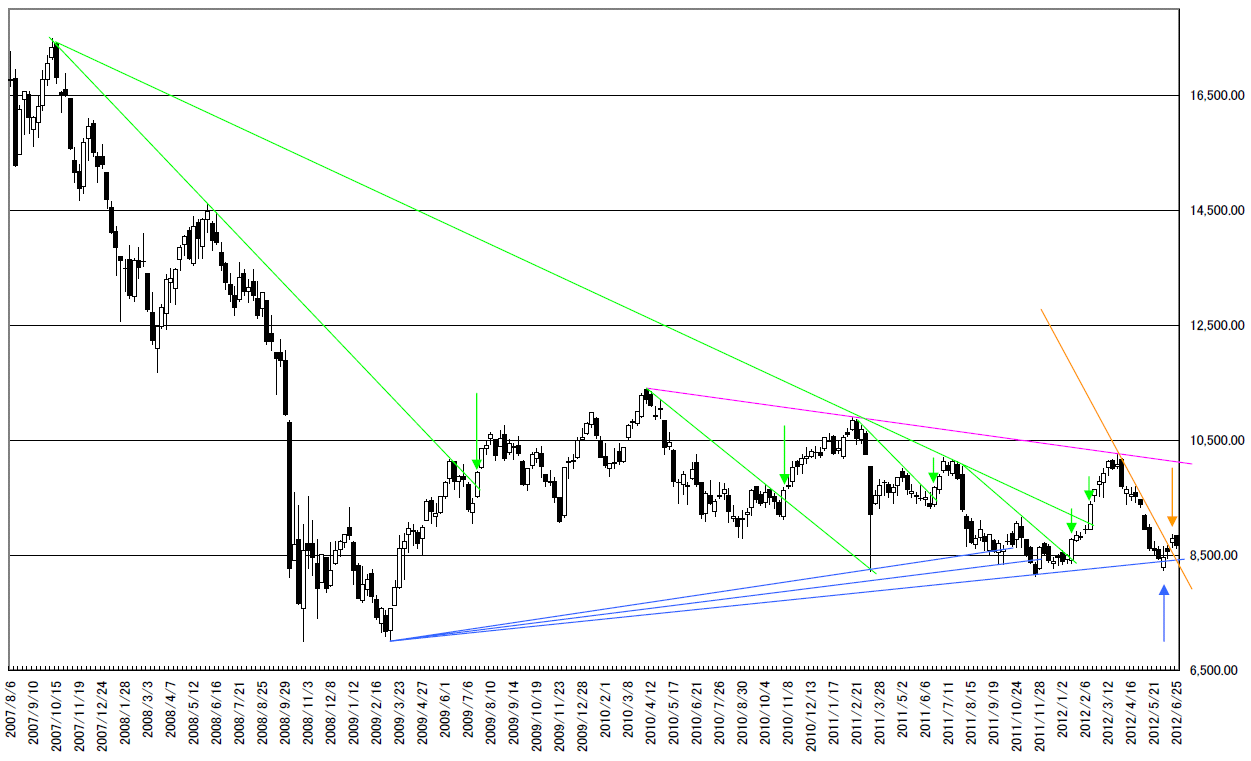
チャートに4種類のトレンドラインを引いてみました。

はじめに緑の線と緑の矢印についてです。

緑の線はある程度の期間で上値を押さえ込まれたところを抜けるときのレジスタンスポイントです。そして、そこを抜けるときはしっかりと大陽線を立てて抜けています。

さて今回はオレンジ色のトレンドラインです。

大陽線ではなく下ヒゲを残して抜けました。

6月上旬の底は下げ途上の底であり、本物ではない可能性が高いと考えております。

We added 4 types of trend lines on the chart.

First, you can see green resistance lines and green arrows.

These green lines are the points the market price resisted for some time.

And when the market price went over it, the market price formed a big white candle stick.

The recent market line is orange color.

And in this point, the market price went over but without a big white candle stick.

We think this means the market did not take the major bottom at the beginning of the June.


次にピンク色のラインです。

上値を長期にわたって押さえ込む新たなレジスタンスポイントの出現です。

ここを抜けるときは明確なトレンドの変化となるでしょう。

Next is pink line.

The major resistance point appeared.

When the market price will cut it, this will become the obvious breaking.


もっとも下落を示唆する王様は、青色です。

サポートになりそうなものが、どんどん下方向に書き足されています。

2012/06/25のNY銀のレポートと同じパターンになる可能性が濃厚です。

The best reasons of implying re-fall are blue lines.

The support levels rewrite lower and lower.

This is similar pattern of NY silver report in 06/25/2012.

結論は「今はあげるのかもしれませんが、再び売り場探し」ということになります。

Our conclusion is “The market may become a bear market rally now, and we need to find out the future selling point.”


相場分析のリクエストがありましたら“Contact Us”からお知らせください。ご要望にお応えできるように努力いたします。

このブログはあくまでも個人的な見解であり、投資判断は各自でお願い致します。当ブログは一切の投資損益に対する責任を負いません。

ホームページに来て下さってありがとうございます。明日もよろしくお願いいたします。

If you have some request to analyze, please write to “Contact Us”.

We do best effort for your request.

These are only personal opinions on this blog, and you need the investment judgment in each one. This blog doesn’t assume the responsibility to all the investment profit and loss.

Thank for watching our contents. My best regards next day.


© 2026 Retar