本日は日経平均日足についてです。
Today’s analyze is NIKKEI 225 daily.
本日は日経平均のトレンドラインに注目してみました。
重要な仮定として現在の相場が戻り相場だと仮定して分析しております。
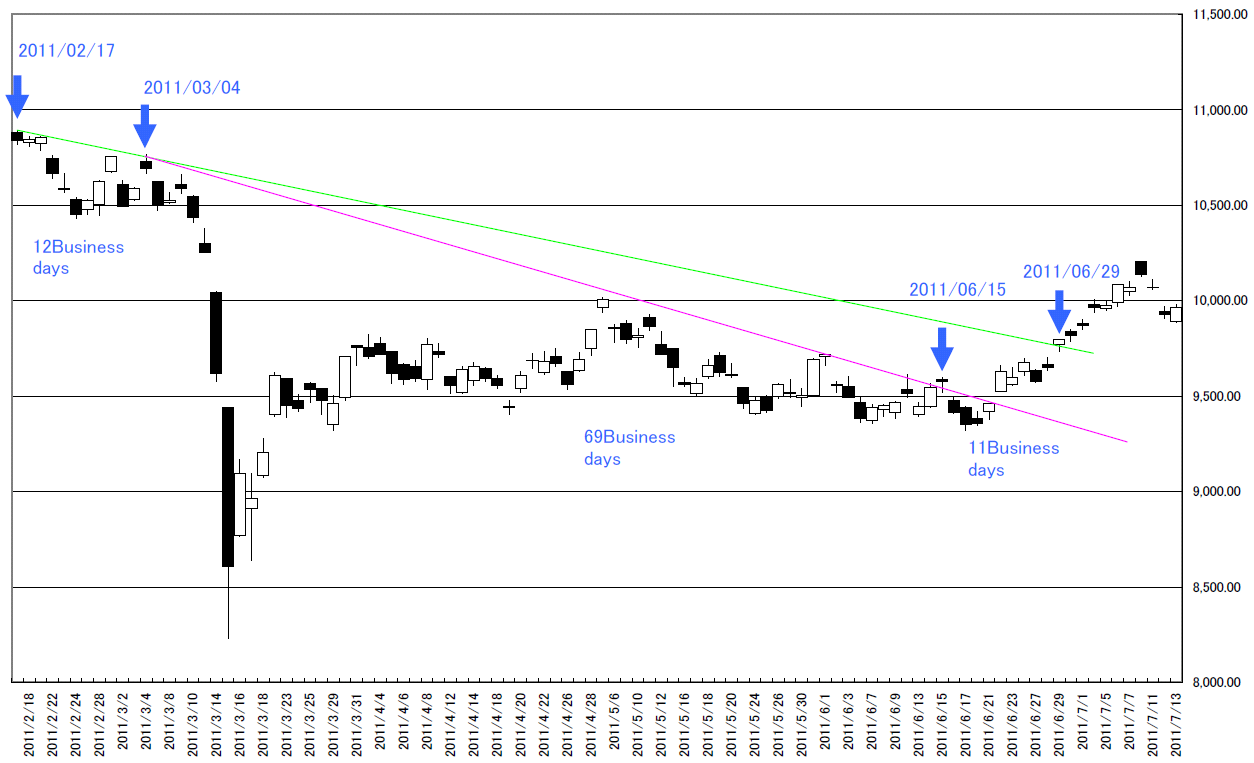
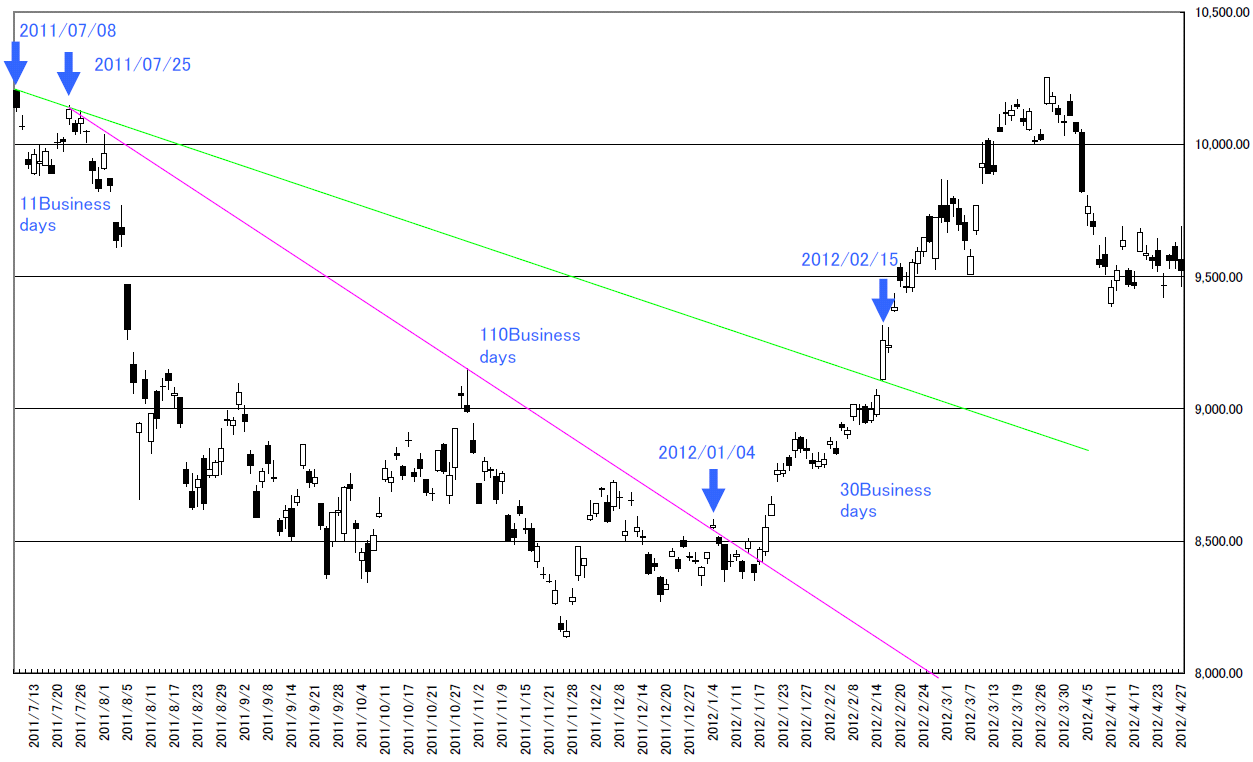
最近を含め3つの期間で以下の2本のトレンドラインを引いてみました。
- 高値と戻り高値を結んだラインを緑色
- 上値を押さえ込まれたピンクのライン
We analyze NIKKEI225 trend line.
As the important assumption, today’s report is based on a recovering market.
We add 2 trend lines on the chart.
- Green line which connected the high price and the recovery high
- The resistance line (pink)
4つのポイントに矢印をつけています。
現在の相場は緑のラインを超えてはいないため、4つ目のポイントはありません。
- 高値
- 戻り高値
- ピンクをはじめて超えたところ
- 緑を超えたところ
We add arrows on 4 points.
The recent market does not cut the green line; we can not add 4th point.
- High price
- Recovery high price
- The first point of cutting pink line
- The point of cutting green line
次にピンクのラインの下にいる日柄とピンクのラインと緑のラインの間にいる日柄の割合を求めてみます。
- 30/110 = 27%
- 11/69 = 15%
And now count up the business days between pink line and green line.
- 30/110 = 27%
- 11/69 =15%
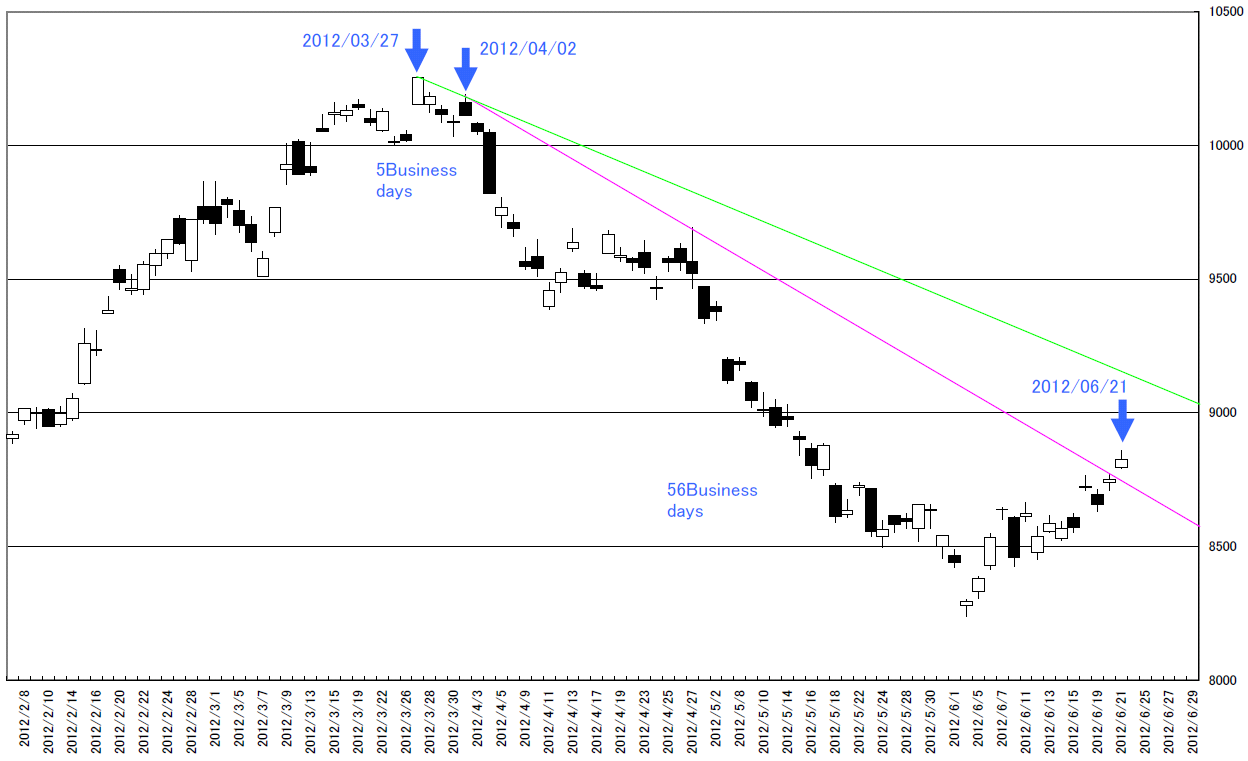
現在の相場はピンクのラインの下に56営業日あります。
ピンクと緑の間にいる期間が同率(約15%~30%)だとすると、8~16営業日の間、ピンクのラインと緑のラインの間にいることになります。つまり2012/07/02から2012/07/12の間に緑のラインを超えてくると考えることができます。
In the recent market, there are 56 business days under the pink line.
If the market price will stay between pink line and green line as the same comparatively (15% – 30%), it takes about from 8 to 16 business days cutting green line.
This means cutting green date is from 07/02/2012 to 07/12/2012.
相場分析のリクエストがありましたら“Contact Us”からお知らせください。ご要望にお応えできるように努力いたします。
このブログはあくまでも個人的な見解であり、投資判断は各自でお願い致します。当ブログは一切の投資損益に対する責任を負いません。
ホームページに来て下さってありがとうございます。明日もよろしくお願いいたします。
If you have some request to analyze, please write to “Contact Us”.
We do best effort for your request.
These are only personal opinions on this blog, and you need the investment judgment in each one. This blog doesn’t assume the responsibility to all the investment profit and loss.
Thank for watching our contents. My best regards next day.