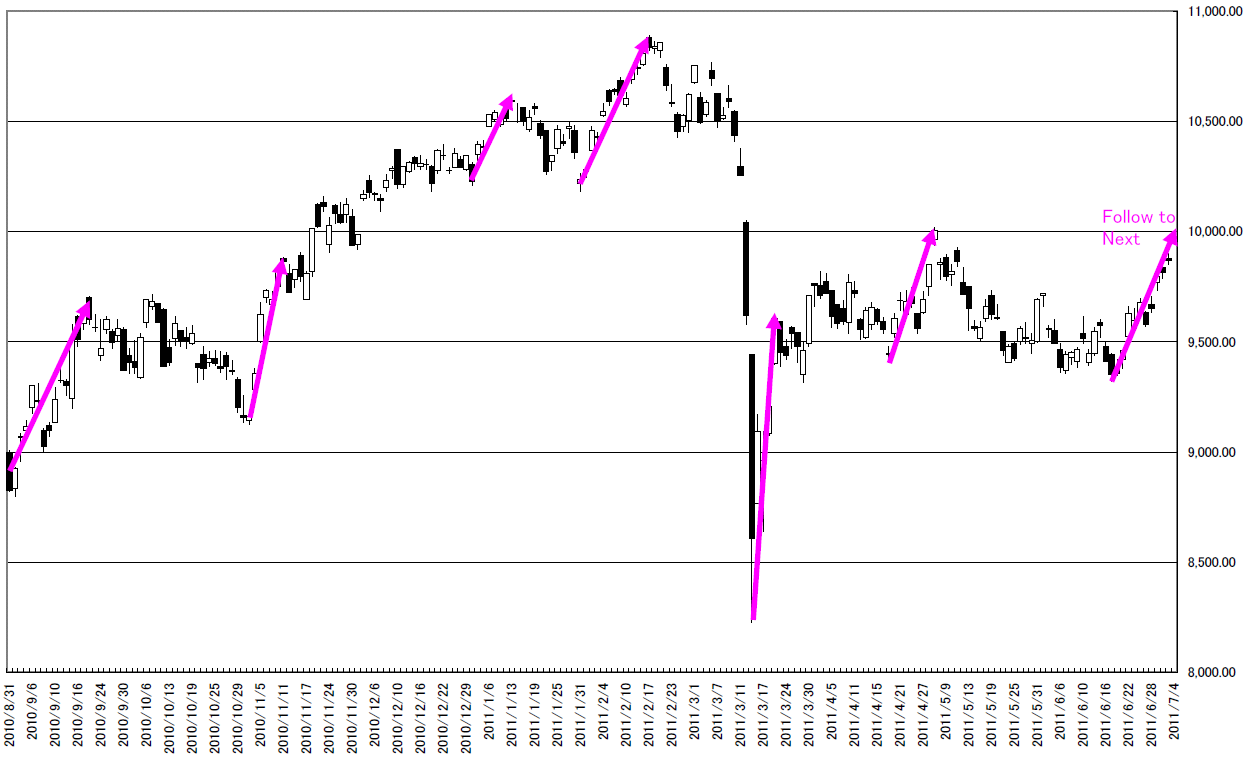
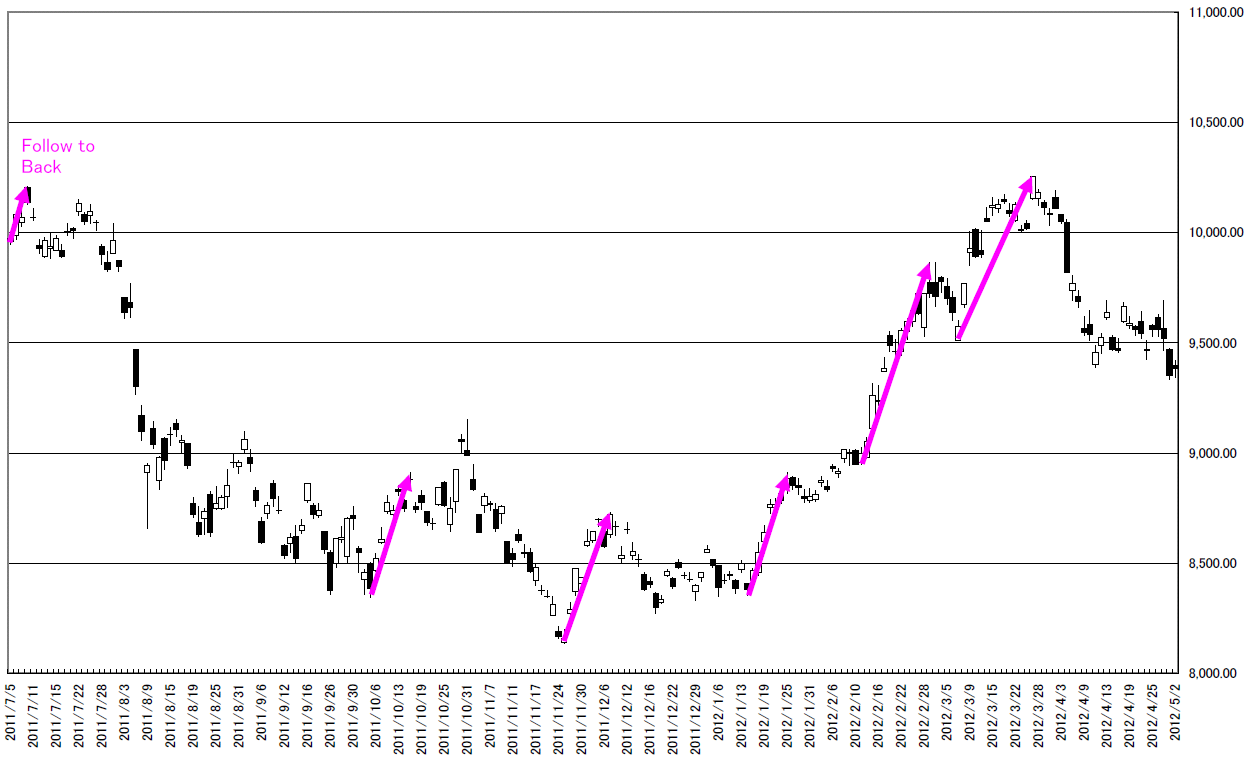
本日は日経225とTOPIX CORE 30についてです。
「金融工学と日本古来の投資テクノロジーをマッシュアップし、投資プログラムを芸術に高める」
Retar.jpの目指す目標です。
Today’s analyze is NIKKEI 225 and TOPIX CORE 30.
We mushup financial engineering and Japanese traditional technical analyze, and sophisticate our investment program.
This is Retar.jp final goal.
2012/05/04の調査では日経平均上昇局面での最近のTOPIX CORE 30アウトパフォーマーの性能を調査しました。
本日は2012/05/03の調査で上昇局面となった日柄の検証をしたいと思います。
In 05/04/2012, we analyze the recent TOPIX CORE 30 outperformer in N225 rally market.
Today, we survey the relation of 05/03/2012 analyze.
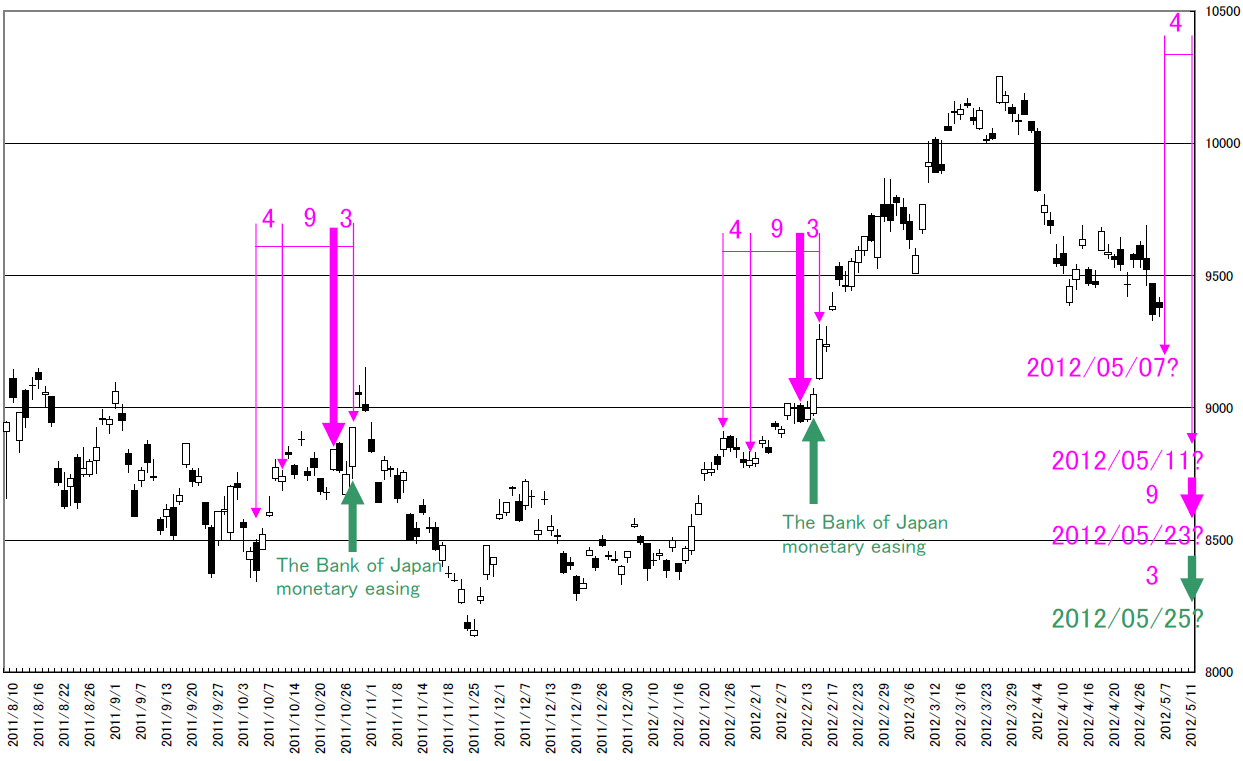
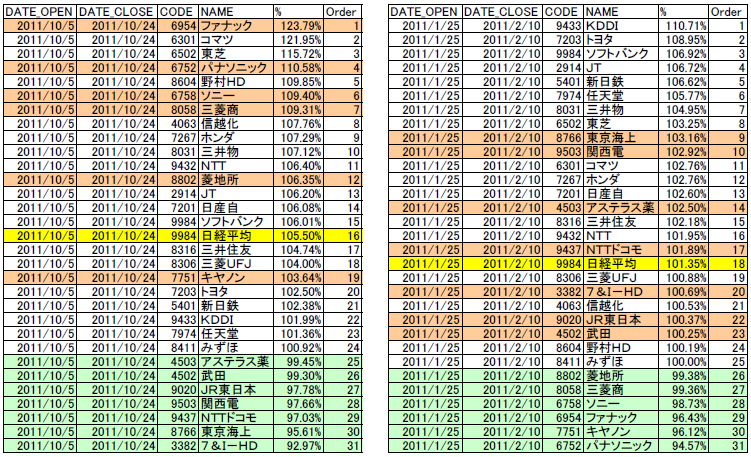
2012/01/25 -2012/02/10の日経平均のパフォーマンスは101.35%です。
また、2011/10/05-2011/10/24の日経平均のパフォーマンスは105.5%です。
The performance of N225 in 01/25/2012 – 02/10/2012 is 101.35%.
And the performance of N225 in 10/05/2012 – 10/24/2012 is 105.5%.
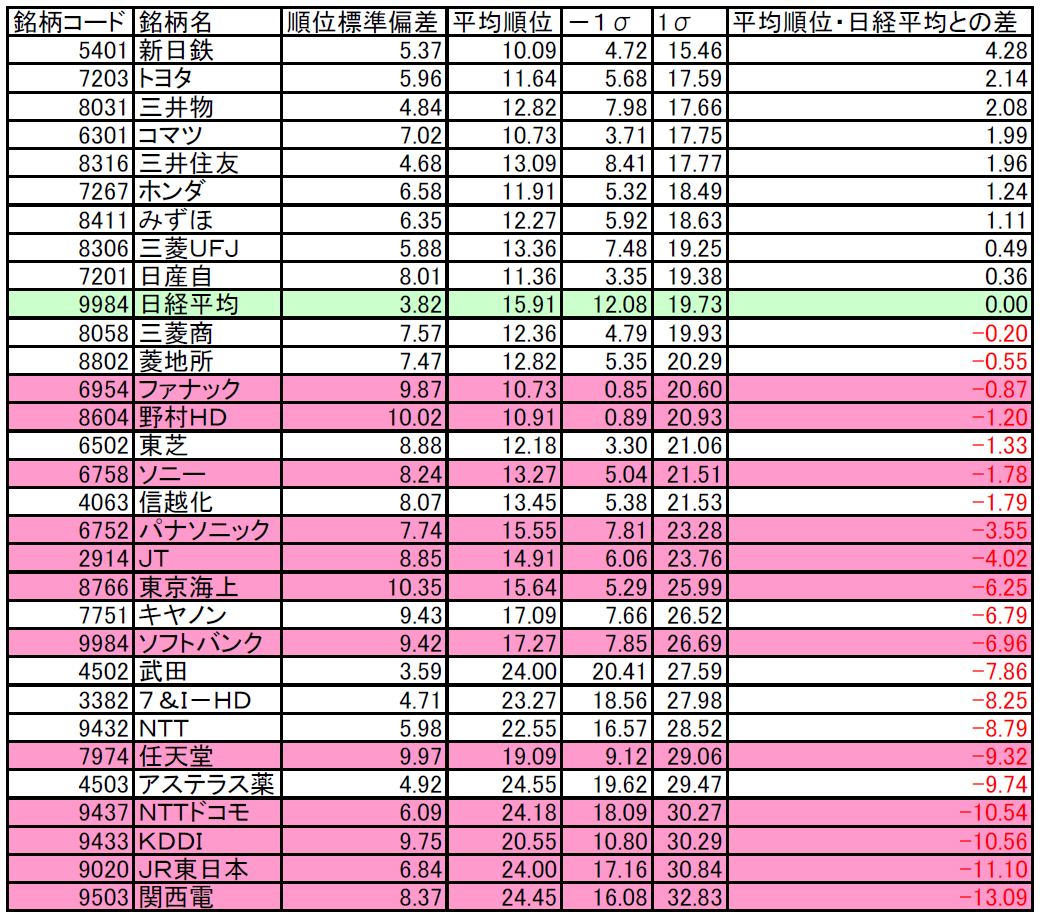
ここで、2012/05/04に登場したアウトパフォーマー上位5位(新日鉄:5401、トヨタ自動車:7203、三井物産:8301、コマツ:6301、三井住友:8316)を同額購入したとしたときの平均パフォーマンスを検証します。(注意:最低単位の場合は資金フレームが異なるので違う結果になります)
アウトパフォーマー上位5位は、トレードのオープンとクローズでマイナスになっていないことが重要です。
アウトパフォーマー上位5位は、アンダーパフォーマーにはなっていません。
2012/01/25 -2012-02-10の平均パフォーマンスは105.09%です。
2011/10/05-2011/10/24の平均パフォーマンスは107.74%です。
2回とも日経平均のパフォーマンスと同等かそれ以上の結果を得ていることになります。
さて上昇相場になったとして「2012/05/07引け買い、2012/05/23引け売り」どうなるのでしょうか?
And, we analyze the average performance of the outperformer top 5 analyzed in 05/04/2012 (“SHINNITETSU”:5401,”TOYOTA”:7203,”MITSUIBUSSAN”:8301,”KOMATSU”:6301,”MITSUISUMITOMO”:8316) and bought the same money amount. (Caution; this is not the minimum amount of buying)
What are the most important things are these outperformers did not become the underperformers.
And these did not become underperformers.
The performance of outperformer top 5 in 01/25/2012 – 02/10/2012 is 105.09%.
And the performance of outperformer top 5 in 10/05/2012 – 10/24/2012 is 107.74%.
In these 2 cases, the performance was same or more over comparing N225 same period.
Now, if the market may become a rally market, what will become “Buy in 05/07/2012 and release the position is 05/23/2012”?
相場分析のリクエストがありましたら“Contact Us”からお知らせください。ご要望にお応えできるように努力いたします。
このブログはあくまでも個人的な見解であり、投資判断は各自でお願い致します。当ブログは一切の投資損益に対する責任を負いません。
ホームページに来て下さってありがとうございます。明日もよろしくお願いいたします。
If you have some request to analyze, please write to “Contact Us”.
We do best effort for your request.
These are only personal opinions on this blog, and you need the investment judgment in each one. This blog doesn’t assume the responsibility to all the investment profit and loss.
Thank for watching our contents. My best regards next day.