日経225 : 日经225 : NIKKEI 225

日経225日足・押し目チャンス?/ NIKKEI 225(Osaka: ^N225) Daily. This is chance or not?

2011/02/23

本日は日経225日足についてです。

Today, we analyze Nikkei 225 daily.

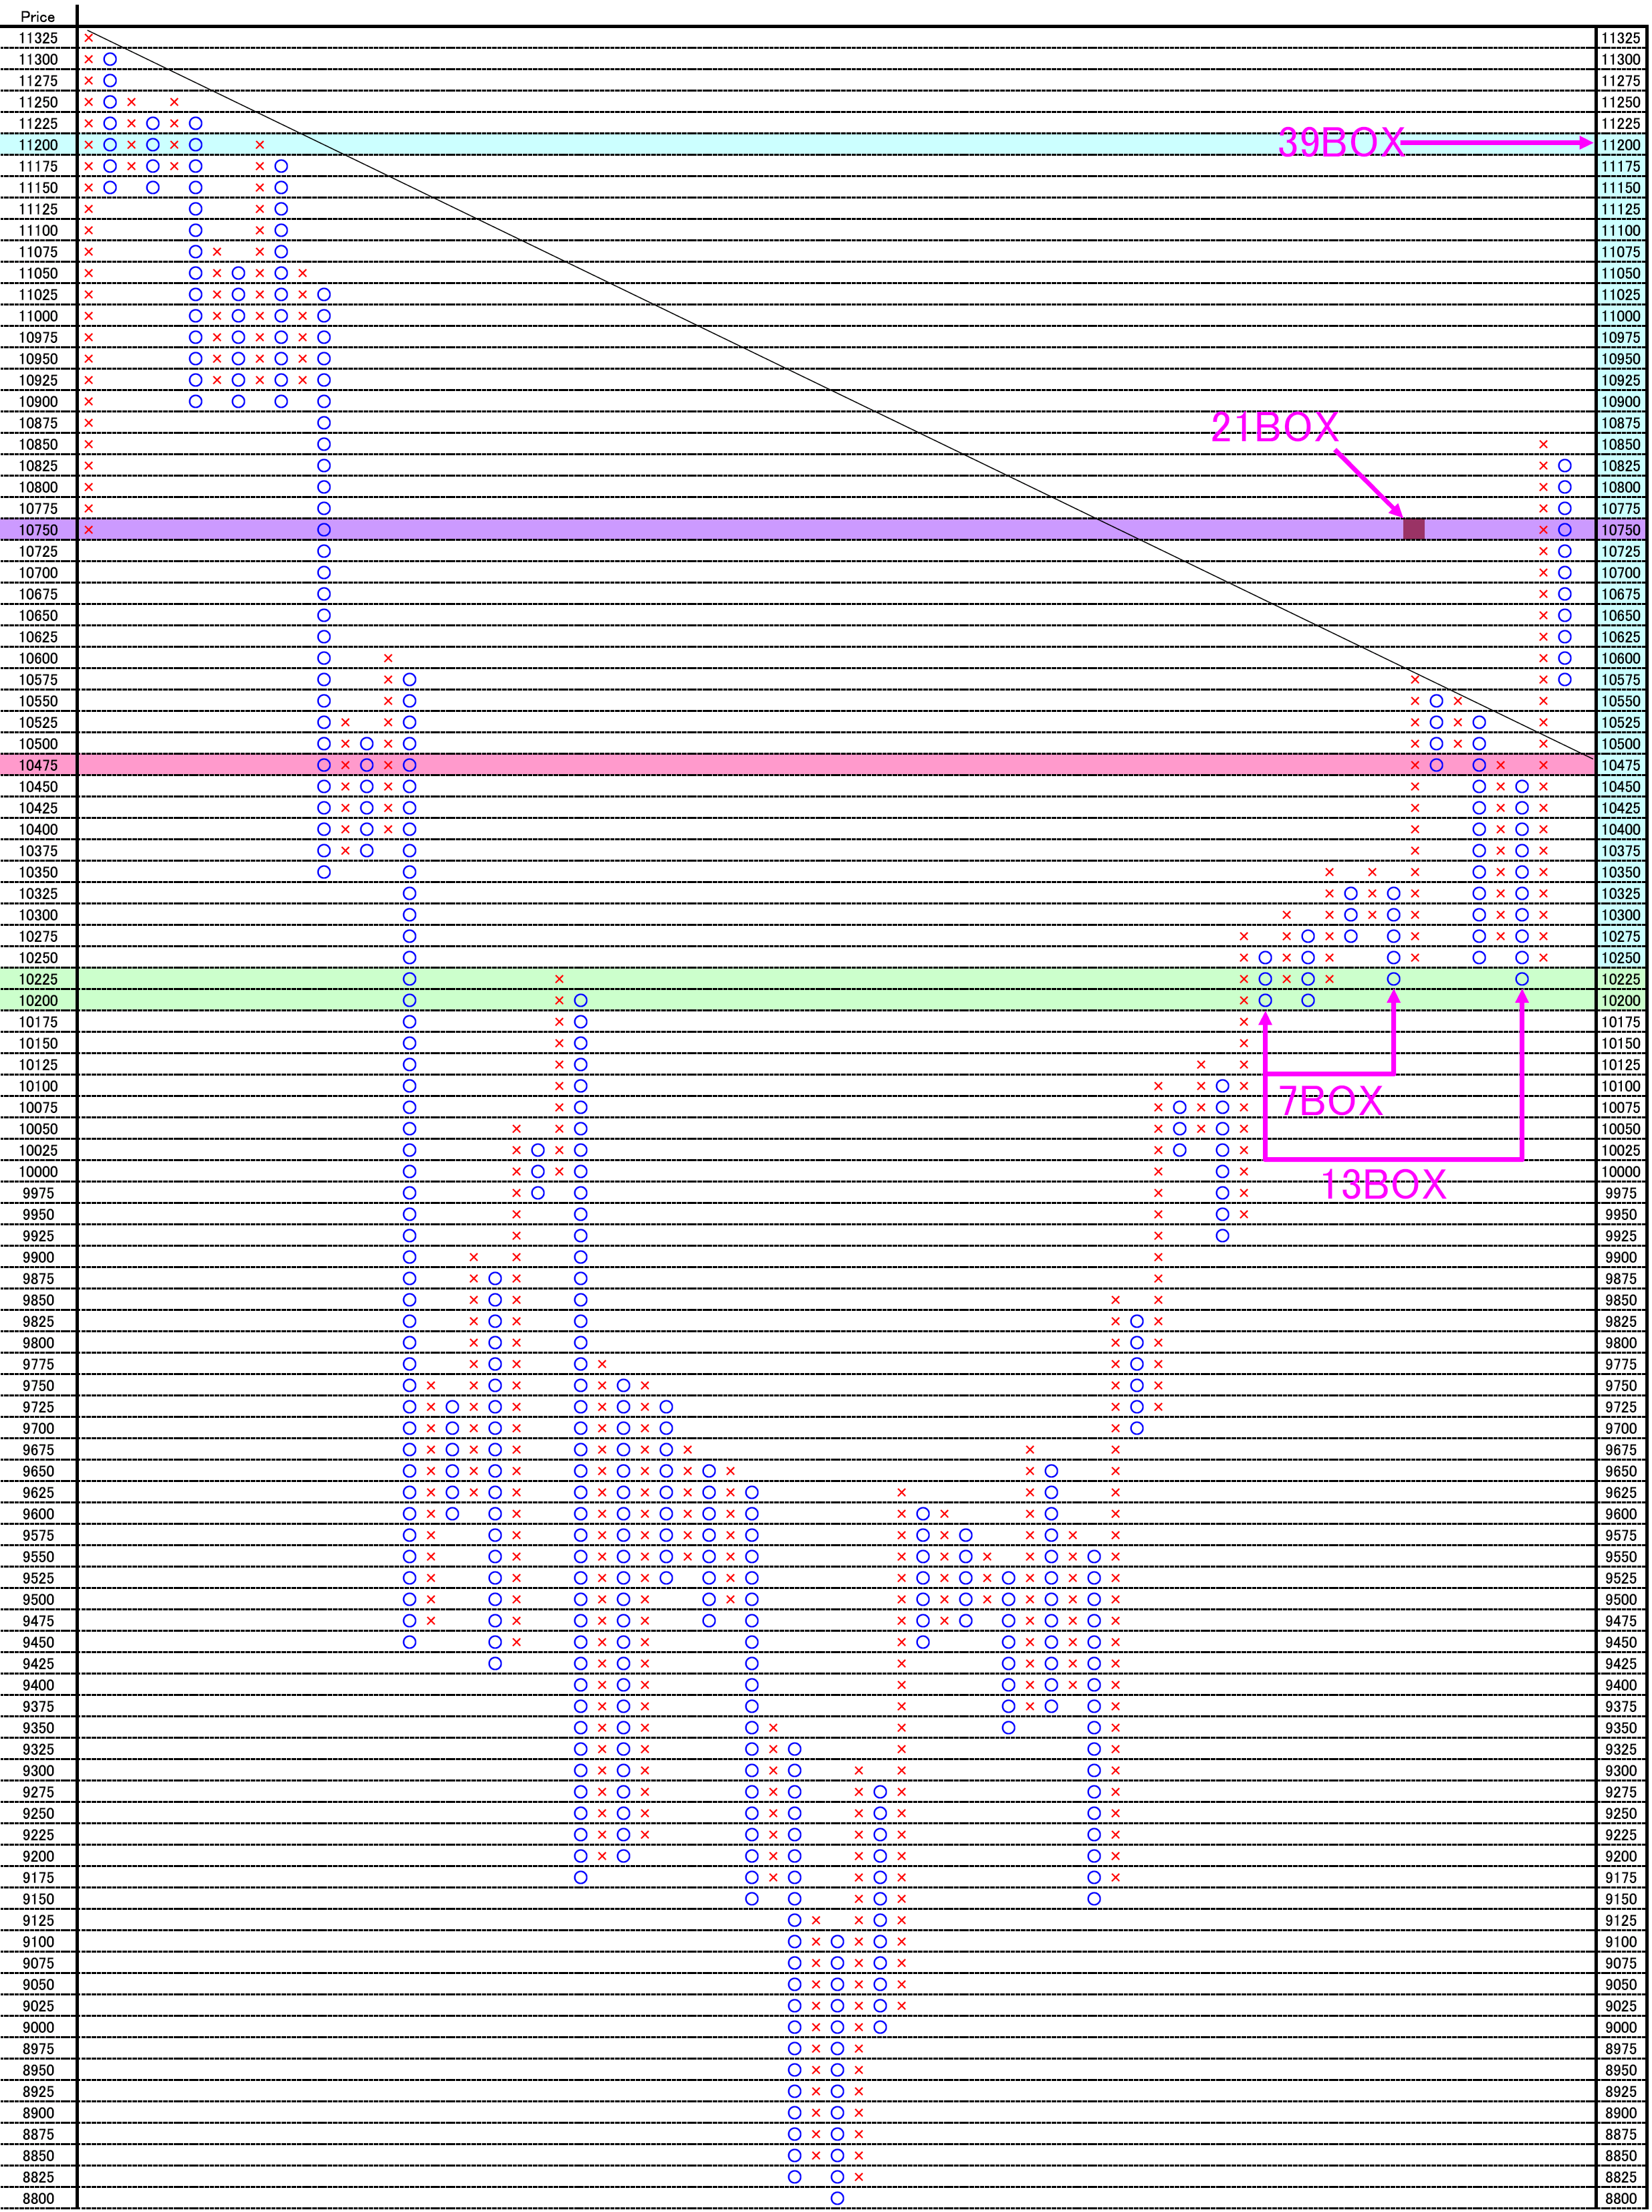
1枠25円、3枠転換の終値ポイントアンドフィギュアです。

下げだしましたが、ターゲットは10475円、10200円とみています。

直近垂直下落が10枠、12枠。現在は11枠であるため、達成感はあります。

再び反転上昇に転じたときの水平分析の上昇ターゲットは10750円、11200円が見えています。

This is 25yen change and 3 box reversal close price’s Point and Figure chart.

The price goes down side, and target price are 10475yen and 10200yen.

The latest verticals down side move are 10 boxes and 12 boxes.

And now the price reached 11 boxes.

If the market becomes bullish trend, target prices are 10750yen and 11200yen. These are calculated by horizontal method.
25

次は一目均衡表です。

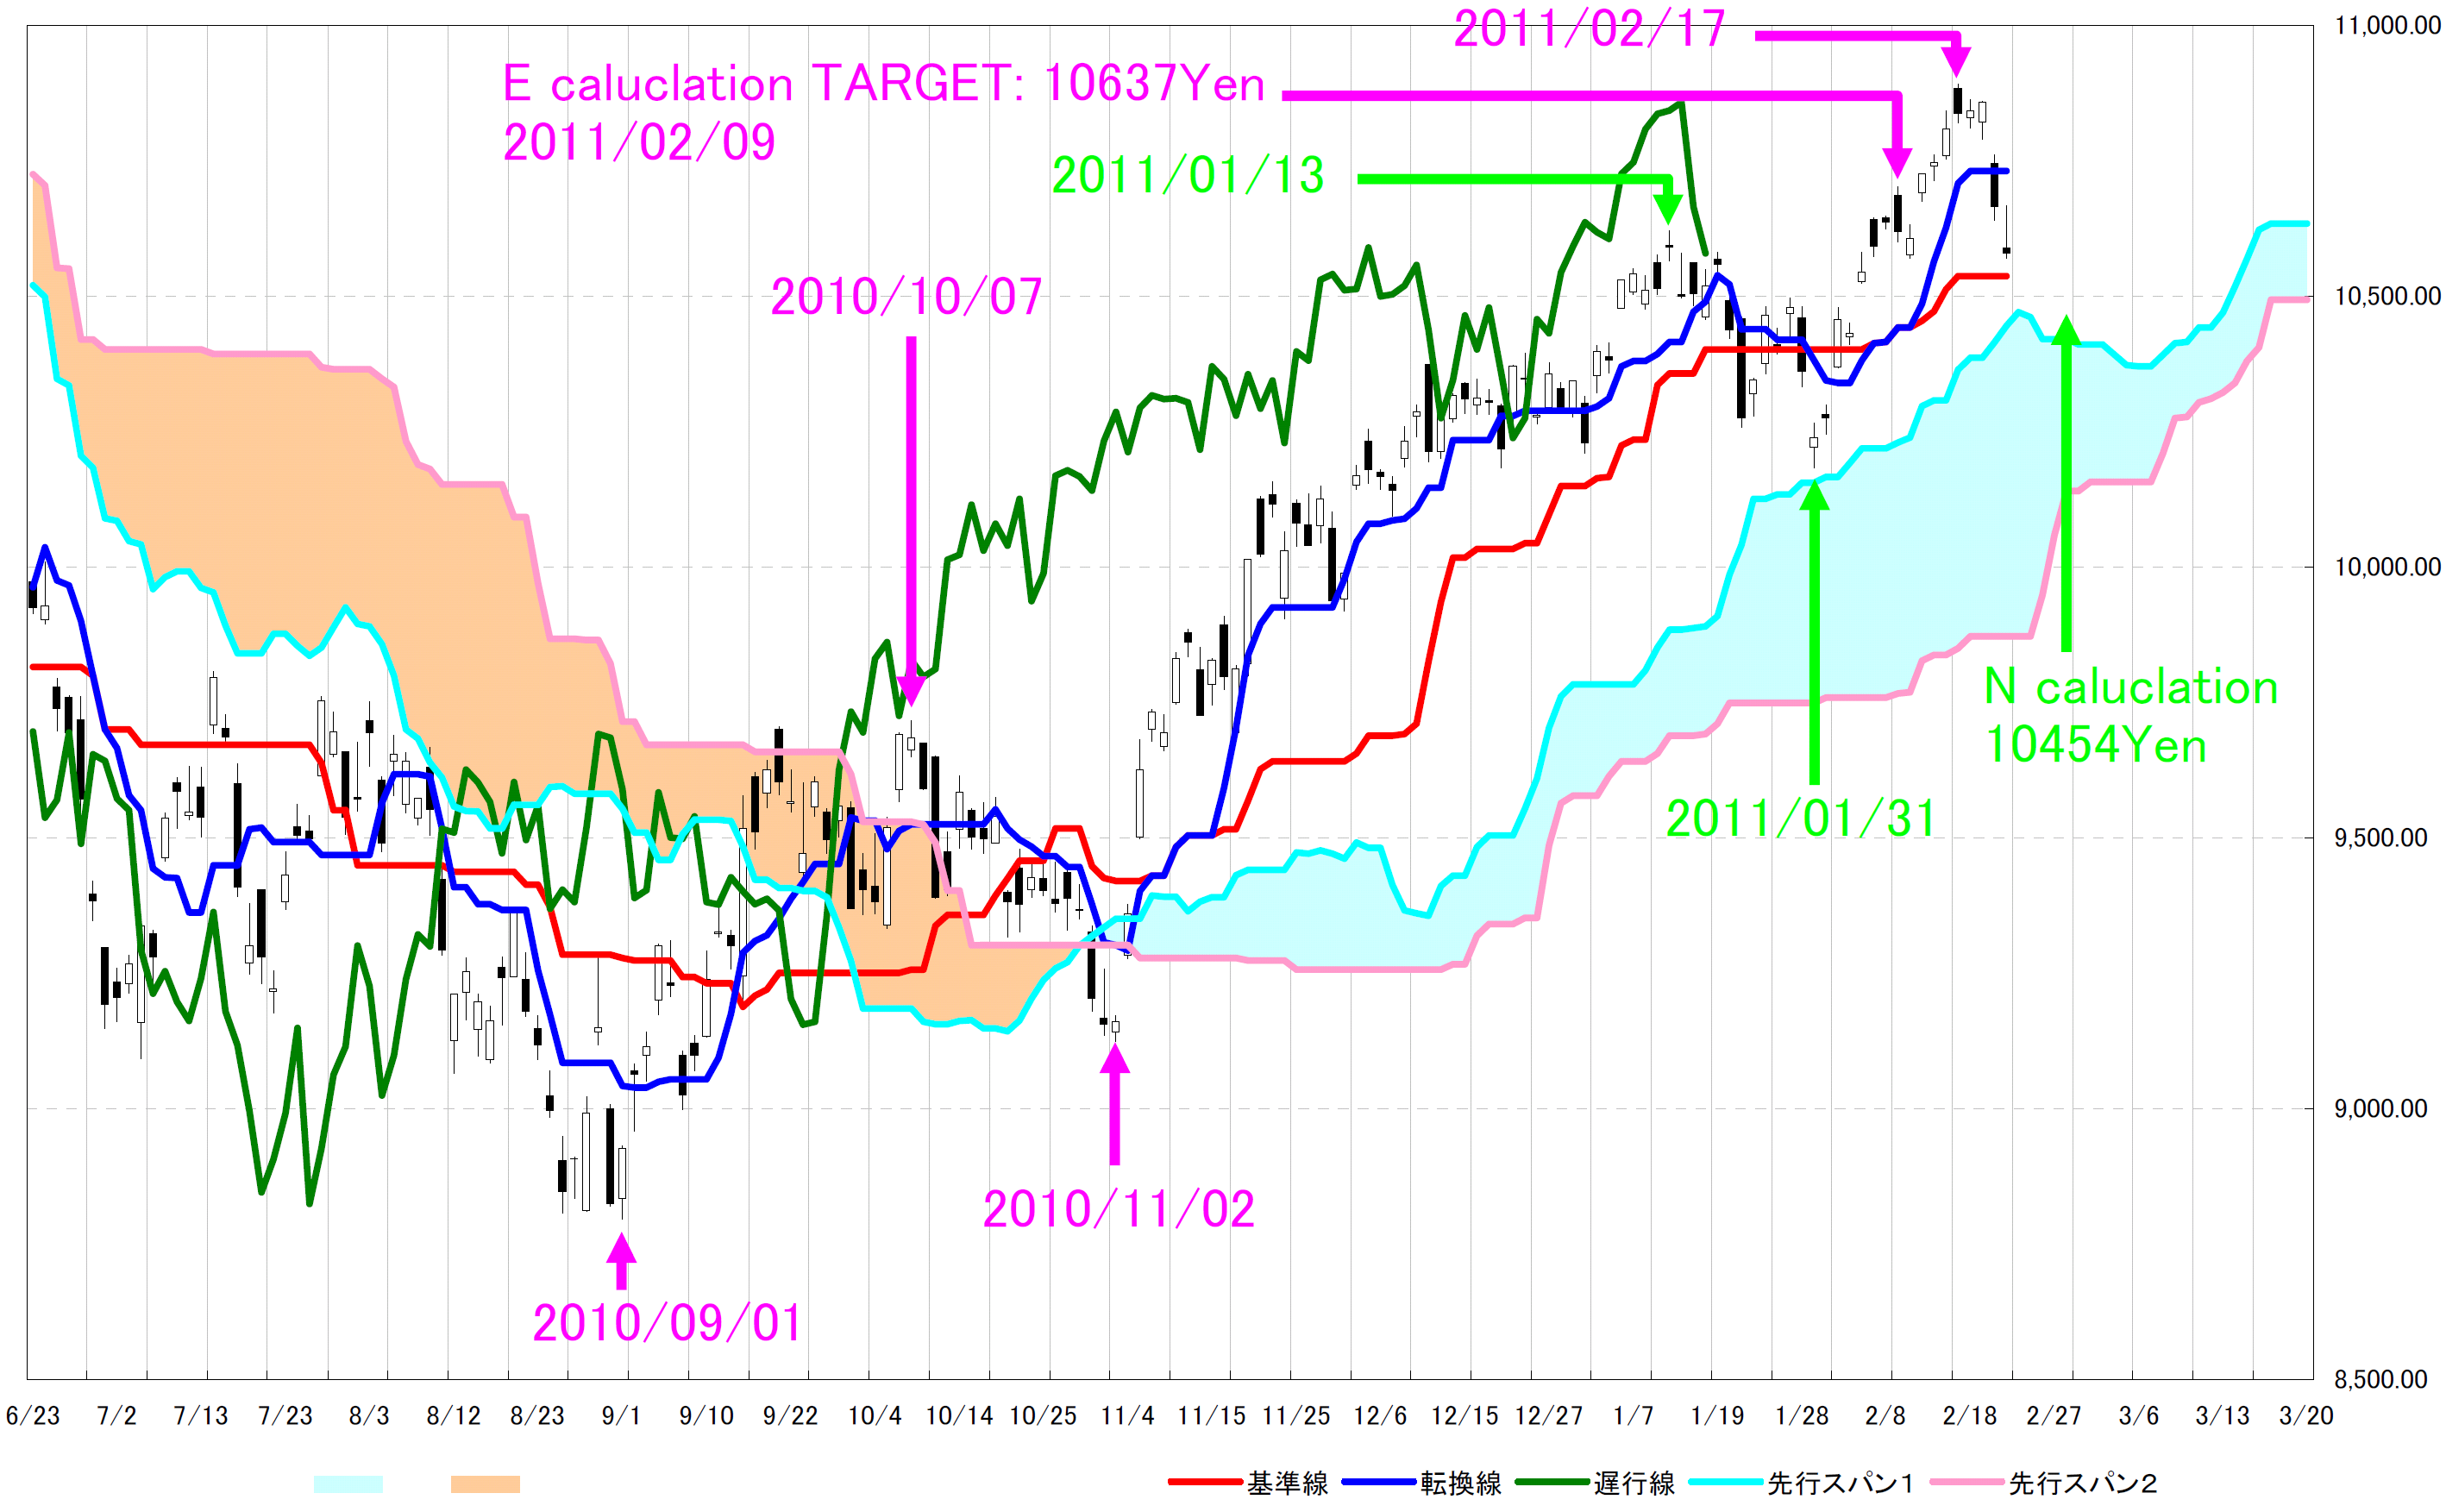
N計算値で求められる下値は10454円です。

雲上限とほぼ一致しています。

Next is “ICHIMOKU” chart.

Down side target is 10454yen. (N calculation)

This is nearly same as upper side of the cloud.
ichi

相場分析のリクエストがありましたら“Contact Us”からお知らせください。ご要望にお応えできるように努力いたします。

このブログはあくまでも個人的な見解であり、投資判断は各自でお願い致します。当ブログは一切の投資損益に対する責任を負いません。

ホームページに来て下さってありがとうございます。明日もよろしくお願いいたします。

If you have some request to analyze, please write to “Contact Us”.

We do best effort for your request.

These are only personal opinions on this blog, and you need the investment judgment in each one. This blog doesn’t assume the responsibility to all the investment profit and loss.

Thank for watching our contents. My best regards next day.

日経225日足・上昇相場になるか?/Nikkei255 Daily. Bullish trend may come?

2011/02/06

本日は日経225日足についてです。

土曜日のシカゴ日経平均先物は10640.00円でした。

Today’s report is Nikkei 225 daily.

Last Saturday’s CME close price is 10640.00yen.

はじめに一目均衡表です。

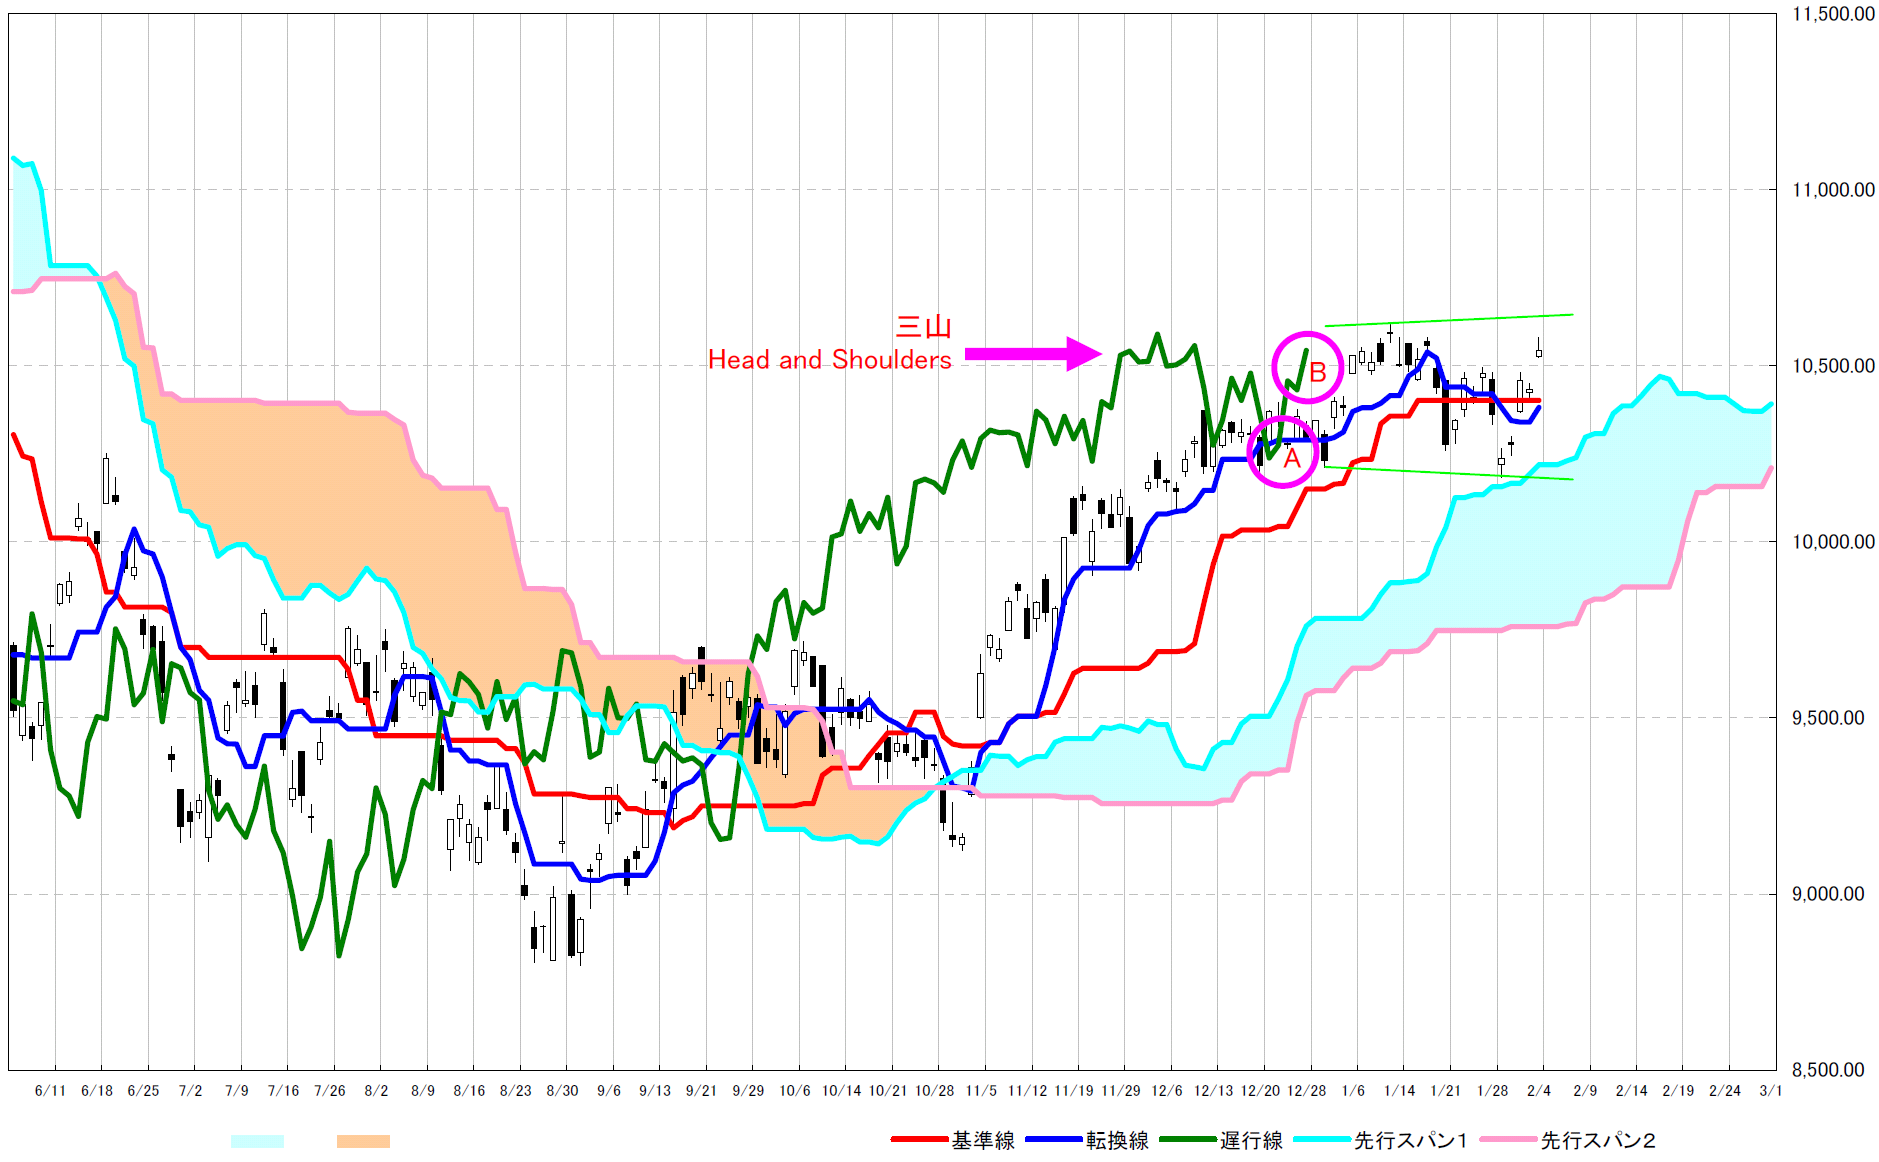
遅行スパンに注目すると、A点は売りを検討する局面でしたが、Bでしっかり上抜けてきています。雲の上限手前で下落が止まり反転していることを考慮すると、強い上昇相場になるかもしれません。

First is “Ichimoku” chart.

We take notice “A” point’s late span and at this point, we might consider selling.

But at “B” point, the late span cut over the real price.

Eventually, the price did not dip the cloud. And this may imply bullish trend may come.

ichi

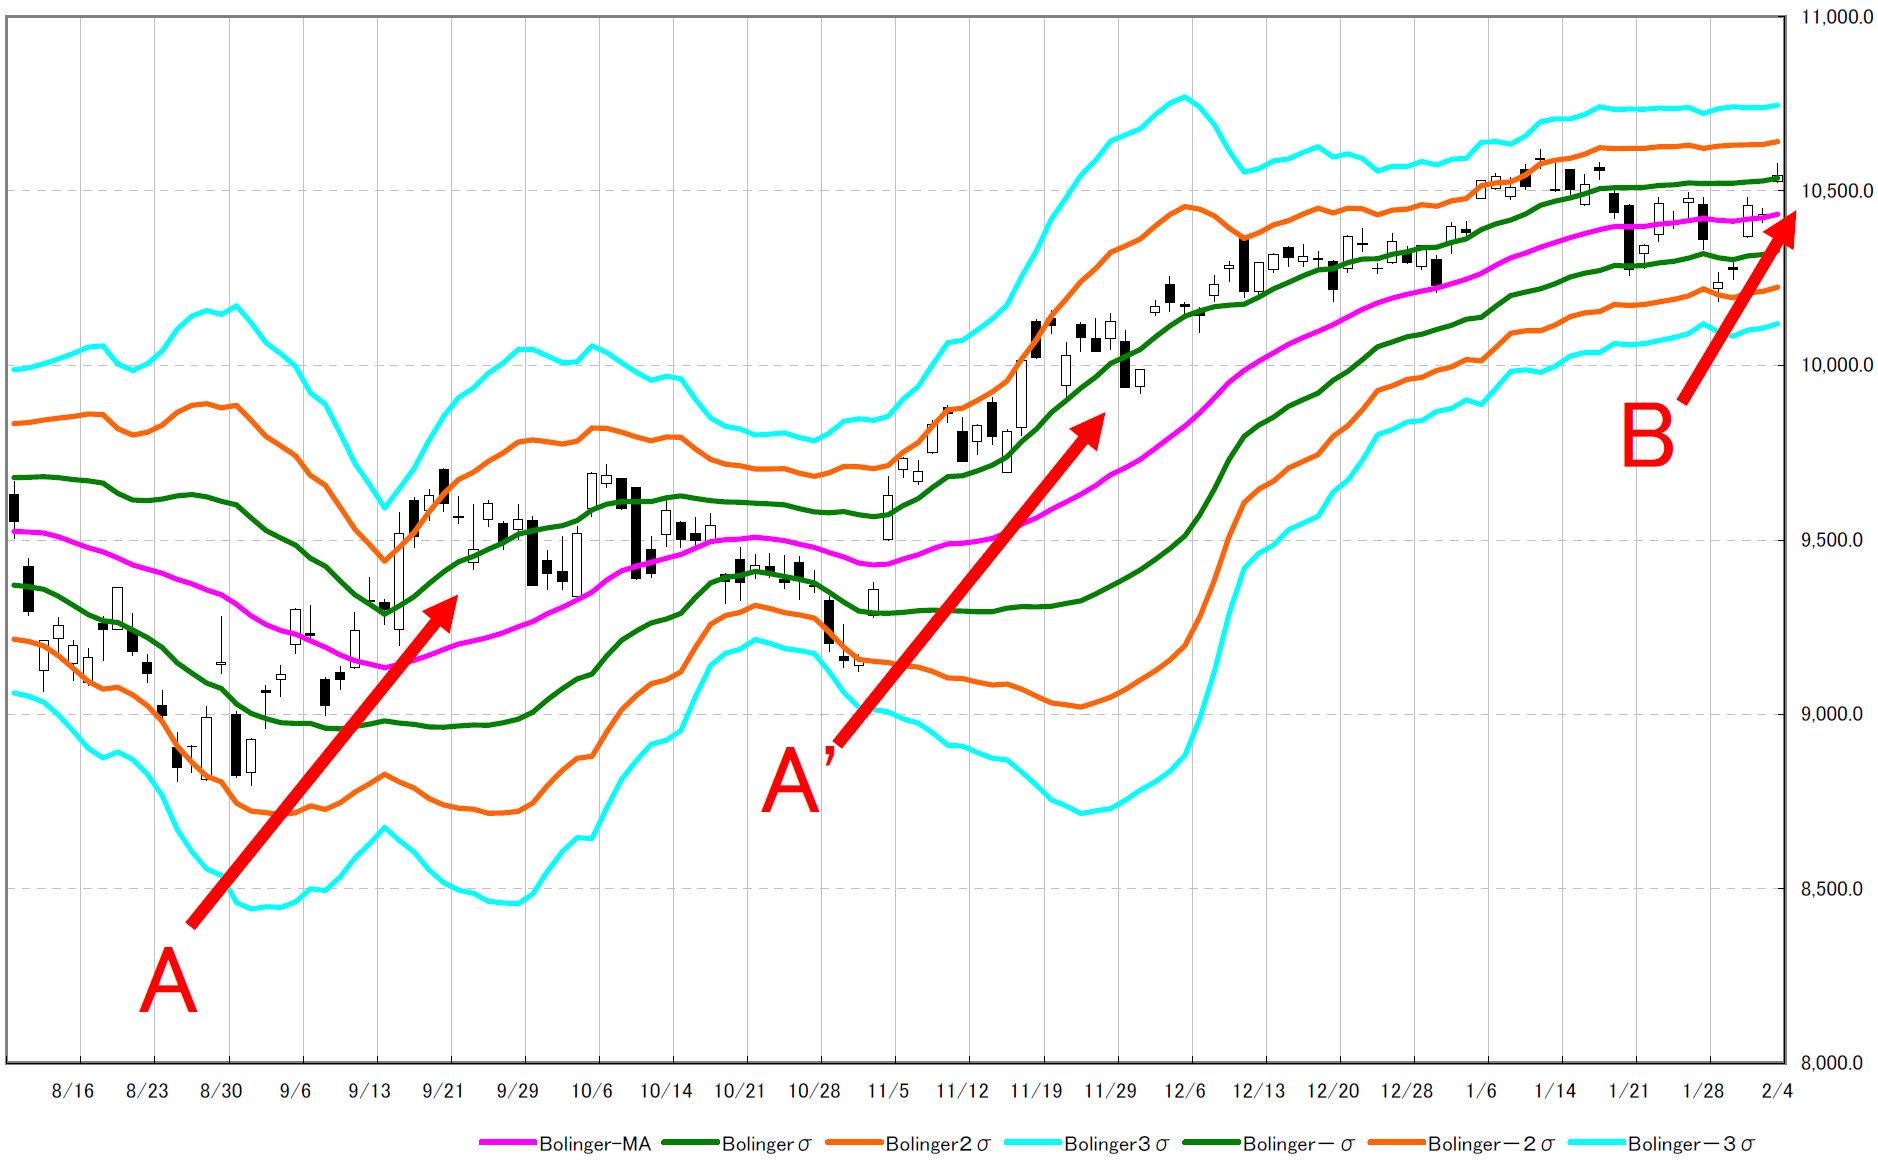
次はボリンジャーバンドです。

A、A’局面ではボリンジャーの幅が広げながら、上昇していきました。

今回の局面Bは、広がりが弱々しいです。今のところ懐疑的な上昇トレンドと言えます。来週以降のバンド幅の広がり方にも注目していきたいと思います。

Next chart is Bollinger Bands.

At “A” and “A’” point, the band widths were expanding.

At “B” point, the extension is weak.

I think the bullish trend is skeptical now.

We need to watch the band width expanding on next week.

bol

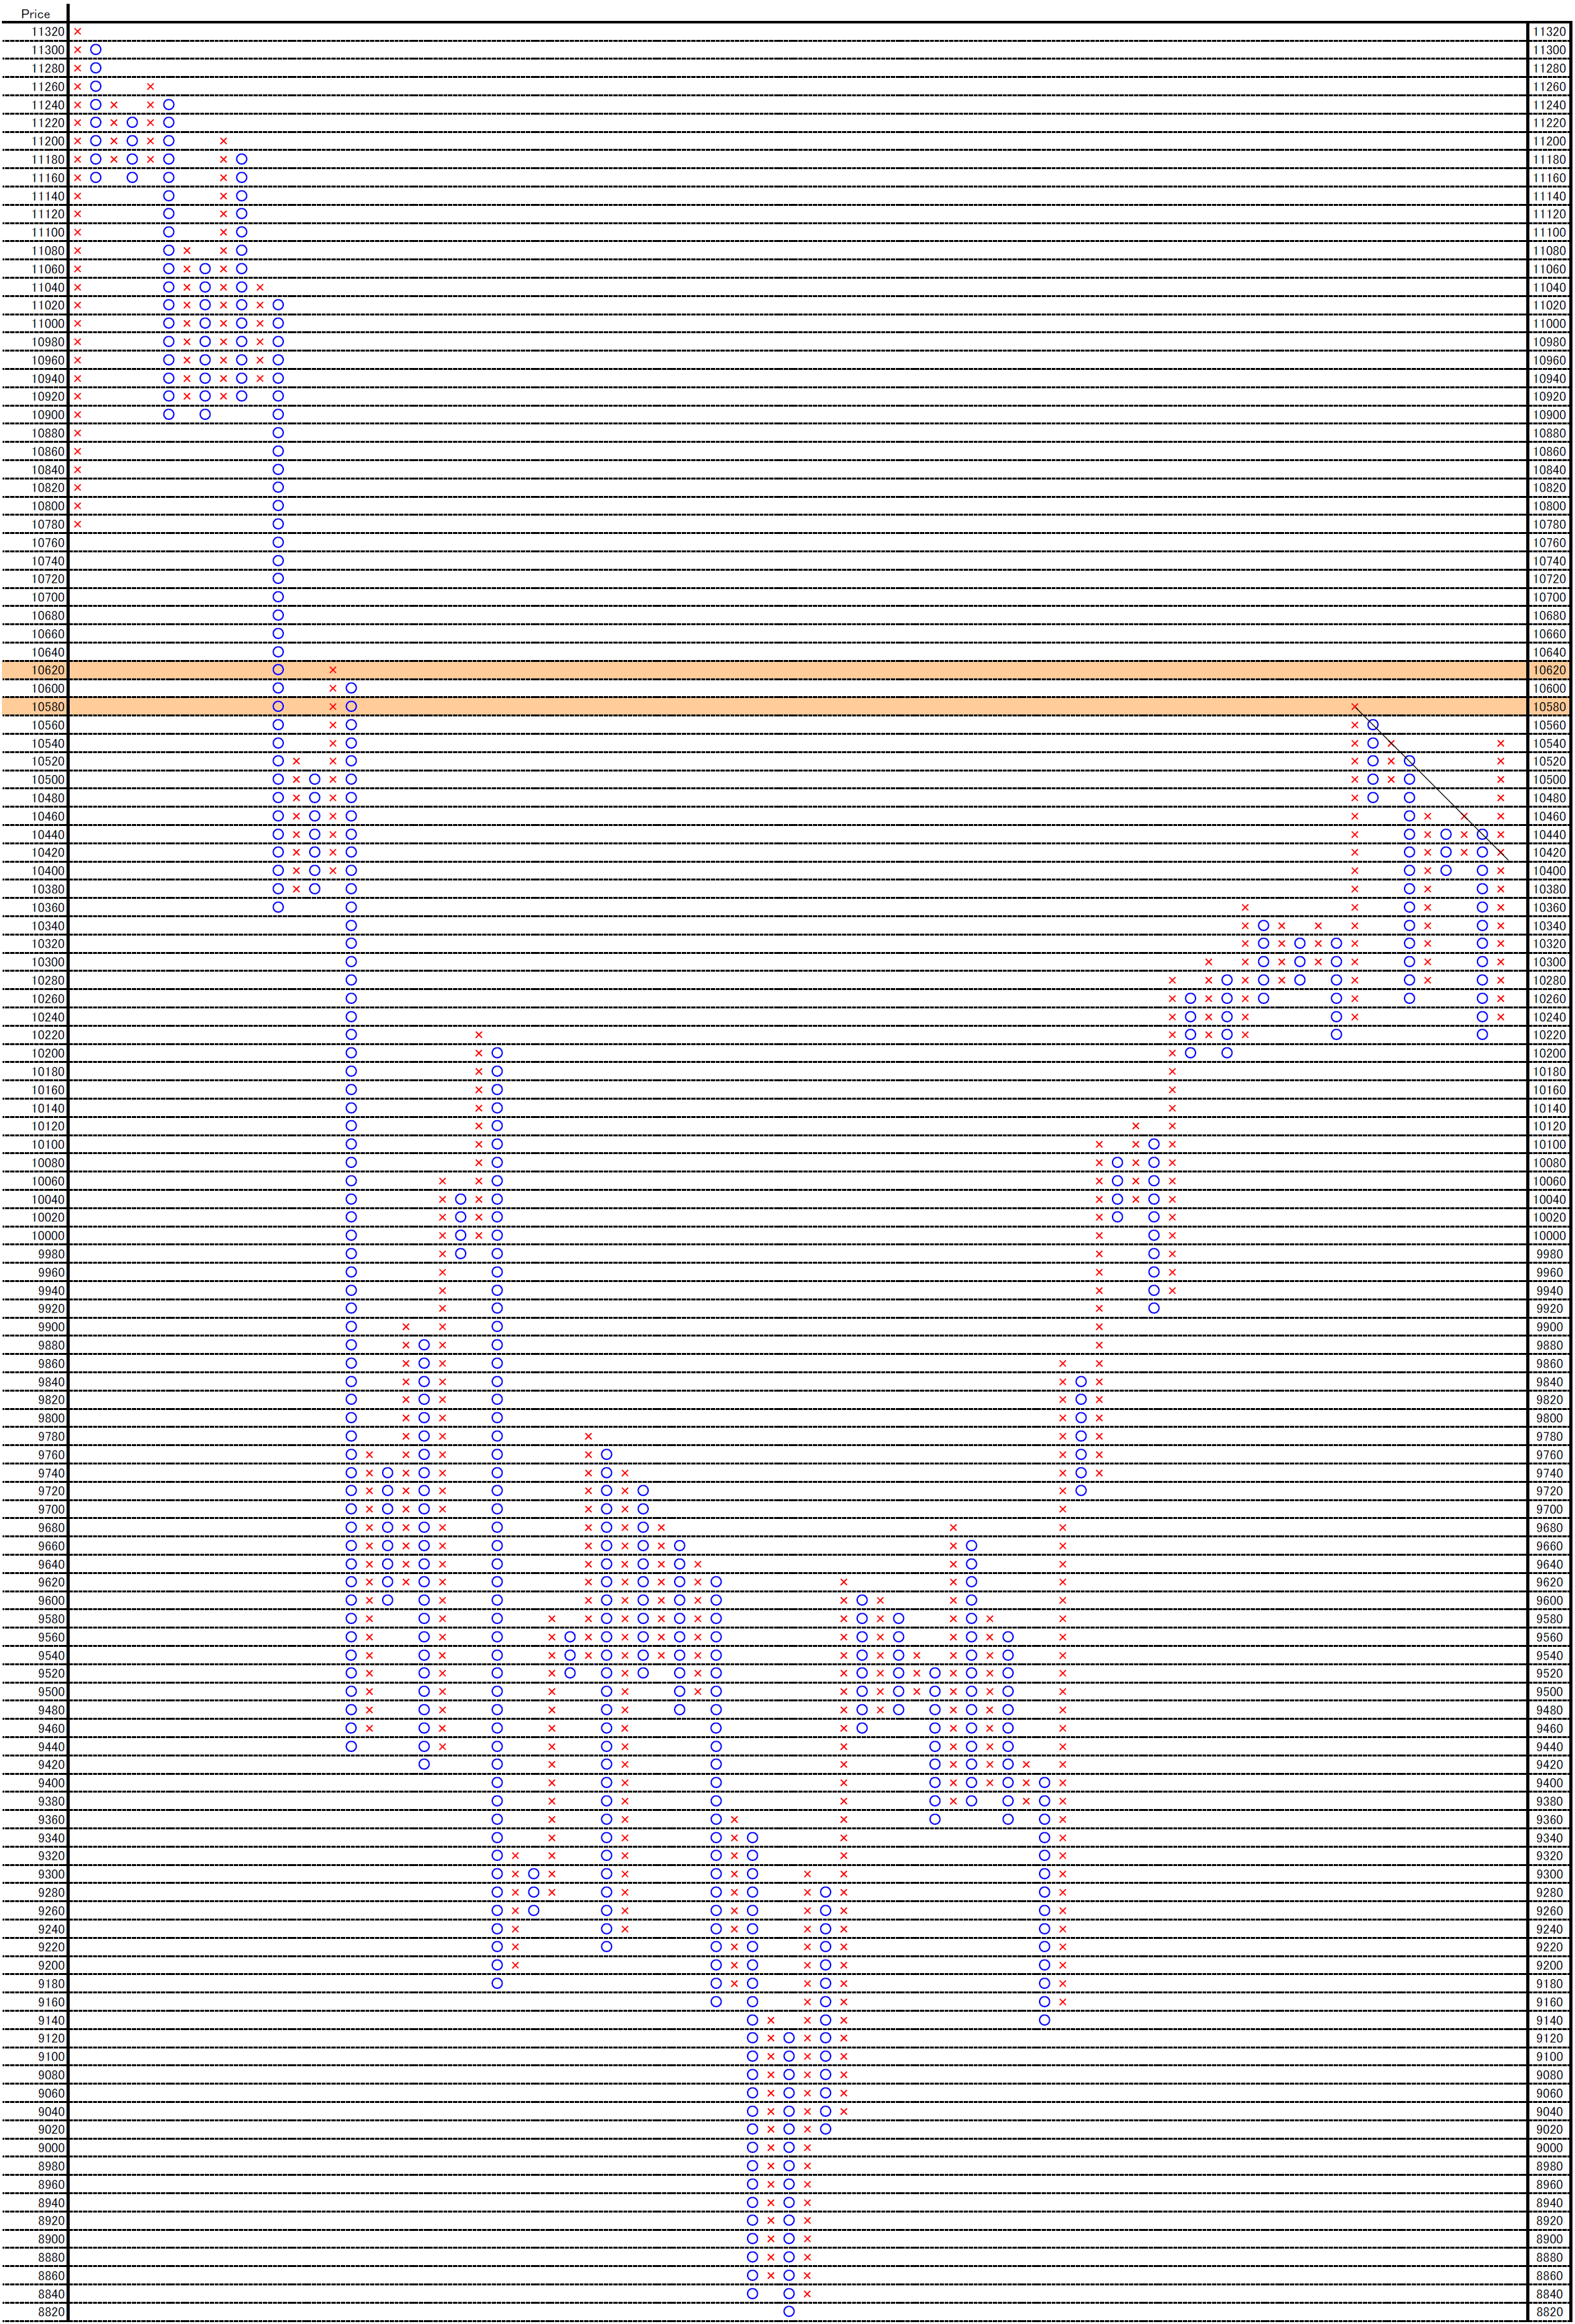
最後に1枠20ポイントと0.02ポイント、3枠転換の終値ポイントアンドフィギュアです。

10580円、10620円付近に抵抗帯が控えています。

ここを抜けると上昇に弾みがつく可能性があります。

Last chart is 20 point price change and 3 box reversal close price’s Point and Figure chart.

We can see the resistance levels at 10580yen and 10620yen.

But over cutting these levels, bullish trend may accelerate.

PF

相場分析のリクエストがありましたら“Contact Us”からお知らせください。ご要望にお応えできるように努力いたします。

If you have some request to analyze, please write to “Contact Us”.

We do best effort for your request.

ホームページに来て下さってありがとうございます。明日もよろしくお願いいたします。

Thank for watching our contents. My best regards next day.
このブログはあくまでも個人的な見解であり、投資判断は各自でお願い致します。当ブログは一切の投資損益に対する責任を負いません。

These are only personal opinions on this blog, and you need the investment judgment in each one. This blog doesn’t assume the responsibility to all the investment profit and loss.


© 2026 Retar