日本10年債金利 : 日本10年期国债收益率 : Japanese Government Bonds 10-Year

日本10年債利回り日足・上昇基調継続/Japanese Government Bonds 10-Year Daily. Bullish trend is going on.

2011/02/22

本日は、日本10年債利回り日足を分析しました。

Today, we analyze Japanese Government Bonds 10-Year Daily.


1枠0.01ポイントと0.02ポイント、3枠転換の終値ポイントアンドフィギュアです。

2009/01/05から週末までのデータで作成しています。

This is 0.01 and 0.02 price change and 3 box reversal close price’s Point and Figure chart.

We calculate it from 01/05/2009 to weekend data.

0.02ポイントチャート

フラットトップからレンジブレークをしています。

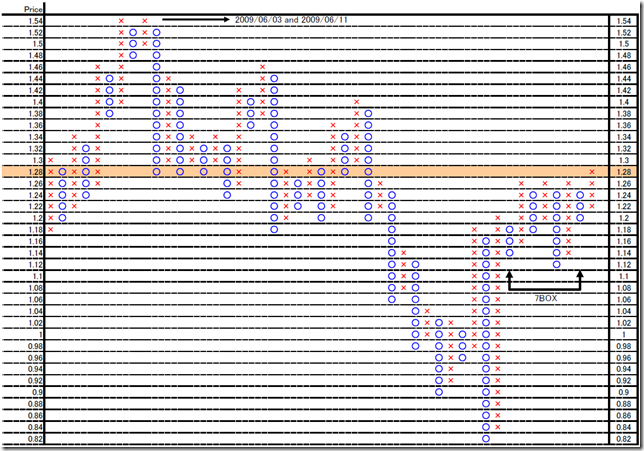
直近の上昇が垂直7枠上昇であったことから、最初の1.34ポイント付近がターゲットになるでしょう。

一旦の達成感のある局面です。再上昇するためにも、一服ほしい所です。

日本国債になんらかの上昇圧力がかかり大幅な上昇が起こったとすると、水平7枠持ち合いから求められる垂直方向ブレークの1.62ポイントがターゲットになります。

0.02point chart

The price is range breaking from flat top.

The last upper side breaking was 7 boxes, so I think first target is 1.34point.

Now the price reached target price.

And we need to waiting for next action.

If some rising event occurs, target is 1.62point. This value is calculated by horizontal 7 boxes steadiness.

0.02

0.01ポイントチャート

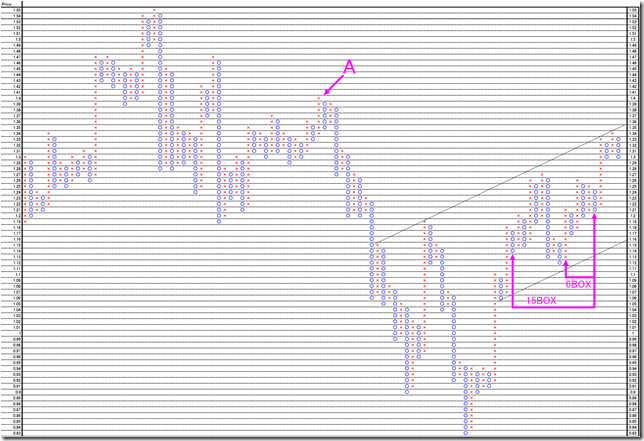
水平分析から求められるターゲットは、1.39ポイント、1.64ポイントなどがあります。

1.39ポイントはA点の戻り高値と同水準なので、ここをしっかり抜いてくると、さらなる金利の上昇があるかもしれません。

0.01point chart

The targets are 1.39 point and 1.64point calculated by horizontal method.

1.39 point level is as nearly same as last recovery high (A point). And if the price cuts this level, the interest may go more upper side.

0.01

相場分析のリクエストがありましたら“Contact Us”からお知らせください。ご要望にお応えできるように努力いたします。

このブログはあくまでも個人的な見解であり、投資判断は各自でお願い致します。当ブログは一切の投資損益に対する責任を負いません。

ホームページに来て下さってありがとうございます。明日もよろしくお願いいたします。

If you have some request to analyze, please write to “Contact Us”.

We do best effort for your request.

These are only personal opinions on this blog, and you need the investment judgment in each one. This blog doesn’t assume the responsibility to all the investment profit and loss.

Thank for watching our contents. My best regards next day.


日本10年債利回り日足・上方ブレーク/Japanese Government Bonds 10-Year Daily. Bull trend is coming.

2011/02/05

本日は、日本10年債利回り日足を分析しました。

Today, we analyze Japanese Government Bonds 10-Year Daily


1枠0.01ポイントと0.02ポイント、3枠転換の終値ポイントアンドフィギュアです。

2009/01/05から週末までのデータで作成しています。

This is 0.01 and 0.02 price change and 3 box reversal close price’s Point and Figure chart.

We calculate it from 01/05/2009 to weekend data.


0.02ポイントチャート

フラットトップからレンジブレークをしています。

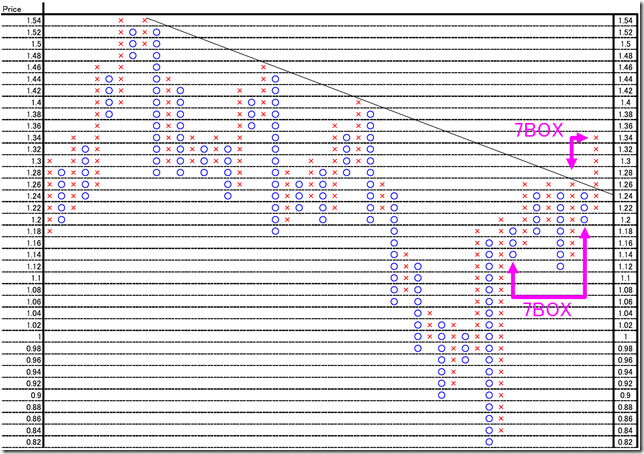
直近の上昇が垂直7枠上昇であったことから、最初の1.34ポイント付近がターゲットになるでしょう。

日本国債になんらかの上昇圧力がかかり大幅な上昇が起こったとすると、水平7枠持ち合いから求められる垂直方向ブレークの1.62ポイントがターゲットになります。

0.02point chart

The price is range breaking from flat top.

The last upper side breaking was 7 boxes, so I think first target is 1.34point.

If some rising event occurs, target is 1.62point. This value is calculated by horizontal 7 boxes steadiness.

002


0.01ポイントチャート

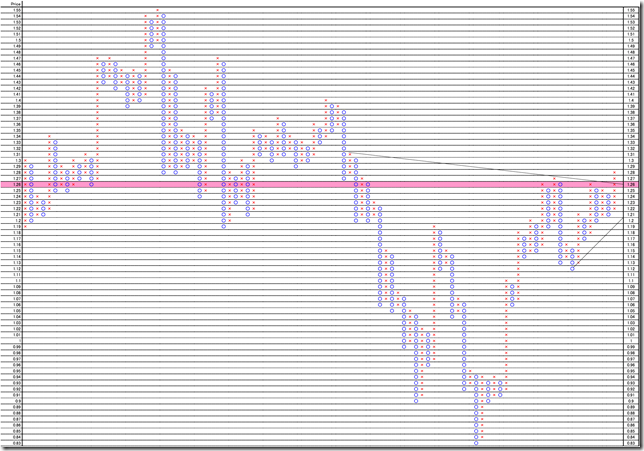
1.31ポイント付近に軽い抵抗帯があります。

直近の1.30-1.35ポイント付近でもみ合いが形成されていたため、上昇するにも一旦はこの付近で値固めする可能性があります。

0.01point chart

We can see weak resistance point at 1.31point around.

Around 1.30-1.35 points, the latest market forms steadiness.

I think the market go into consolidation period around here.

001


相場分析のリクエストがありましたら“Contact Us”からお知らせください。ご要望にお応えできるように努力いたします。

If you have some request to analyze, please write to “Contact Us”.

We do best effort for your request.

ホームページに来て下さってありがとうございます。明日もよろしくお願いいたします。

Thank for watching our contents. My best regards next day.
このブログはあくまでも個人的な見解であり、投資判断は各自でお願い致します。当ブログは一切の投資損益に対する責任を負いません。

These are only personal opinions on this blog, and you need the investment judgment in each one. This blog doesn’t assume the responsibility to all the investment profit and loss.


© 2025 Retar