上海総合指数 : 上证指数 : SSE Composite Index

上海総合指数週足・しばらく持ち合いでは?/SSE Composite Index (Shanghai: 000001.SS) Daily. We think steadiness may come for some time.

2011/11/05

本日は上海総合指数週足です。

先週末のデータで分析しています。

Today’s analyze is SSE Composite Index weekly data.

We use last weekend data.


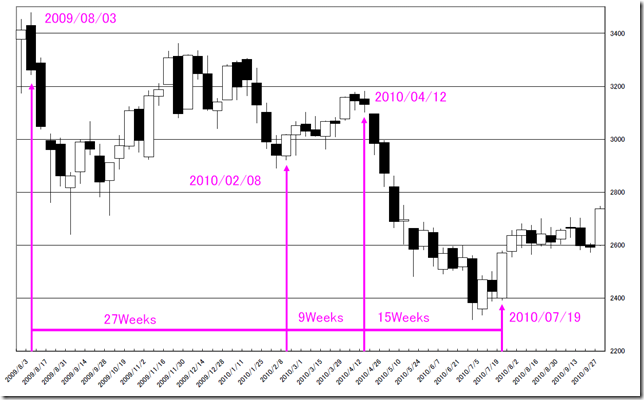
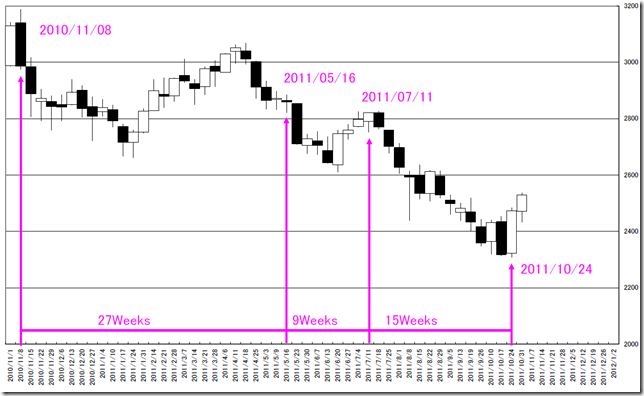
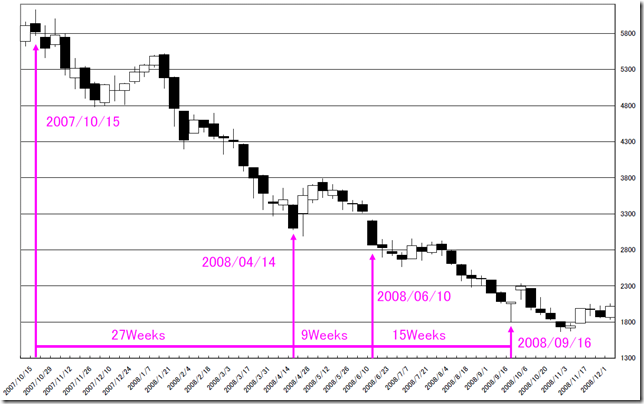
2007年以降の下落過程を調査していくと、①2007/10/15週天井、②2009/08/03週天井、③2010/11/08週天井をつけています。この天井に対する相場の底は、①2008/09/16週底、②2010/07/29週底、③2011/10/24週底と見ています。

現在の相場は、下落相場サイクルを達成したばかりだと考えております。

リーマンショック時のように安値を割り込むこともあるかもしれませんが、新しい相場サイクルまでの持ち合い期間だと考えられます。

Analyzing after 2007’s bear market, we can see three peaks (1. 10/15/2007 week peak, 2. 08/03/2009 week peak and 3. 11/08/2010 week peak).

And the pears of the bottom week are 1.09/16/2008 week bottom, 2.07/29/2010 week bottom and 3.10/24/2011 week bottom.

We think the recent market has reached the market cycle end.

And the market may cut the lowest like LEAMAN shocks market.

But we think now is a steadiness time.

09_10

07_08

09_10

10_11


相場分析のリクエストがありましたら“Contact Us”からお知らせください。ご要望にお応えできるように努力いたします。

このブログはあくまでも個人的な見解であり、投資判断は各自でお願い致します。当ブログは一切の投資損益に対する責任を負いません。

ホームページに来て下さってありがとうございます。明日もよろしくお願いいたします。

If you have some request to analyze, please write to “Contact Us”.

We do best effort for your request.

These are only personal opinions on this blog, and you need the investment judgment in each one. This blog doesn’t assume the responsibility to all the investment profit and loss.

Thank for watching our contents. My best regards next day.


上海総合指数・弱い地合/SSE Composite Index (Shanghai: 000001.SS) Daily. We think bearish.

2011/10/17

本日は上海総合指数日足です。

先週末のデータで分析しています。

Today’s analyze is SSE Composite Index daily data.

We use last weekend data.


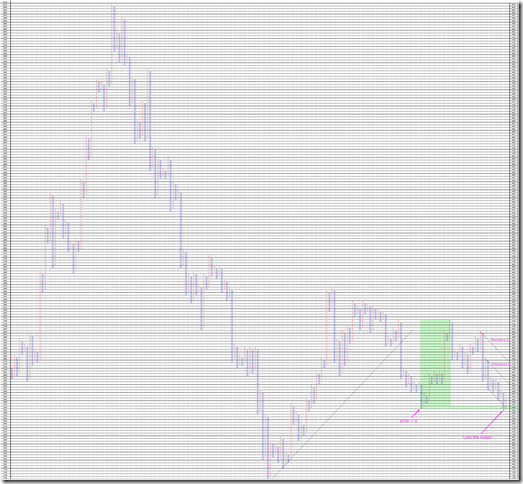
1枠25ポイント、3枠転換の終値ポイントアンドフィギュアです。

弱い地合が継続していると考えられます。

Resistance A、Resistance Bを越えるまではトレンド転換を確認できないと考えられます。

This is 25 point change and 3 box reversal close price’s Point and Figure chart.

We think now is bearish.

We think if the market trend may change, the market price need to cuts Resistance A and Resistance B.

PF


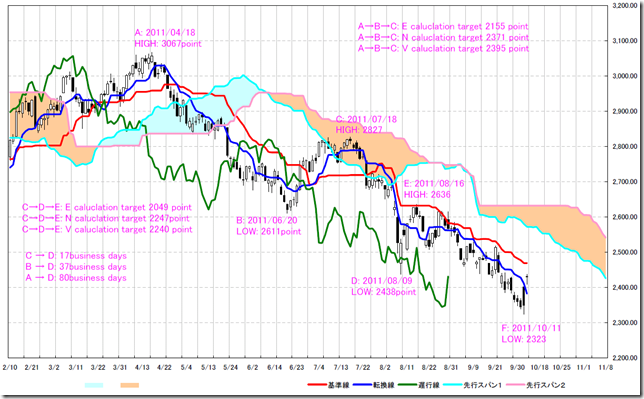
一目の計算値から考えてみます。

ABC波動のターゲットを達成しています。

更に下げるのであれば、CDE波動のターゲットが見えてきます。

We calculate by “ICHIMOKU” way.

The market price reaches the target price in ABC wave.

And if the market price may go down side, we need to notice CDE wave.


また、この後の変化日として注目したいのは、2011/10/20から2011/10/28にかけてだと考えております。

① 2011/08/09からの37*1.382=51営業日は2011/10/28。

② 2011/08/09からの80*0.618=49営業日は2011/10/26。

③ 2011/08/09からの17*2.618=45営業日は2011/10/20。

And we need to notice the “HENKABI” may become from 2011/10/20 to 2011/10/28.

1. The 37*1.382=51 business day from 2011/08/09 is 2011/10/28.

2. The 80*0.618=49 business day from 2011/08/09 is 2011/10/26.

3. The 17*2.618=45 business day from 2011/08/09 is 2011/10/20.

ICHI


2-3日レポートを休みます。

We are absent from a report for two or three days.

相場分析のリクエストがありましたら“Contact Us”からお知らせください。ご要望にお応えできるように努力いたします。

このブログはあくまでも個人的な見解であり、投資判断は各自でお願い致します。当ブログは一切の投資損益に対する責任を負いません。

ホームページに来て下さってありがとうございます。明日もよろしくお願いいたします。

If you have some request to analyze, please write to “Contact Us”.

We do best effort for your request.

These are only personal opinions on this blog, and you need the investment judgment in each one. This blog doesn’t assume the responsibility to all the investment profit and loss.

Thank for watching our contents. My best regards next day.

© 2025 Retar